3122
Fibre-specific white matter alterations in recovered COVID-19 patients
Yu Shen1, Yan Bai1, Xianchang Zhang2, Yaping Wu1, Menghuan Zhang1, and Meiyun Wang1
1Henan Provincial People's Hospital, Zhengzhou, China, 2MR Collaboration, Siemens Healthineers Ltd, Beijing, China
1Henan Provincial People's Hospital, Zhengzhou, China, 2MR Collaboration, Siemens Healthineers Ltd, Beijing, China
Synopsis
The brain fibre-specific changes in patients who recovered from Coronavirus Disease 2019 (COVID-19) for one year but still had anosmia (reCOVID19_ano) deserves to be investigated. This study used fixel based analysis (FBA), which is a novel diffusion MRI post-processing technique that enables fibre tract-specific statistical analysis, to investigate the white matter alterations in reCOVID19_ano. The results revealed that the intra-axonal volume in reCOVID19_ano was significantly increased in several fibre tracts. We speculate that impaired fibre tracts may recover gradually in a compensatory mechanism after one year recovery in reCOVID19_ano patients.
Introduction
Coronavirus Disease 2019 (COVID-19) has distributed worldwide since 20191. Abundant research revealed that COVID-19 also affected the central nervous system (CNS) and anosmia was one of the most common symptoms 2,3. Some studies have tried to uncover the pathology by evaluating the white matter alteration in recovered COVID-19 patients using tract based spatial statistic (TBSS), voxel-based morphometry (VBM) or tract-based analysis based on diffusion tensor imaging (DTI) data. However, DTI (and several other commonly used models) is unable to correctly resolve the “crossing fibre” issue, leading to problems with interpretation and limited biological specificity of associated metrics 4,5. High angular resolution diffusion imaging (HARDI) is a novel data acquisition strategy required for methods that aim to resolve crossing fibre6, as shown in Figure1. Fixel based analysis (FBA)7 was a fibre tract-specific statistical analysis approach based on constrained spherical deconvolution (CSD) technique to generate the microscopic fibre density (FD), the macroscopic fibre-bundle cross-section (FC) and combination of fibre density and cross-section (FDC) of fixels estimation by computing HARDI data. So far, there have been no studies investigating the fibre-specific changes in COVID-19 patients with anosmia (reCOVID19_ano) who recovered for about one year. The purpose of this study was to explore the fibre-specific white matter alterations in reCOVID19_ano based on FBA method by comparing with healthy controls (HC).Methods
The diffusion MRI data in 19 recovered COVID patients with anosmia (9 males, age: 53.7 ± 12.2 years, follow-up time: for about one year) and 23 HC (10 males, age: 53.9 ± 9.8 years) were acquired using HARDI method on a 3T MAGNETOM Prisma scanner (Siemens Healthcare, Erlangen, Germany) equipped with a 64-channel head/neck coil. The protocol included MP2RAGE and diffusion MRI sequence. The parameters for diffusion MRI were as follows: repetition time = 3300 ms, echo time = 64 ms, field of view = 207 × 207mm2, number of slices = 69, voxel size = 2.2 × 2.2 × 2.2 mm3, b value = 0/3000 s/mm2, directions = 64. All FBA processing steps were performed using MRtrix3 (www.mrtrix.org) software and scripts. The analysis procedure included 25 steps including preprocessing, computing average white matter response function, data resampled to 1.25mm, estimate fibre orientation distribution (FOD), generating FOD template, registration, computing FC, FD and FDC, whole brain tractography, generating fixel to fixel connectivity matrix and statistics. Statistical difference of FD, log (FC) and FDC were estimated using general linear model and family-wise error (FWE) method was used for multiple comparison correction. Gender and age were added in the GLM model for as nuisance covariates. P<0.05 was considered statistically significant. Johns Hopkins University White-Matter Tractography Atlas were used to define the brain regions of significant difference in FBA results.Results
Both FC and FDC was significantly increased in reCOVID19_ano groups (P<0.05, FWE corrected) compared with HC group in bilateral anterior thalamic radiation (ATR) , inferior fronto-occipital fasciculus (IFO) and uncinate fasciculus (UF), forceps majoras (FMJ), forceps minor (FMN), right inferior longitudinal fasciculus (ILF) and left superior longitudinal fasciculus (SLF). In addition, FDC also had a significant increase in bilateral corticospinal tract (CST) and left ILF, as shown in Figure 2. There was no significant difference between two groups in FD at a significant level of p<0.05 (FWE corrected). And the percentage(%) increased FC and FDC compared to HC was shown in Figure 3, 4.Discussion and Conclusion
This study identified a significant fibre-specific alteration in white matter of reCOVID19_ano. The FC and FDC value in multiple fibre tracts of reCOVID19_ano were significant higher than HC. This was an unanticipated result, which was different from our hypothesis that reCOVID19_ano may still have damaged white matter.FC is a macroscopic metric that quantifies the number of voxels a fibre tract occupies. Thus, the change of FC could be explained by the altered volume of intra-axonal restricted water in a fibre tract7. FDC is a more comprehensive metric related to the total intra-axonal volume in a fibre tract. It is combined with FD and FC, which reflects the changes of within-voxel FD and macroscopic FC. Increasing FC and FDC was shown in Figure 5. Compared to age and sex matched HC, reCOVID19_ano having higher FC and FDC in ATR, FMJ, FMN, ILF, SLF and CST means that the intra-axonal volume were higher in these fibre tracts. All of these fibre tracts were confirmed to be impaired in COVID-19 patients who recovered for 3 months in a previous study, which reported that the fractional anisotropy of these fibre tracts were decreased8. It seems reasonable to speculate that these impaired fibre tracts may had a compensatory recovery after nearly recovery in one year.Our study demonstrated that intra-axonal volume of several fibre tracts significantly increased in reCOVID19_ano, and the impaired fibre tracts had a compensatory recovery after about one year’s recovery.Acknowledgements
Zhengzhou Collaborative Innovation Major Project (20XTZX05015)References
- 1. Shereen MA, Khan S, Kazmi A, Bashir N, Siddique R. COVID-19 infection: Origin, transmission, and characteristics of human coronaviruses. J Adv Res. 2020 Mar 16;24:91-98.
- 2. Wang D, Hu B, Hu C, Zhu F, Liu X, Zhang J, Wang B, Xiang H, Cheng Z, Xiong Y, Zhao Y, Li Y, Wang X, Peng Z. Clinical Characteristics of 138 Hospitalized Patients With 2019 Novel Coronavirus-Infected Pneumonia in Wuhan, China. JAMA. 2020 Mar 17;323(11):1061-1069.
- 3. Mao L, Jin H, Wang M, Hu Y, Chen S, He Q, Chang J, Hong C, Zhou Y, Wang D, Miao X, Li Y, Hu B. Neurologic Manifestations of Hospitalized Patients With Coronavirus Disease 2019 in Wuhan, China. JAMA Neurol. 2020 Jun 1;77(6):683-690.
- 4. Wheeler-Kingshott CA, Cercignani M. About "axial" and "radial" diffusivities. Magn Reson Med. 2009 May;61(5):1255-60.
- 5. Jeurissen B, Leemans A, Tournier JD, Jones DK, Sijbers J. Investigating the prevalence of complex fiber configurations in white matter tissue with diffusion magnetic resonance imaging. Hum Brain Mapp. 2013 Nov;34(11):2747-66.
- 6. Tournier J D, F Calamante, Connelly A. Robust determination of the fibre orientation distribution in diffusion MRI: Non-negativity constrained super-resolved spherical deconvolution[J]. Neuroimage, 2007, 35(4):1459-1472.
- 7. Raffelt D A, Tournier J-Donald.. Investigating white matter fibre density and morphology using fixel-based analysis[J]. Neuroimage, 2017, 144:58-73.
- 8. Qin Y, Wu J, Chen T, Li J, Zhang G, Wu D, Zhou Y, Zheng N, Cai A, Ning Q, Manyande A, Xu F, Wang J, Zhu W. Long-term microstructure and cerebral blood flow changes in patients recovered from COVID-19 without neurological manifestations. J Clin Invest. 2021 Apr 15;131(8):e147329.
Figures
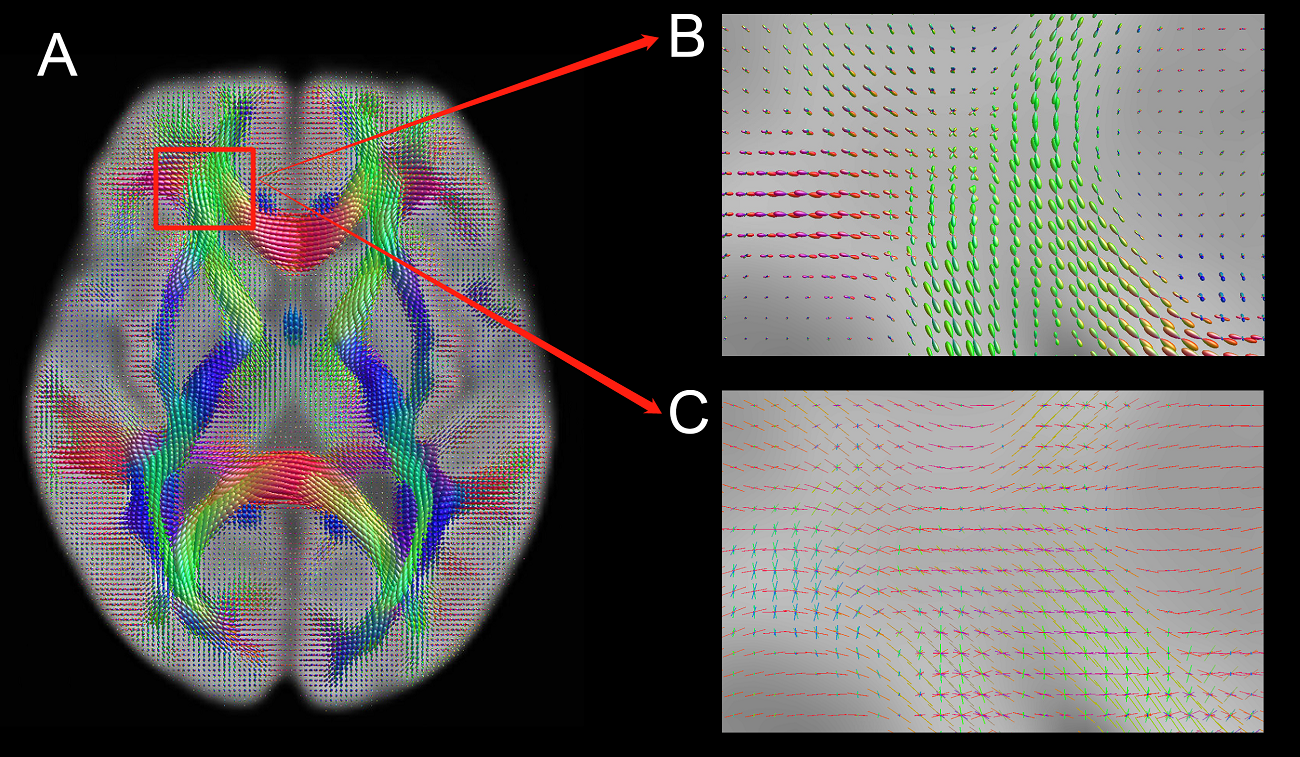
Figure 1. (A) Fibre orientation distribution (FOD) in three-dimensional reconstruction of HARDI. The fibre orientation in crossing fibre could be estimated accurately using CSD model instead the tensor model in DTI; (B) The zoomed insets indicates the FOD in crossing fibre; (C) There are multiple fibre orientations in crossing fibre.
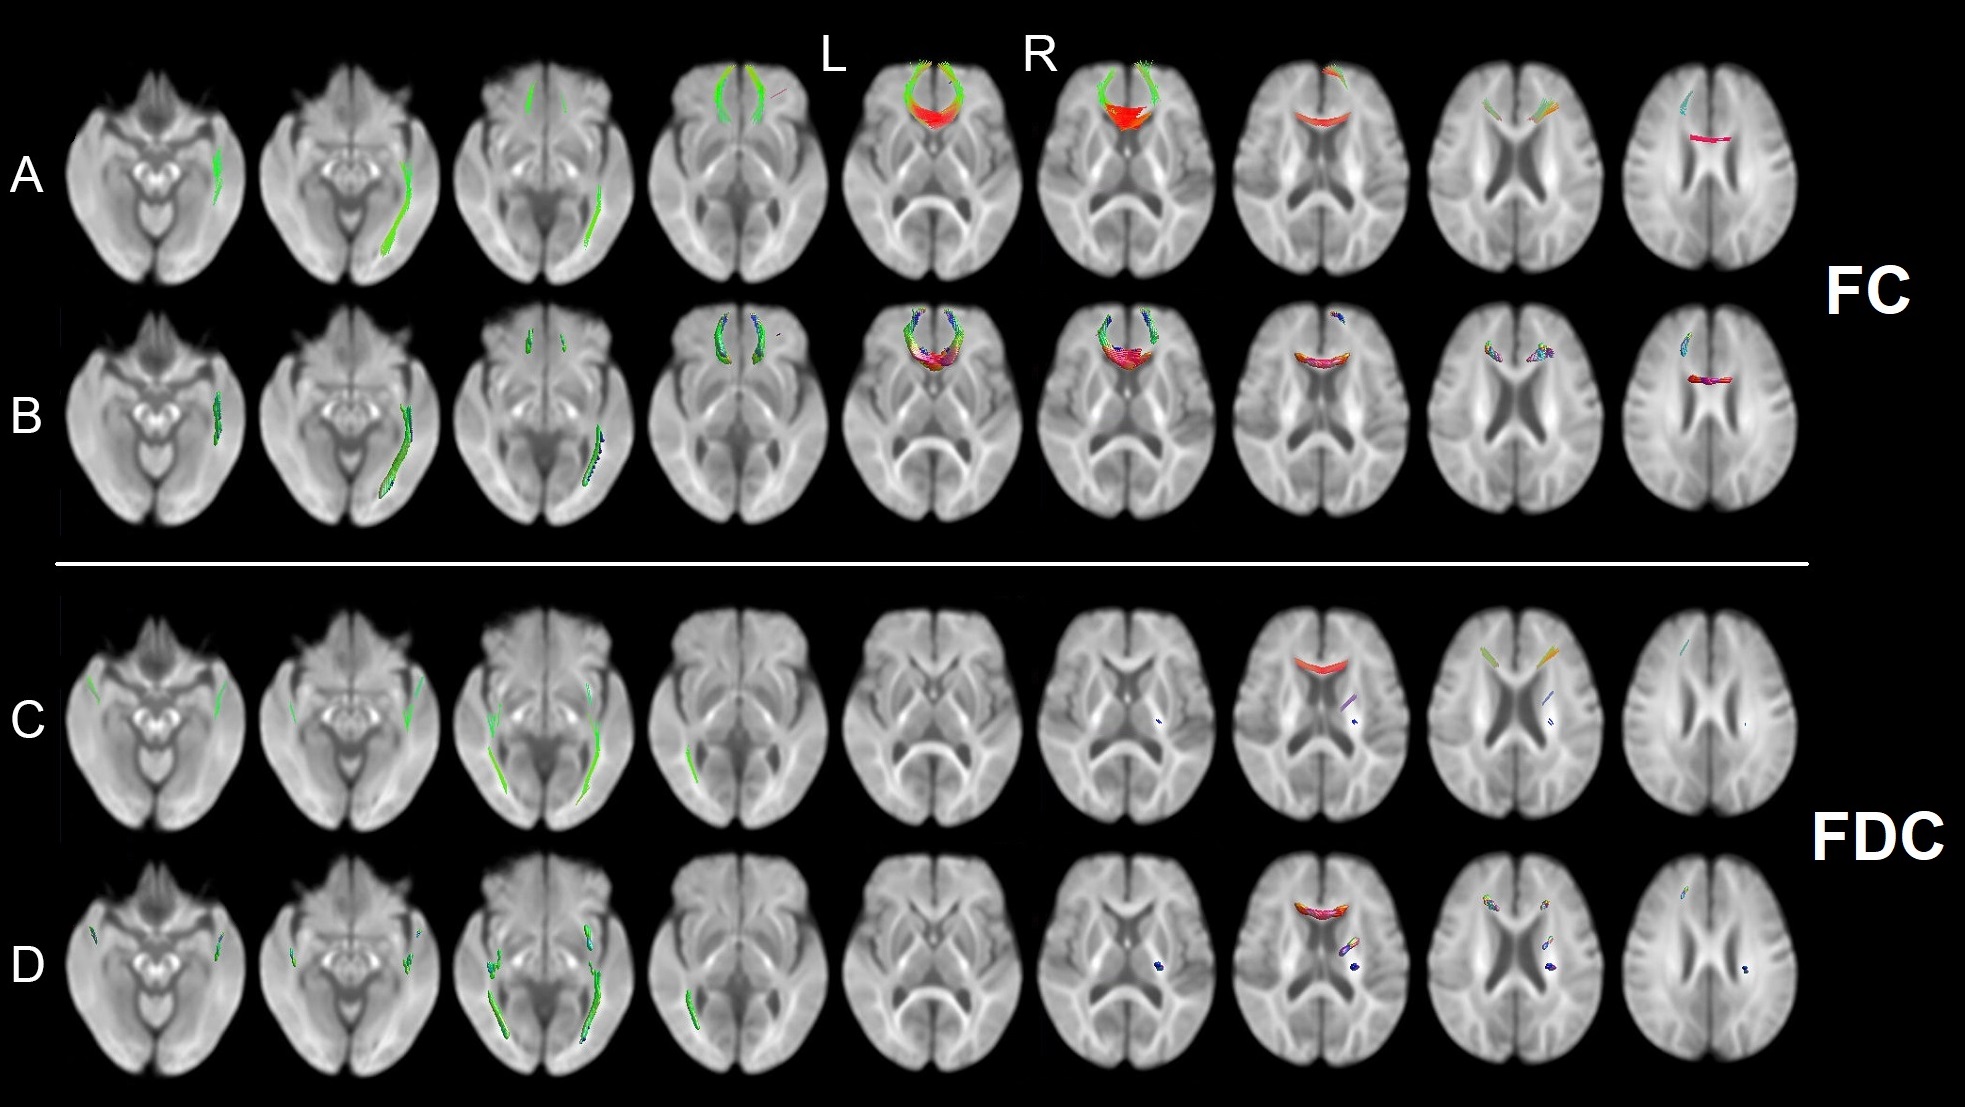
Figure 2. (A,B) Images showing fibre-specific increasing FC in reCOVID19_ano group from whole-brain FBA, displayed in fibre streamlines and FOD, respectively; (C,D) Images showing fibre-specific increasing FDC in reCOVID19_ano group from whole-brain FBA. (red: left-right, blue: inferior-superior, green: anterior-posterior)
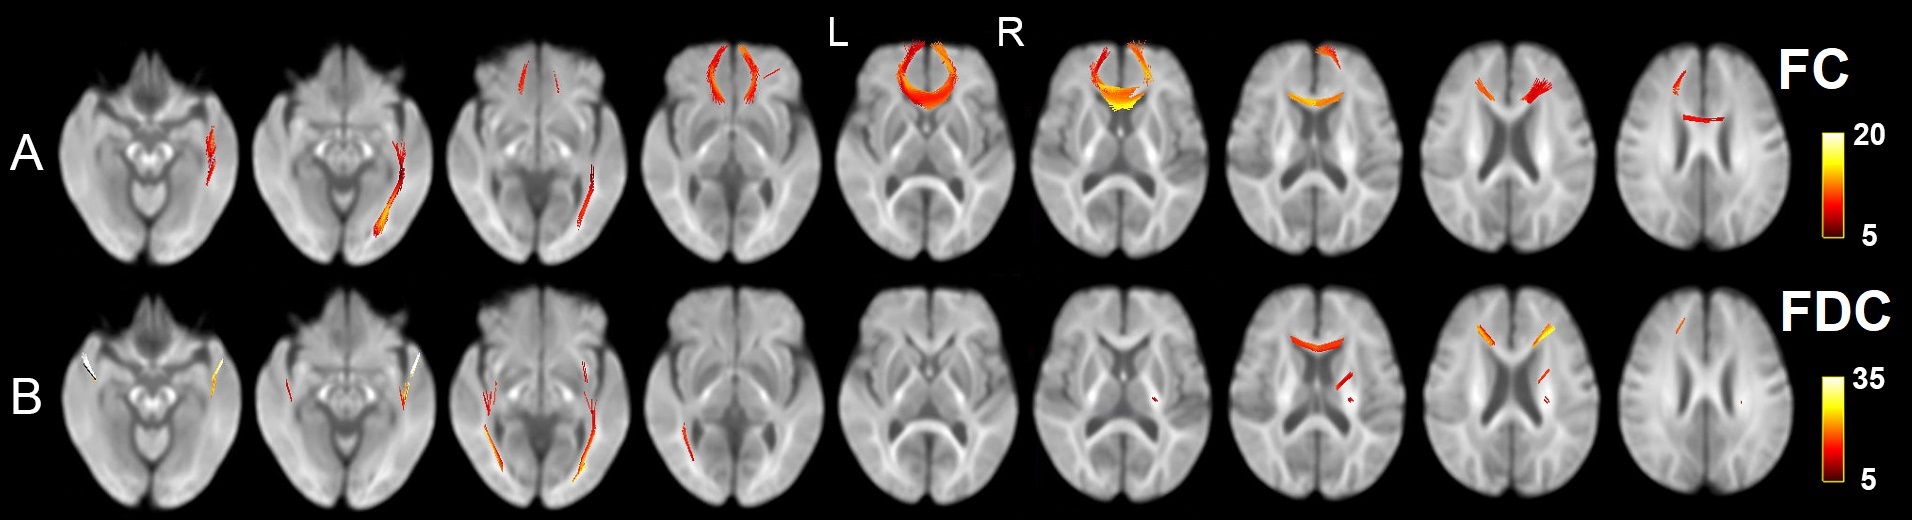
Figure 3. (A,B) Images showing fibre-specific increasing FC and FDC in reCOVID19_ano group from whole-brain FBA, displayed in fibre streamlines and colored by percentage (%) increased, respectively.
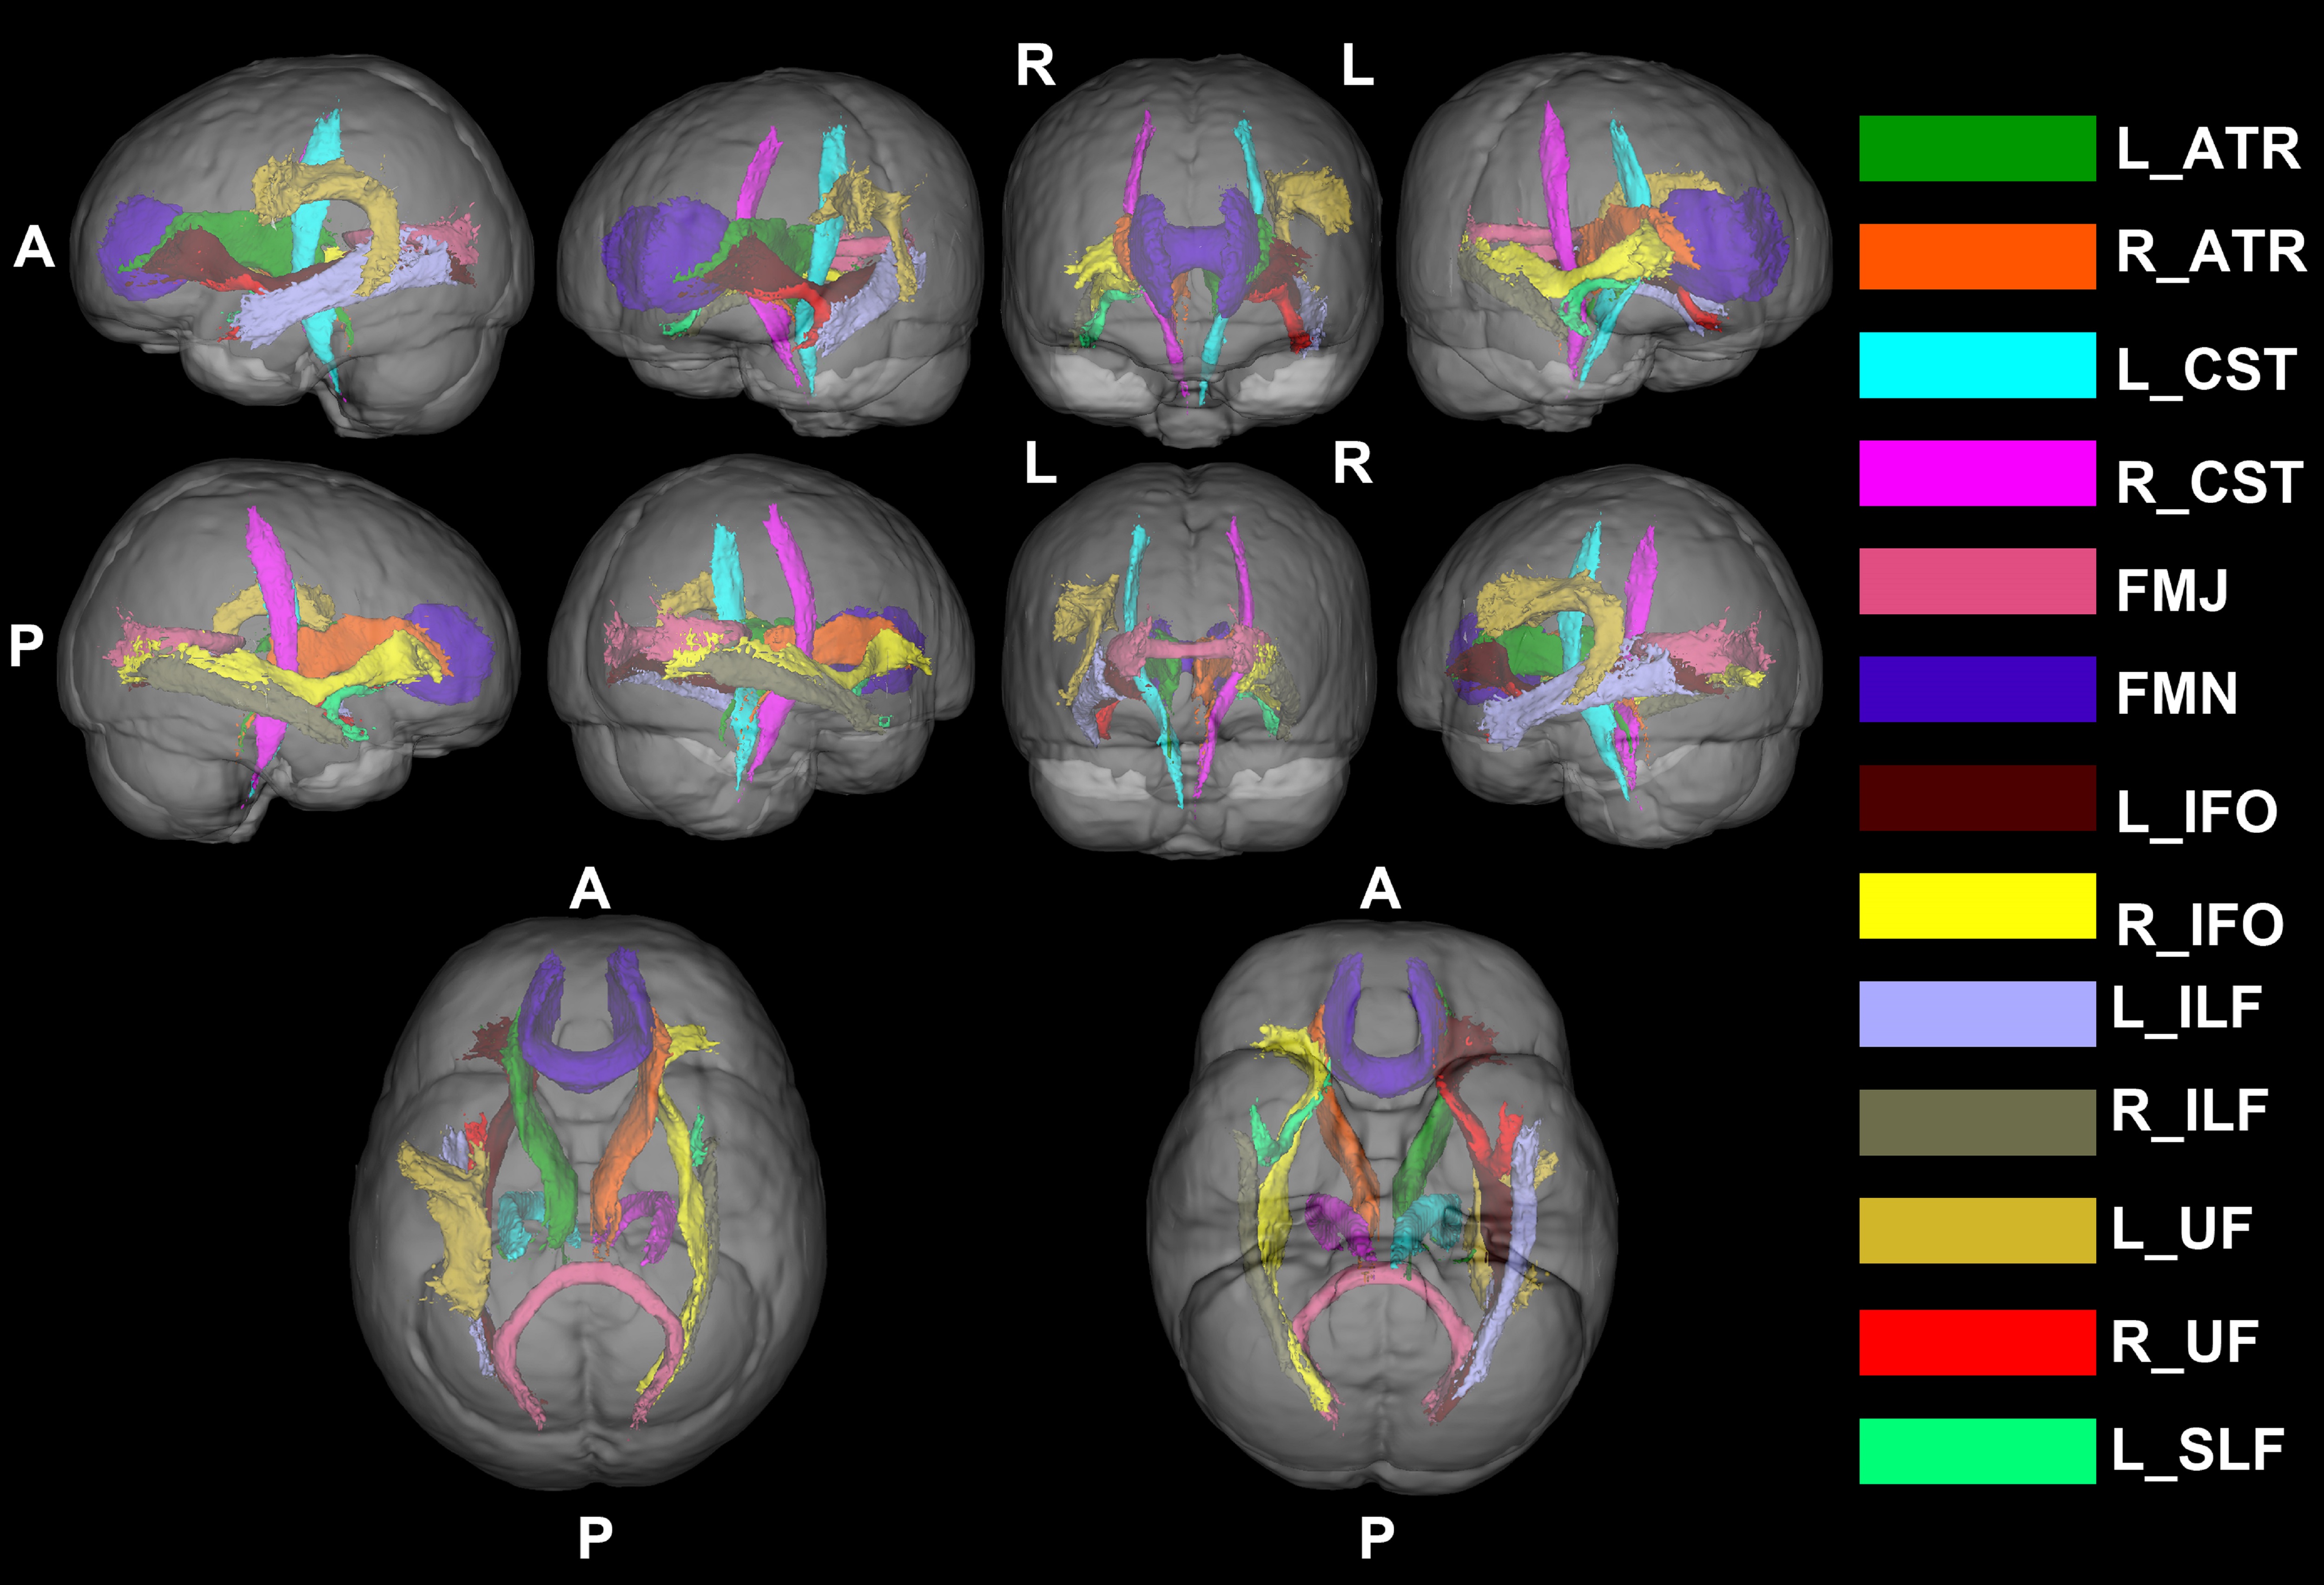
Figure 4. Image showing the fibre-specific increasing FC and FDC in reCOVID19_ano group from whole-brain FBA in 3D viewing. (ATR, anterior thalamic radiation; CST, corticospinal tract; FMJ, forceps majoras; FMN, forceps minor; IFO, inferior fronto-occipital fasciculus; ILF, inferior longitudinal fasciculus; UF, uncinate fasciculus; SLF, superior longitudinal fasciculus).
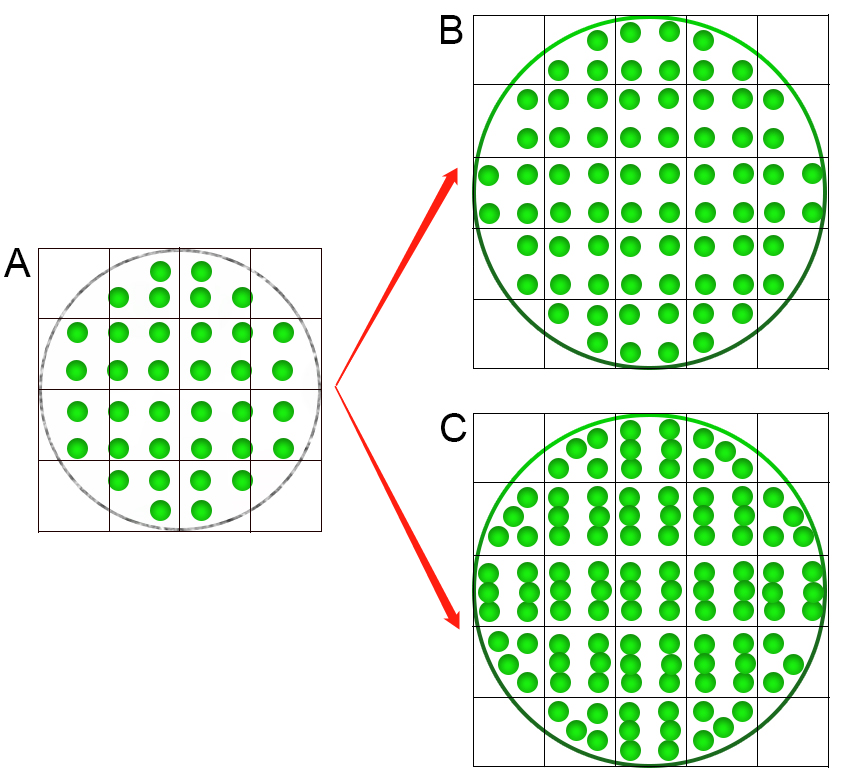
Figure 5. The schematic imaging representing increasing FC and FDC in one fibre tract (green circle represents axon and grid represents voxel)7. (A) The regular fiber-tract; (B) The increasing macroscopic FC representing the number of voxels occupied by a fibre tract increasing; (C) The increasing FDC representing both of the number of axons within a voxel and the number of voxels occupied by a fibre tract increasing. The changes in number of axons could also reflect the changes in intra-axonal volume of fibre tracts.
DOI: https://doi.org/10.58530/2022/3122