3120
Altered brain white matter connectom underlie affective disorders after mild traumatic brain injury at the acute stage1Lanzhou University Second Hospital, Lanzhou, China, 2MR Scientific Marketing, Siemens Healthineers, ShangHai, China
Synopsis
Mild traumatic brain injury (mTBI) is not a static event, but a progressive injury. The neuroanatomical alterations of mTBI at the acute stage can be an initial step of damage leading to cognitive and emotional deficit. The potential mechanisms conferring these deficits are poorly understood. In this study, we employed graph theory to explore alterations of white matter connectome and to study their relationship with neuropsychological examinations. We found disrupted topologic manner of the brain’s structural connectome, and the changes of right middle occipital gyrus explain depressive symptoms in the acute phase of mTBI due to white matter network alterations.
Introduction
Axons in white matter are vulnerable to mild traumatic brain injury (mTBI) because of their small diameter (∼3 μ) and long projections. Axonal injury could result in mechanical breaking of the axonal cytoskeleton that could affect axonal transportation which in turn affects communication between different brain structures1. Cognitive and behavioral deficits are frequent among patients with mTBI. mTBI also associated with a significantly increased risk of having subsequent affective disorders2. Screening for and addressing cognitive deficits and affective disorders at earlier stages following the injury is an important step to avoid persisting conditions that may pose a barrier to full recover. Most recently, network theory provides a principled abstraction of the human brain: reducing a complex system into a simpler representation from which to investigate brain organization and to capture the network’s topology3. The aims of this study were to explore alterations in white matter connectome through graph theory and to study their relationship with neurocognitive deficits and depressive symptoms in the acute phase of mTBI.Methods
Forty-two mTBI patients and thirty-seven age-, sex-, and educational -matched healthy controls (HCs) were recruited within 7 days after injury. All subjects underwent the same neuropsychological testing (Mini Mental State Examination (MMSE) and Self-rating Depression Scale (SDS)). Neuroimaging protocols were performed on a 3T MR scanner (Magnetom Verio, Siemens Healthineers, Erlangen, Germany). Sagittal three-dimensional turbo spin-echo (3D-TSE) T1WI (TI = 900 ms and flip angle = 12°) were acquired with 256-mm FOV and 192 contiguous partitions (1.0 mm) at 256 × 256 matrix. The diffusion tensor images were collected axially by using a single-shot echo-planar imaging sequence, with TE = 61 ms, TR = 7100 ms, 90 flip°, 128 × 128 acquisition matrix, 256-mm FOV, 50 slices and 3.0 mm thickness, 64 diffusion directions, b =1000 s/mm2. MRtrix3’s tckgen with constrained spherical deconvolution and anatomically constrained tractography were used for probabilistic tracking of the whole brain WM fibers. Based on Matlab R2013b, using GRETNA V2.0 software to generate graph theory metrics.Results
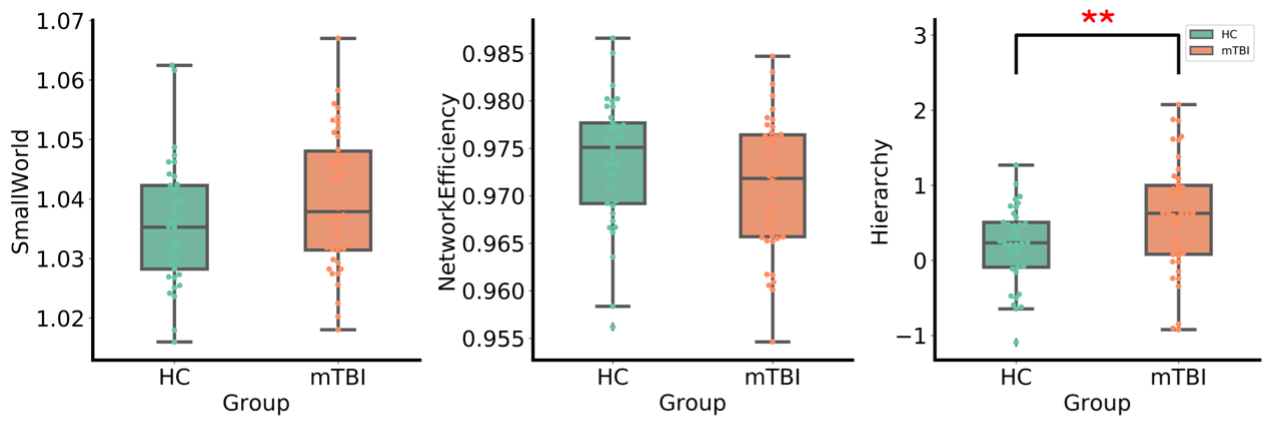
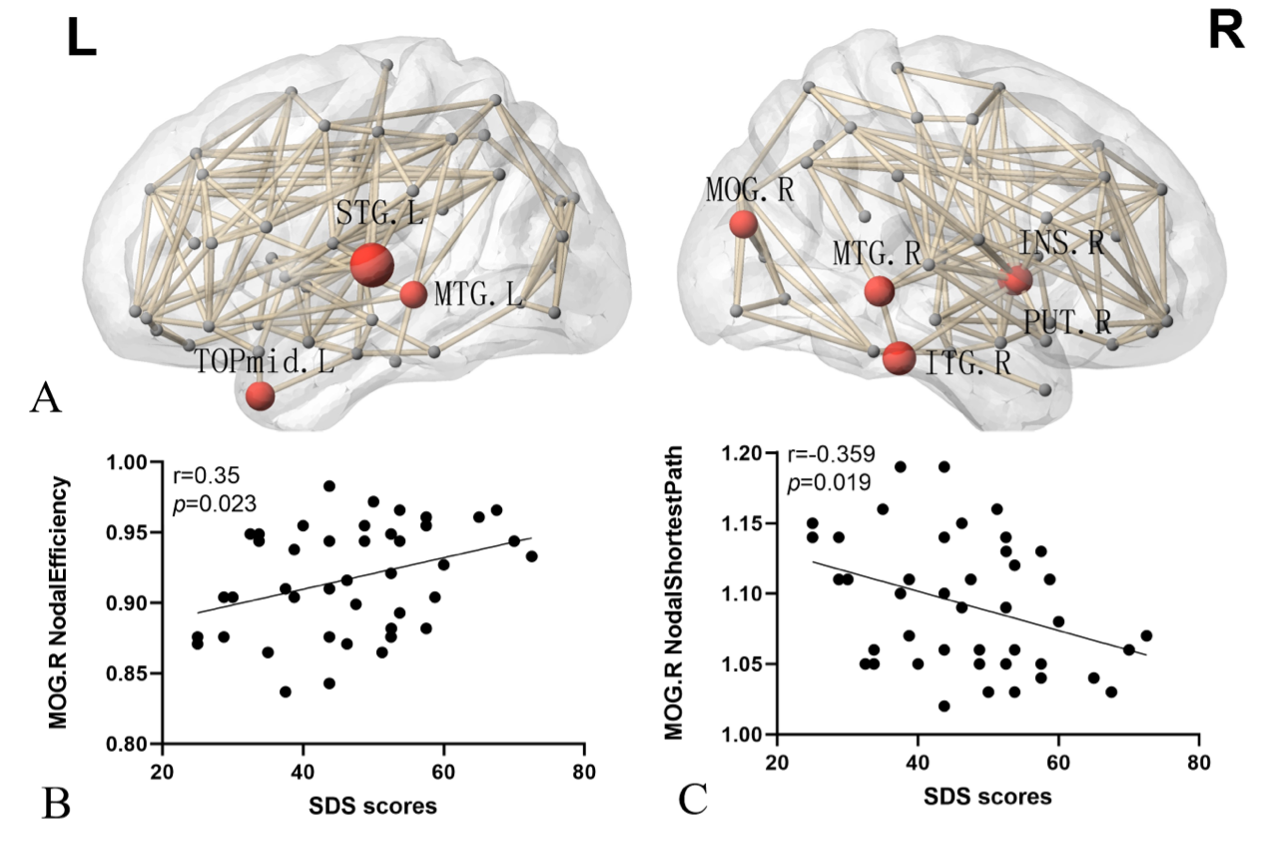
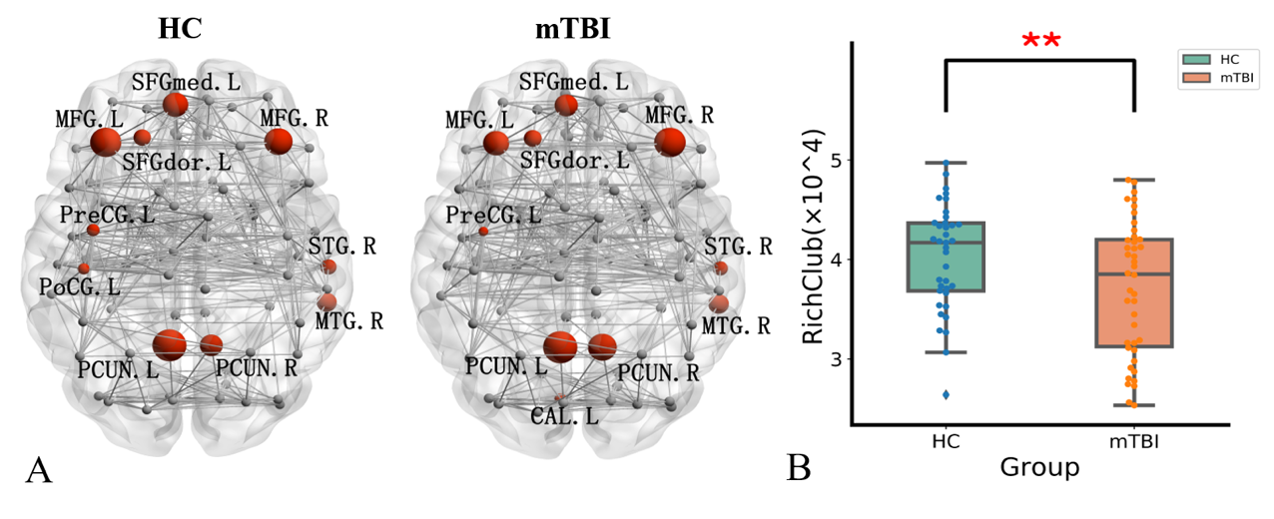
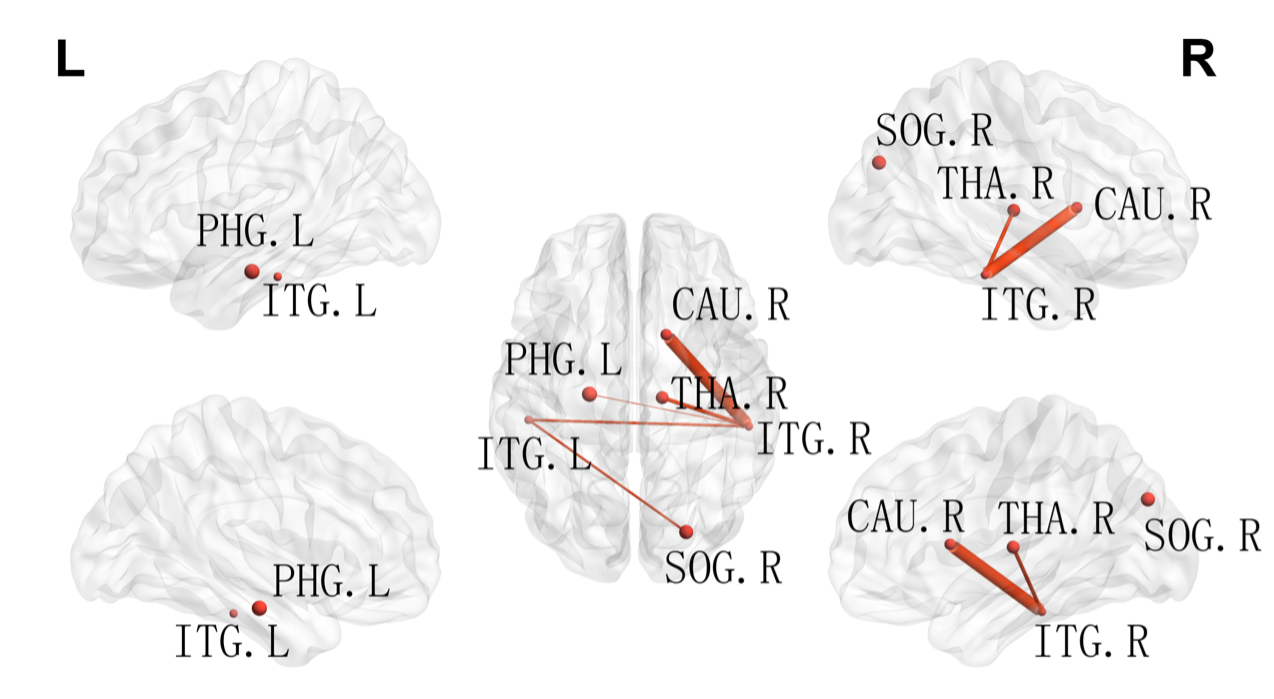
A cross-sectional global network properties comparison showed a significant increase in hierarchy (P<0.05) in acute mTBI group compared to HCs group(Fig. 1). Importantly, we observed less nodal efficiency and increased nodal shortest path length in some areas after mTBI. The Pearson analysis showed that the nodal efficiency decrease in the right middle occipital gyrus was positively correlated with SDS score (r=0.35, P=0.023), the length of nodal shortest path in the right middle occipital gyrus increase was negatively correlated with SDS score (r=0.-359, P=0.019) (Fig. 2). Moreover, similar hub distributions and less rich-club connection strength were found in the mTBI group compared with the HCs group (Fig. 3). Furthermore, a disrupted subnetwork was observed that consisted of widespread anatomic connections (P<0.05, corrected) (Fig. 4).Discussion
We found few significant differences in global network metrics between mTBI and HCs group. This is consistent with Chung and colleagues4, and there is no significant difference in global network metrics between the acute phase of mTBI and HCs group. The local network measures show that the importance of mTBI group nodes in the network is reduced. Changes in node of the right middle occipital gyrus were associated with the severity of depressive symptoms. The occipital lobe contains most of the anatomical areas of the visual cortex and plays a role in facial emotional perception. Teng et al found that the low frequency fluctuations and the functional connection of the left middle occipital gyrus was abnormal in female patients with severe depression5. The middle occipital gyrus may act as a connection, which is involved in the processing of cognitive biases of major depressive disorder by connected with limbic-cortical regions. The changes in the right middle occipital gyrus in the acute phase of the mTBI group may be a compensatory mechanism to alleviate the depressive symptoms of the patients. Similar hub node distribution was found in both groups. However, in patients with acute phase of mTBI, the hub node seems to be vulnerable and priority is affected. The high rotational acceleration forces of a concussion can cause brain damage and changes of high FA fiber tracts (rich-club subnetwork) than low FA (feeder and local subnetwork)6. In addition, a disrupted subnetwork was observed, which has the potential to discriminate individuals with mTBI from control participants.Conclusion
This study demonstrated disrupted topologic manner of the brain’s structural connectome in participants with mTBI. The local network properties of the right middle occipital gyrus explain depressive symptoms in the acute phase of mTBI due to white matter network alterations.Acknowledgements
This work was supported by the National Natural Science Foundation of China (No. 81960309).References
1. Narayana, P.A. White matter changes in patients with mild traumatic brain injury: MRI perspective. Concussion (London, England), 2017. 2(2): p. CNC35-CNC35.
2. Brett, B., et al. Longitudinal trajectory of depression symptom severity and the influence of concussion history and physical function over a 19-year period among former National Football League (NFL) players: an NFL-LONG Study. Journal of neurology, neurosurgery, and psychiatry, 2021.
3. Chung, A.W., et al. Characterising brain network topologies: A dynamic analysis approach using heat kernels. Neuroimage, 2016. 141: p. 490-501.
4. Chung, A.W., et al. Longitudinal structural connectomic and rich-club analysis in adolescent mTBI reveals persistent, distributed brain alterations acutely through to one year post-injury. Sci Rep, 2019. 9(1): p. 18833.
5. Teng, C., et al. Abnormal resting state activity of left middle occipital gyrus and its functional connectivity in female patients with major depressive disorder. Bmc Psychiatry, 2018. 18.
6. Collin, G., et al. Structural and Functional Aspects Relating to Cost and Benefit of Rich Club Organization in the Human Cerebral Cortex. Cerebral Cortex, 2014. 24(9): p. 2258-2267.
Figures