3119
Machine learning–based prediction of post-concussive working memory decline: a 1-year fMRI prospective study1Neuroscience Research Center, Taipei Medical University, Taipei, Taiwan, 2Translational Imaging Research Center, Taipei Medical University Hospital, Taipei, Taiwan, 3Department of Occupational Therapy, Kaohsiung Medical University, Kaohsiung, Taiwan
Synopsis
The objective of this study is to construct a framework for precise individualized prediction of post-concussive cognitive outcomes based on the early fMRI and neuropsychological biomarkers assessed at baseline to facilitate early therapeutic intervention and individualized rehabilitation strategies. Satisfactory predictions can be achieved for patients whose WM function did not recover after 3 months (accuracy = 87.5%), 6 months (accuracy = 83.3%), and 1 year (accuracy = 83.3%). The results prove the feasibility of using machine learning–based approaches to reveal predictive biomarkers related to poor post-concussive cognitive outcomes.
Introduction
Concussion, also known as mild traumatic brain injury (mTBI), commonly causes transient neurocognitive symptoms, but in approximately half of cases, it causes persistent cognitive impairment, including working memory (WM) deficit, which can be long-lasting and impede a patient’s return to work. The predictors of long-term cognitive outcomes following mTBI remain unclear because abnormality is often absent in structural imaging findings. The first objective of the study is to identify which functional magnetic resonance imaging (fMRI) biomarkers, demographic and/or neuropsychological measures at baseline can effectively predict cognitive outcomes during 1-year period after concussion; secondly, construct the machine learning based predictive models for discriminating patients at risk for post-concussive WM decline.Methods
We conducted a prospective, observational study (Table 1) of patients with mTBI (N = 70) who were compared with demographically-matched healthy controls (N = 48) enrolled between September 2015 to August 2020. Baseline details were collected within the first week of injury, and follow-ups were conducted at 6 weeks (n = 34), 3 months (n = 29), 6 months (n = 28), and 1 year (n = 25). MRI data were obtained using a 3T MRI scanner (Siemens MAGNETOM Prisma, Erlangen, Germany), and a 64-channel head coil was used to acquire the fMRI time series. Standard single-shot gradient-echo echo planar imaging–based fMRI (TR/TE = 2000/20 ms, flip angle = 90°, voxel size = 3 × 3 × 3.5 mm3, matrix = 64 × 64 × 40, and 105 volumes) was performed. Participants were instructed to keep their eyes closed and not entertain any particular thoughts while remaining awake, alert, and as motionless as possible. The experimental design of the N-back task in fMRI was performed using Presentation software (Version 18.1, Neurobehavioral Systems, Inc., Berkeley, CA, USA). An N-back task contains three epochs, each composed of a 30-second task period and a 30-second fixation on a crosshair. The interstimulus interval between each trial during a task period was 2 seconds. In total, 45 trials were performed, with each task consisting of 80% nontarget trials and 20% target trials. In each run of the N-back tasks, participants were instructed to pay attention to a series of six-digit numerical stimuli and respond by using the right index finger to press the button whenever the current stimulus matched the number that had been presented N times previously (N = 1 or 2) (1). The percentage signal change extracted from ROIs for the WM task performed by each participant was used for N-back WM fMRI features. Neuropsychological assessments (namely seven types of neuropsychological tests, clinical symptom measures, and the WAIS-IV test) and the demographic data (namely age, sex, education year, and score on the Glasgow Outcome Scale–Extended) were treated as the potential neuropsychological and demographic features, respectively. The candidate fMRI, demographic, and neuropsychological features were selected if there were a significant correlation with the estimated changes in WMI during the specific time period to train the support vector machine (SVM) classifier with 10-fold cross-validation for each prediction.Results & Discussions
This study examined post-concussion cognitive changes during a 1-year follow-up period. In particular, 24 patients (Fig. 1) who completed all baseline and follow-up sessions were selected for retrospective determination of the status of WM decline or recovery at each time point during the 1-year follow-up period. Although the relatively small dataset used in this study might be a concern, k-fold cross-validation (k = 10 in our case) was applied to generate a reliable and unbiased estimate of machine learning model performance on a limited dataset sample (2). Consistent with a previous study (3), in our study, patients with mTBI demonstrated significant cognitive recovery at the third month after concussion, followed by worsened performance after 6 months, which persisted until 1 year after concussion (Fig. 2). Approximately half of the patients experienced prolonged cognitive impairment, including impaired working memory index, digit span score, and arithmetic ability at 1-year follow up. The results are similar to those of previous studies, indicating that significant post-concussion cognitive impairment may persist for years despite some recovery over time (3). Even a single concussion can lead to persistent cognitive impairment in approximately half of patients (4). We constructed machine learning–based predictive models to differentiate patients at high risk for poor cognitive outcomes at the representative time periods after concussion. Satisfactory predictions were achieved for patients whose WM function did not recover after 3 months (accuracy = 87.5%; Fig. 3), worsened at 6 months (accuracy = 83.3%; Fig. 4), did not recover at 1 year (accuracy = 83.3%; Fig. 5), and worsened at 1 year compared with baseline (accuracy = 83.3%; Fig. 6).Conclusion
This study demonstrated the feasibility of individualized prediction for long-term post-concussive WM outcomes based on baseline fMRI and demographic features, opening a new avenue for early rehabilitation intervention in selected individuals with possible poor long-term cognitive outcomes.Acknowledgements
This work was partially supported by the Ministry of Science and Technology, Taiwan (MOST108–2321–B–038–008 and MOST110–2314–B–038–086–MY3) and Taipei Medical University, Taiwan (TMU109-AE1-B18).References
1. Owen AM, McMillan KM, Laird AR, & Bullmore E (2005) N-back working memory paradigm: a meta-analysis of normative functional neuroimaging studies. Hum Brain Mapp 25(1):46-59.
2. Bengio Y & Grandvalet Y (2004) No unbiased estimator of the variance of k-fold cross-validation. Journal of machine learning research 5(Sep):1089-1105.
3. Carroll EL, et al. (2020) Mild traumatic brain injury recovery: a growth curve modelling analysis over 2 years. Journal of neurology 267(11):3223-3234.
4. McInnes K, Friesen CL, MacKenzie DE, Westwood DA, & Boe SG (2017) Mild Traumatic Brain Injury (mTBI) and chronic cognitive impairment: A scoping review. PloS one 12(4):e0174847.
Figures
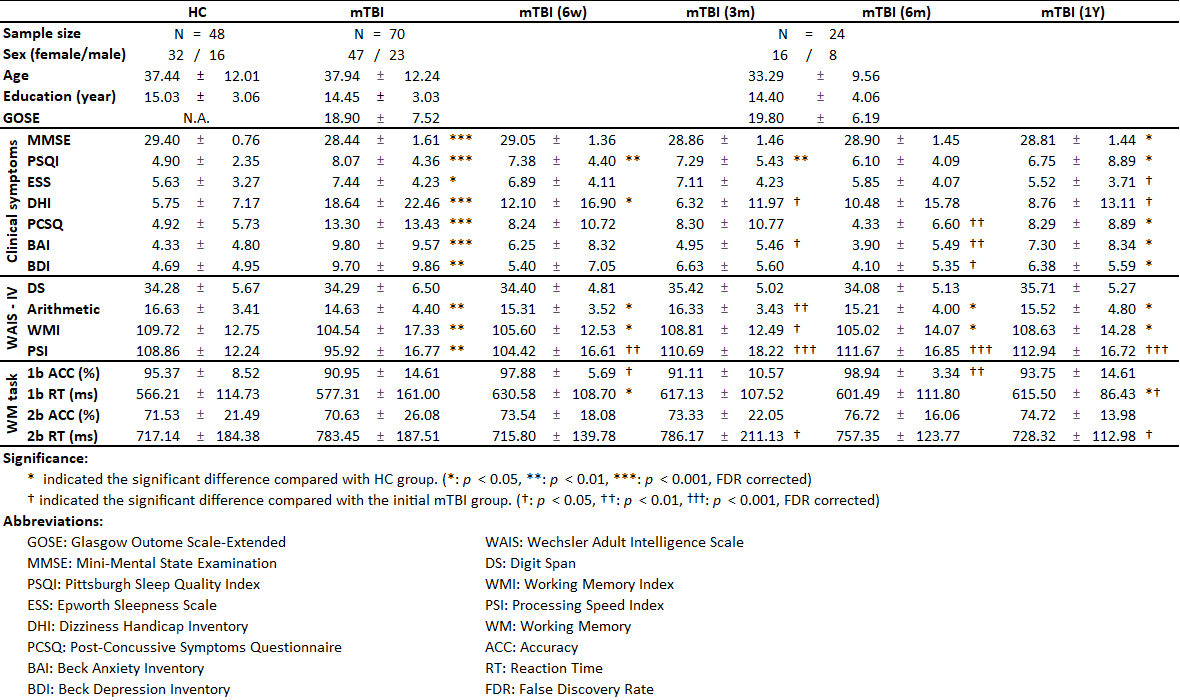
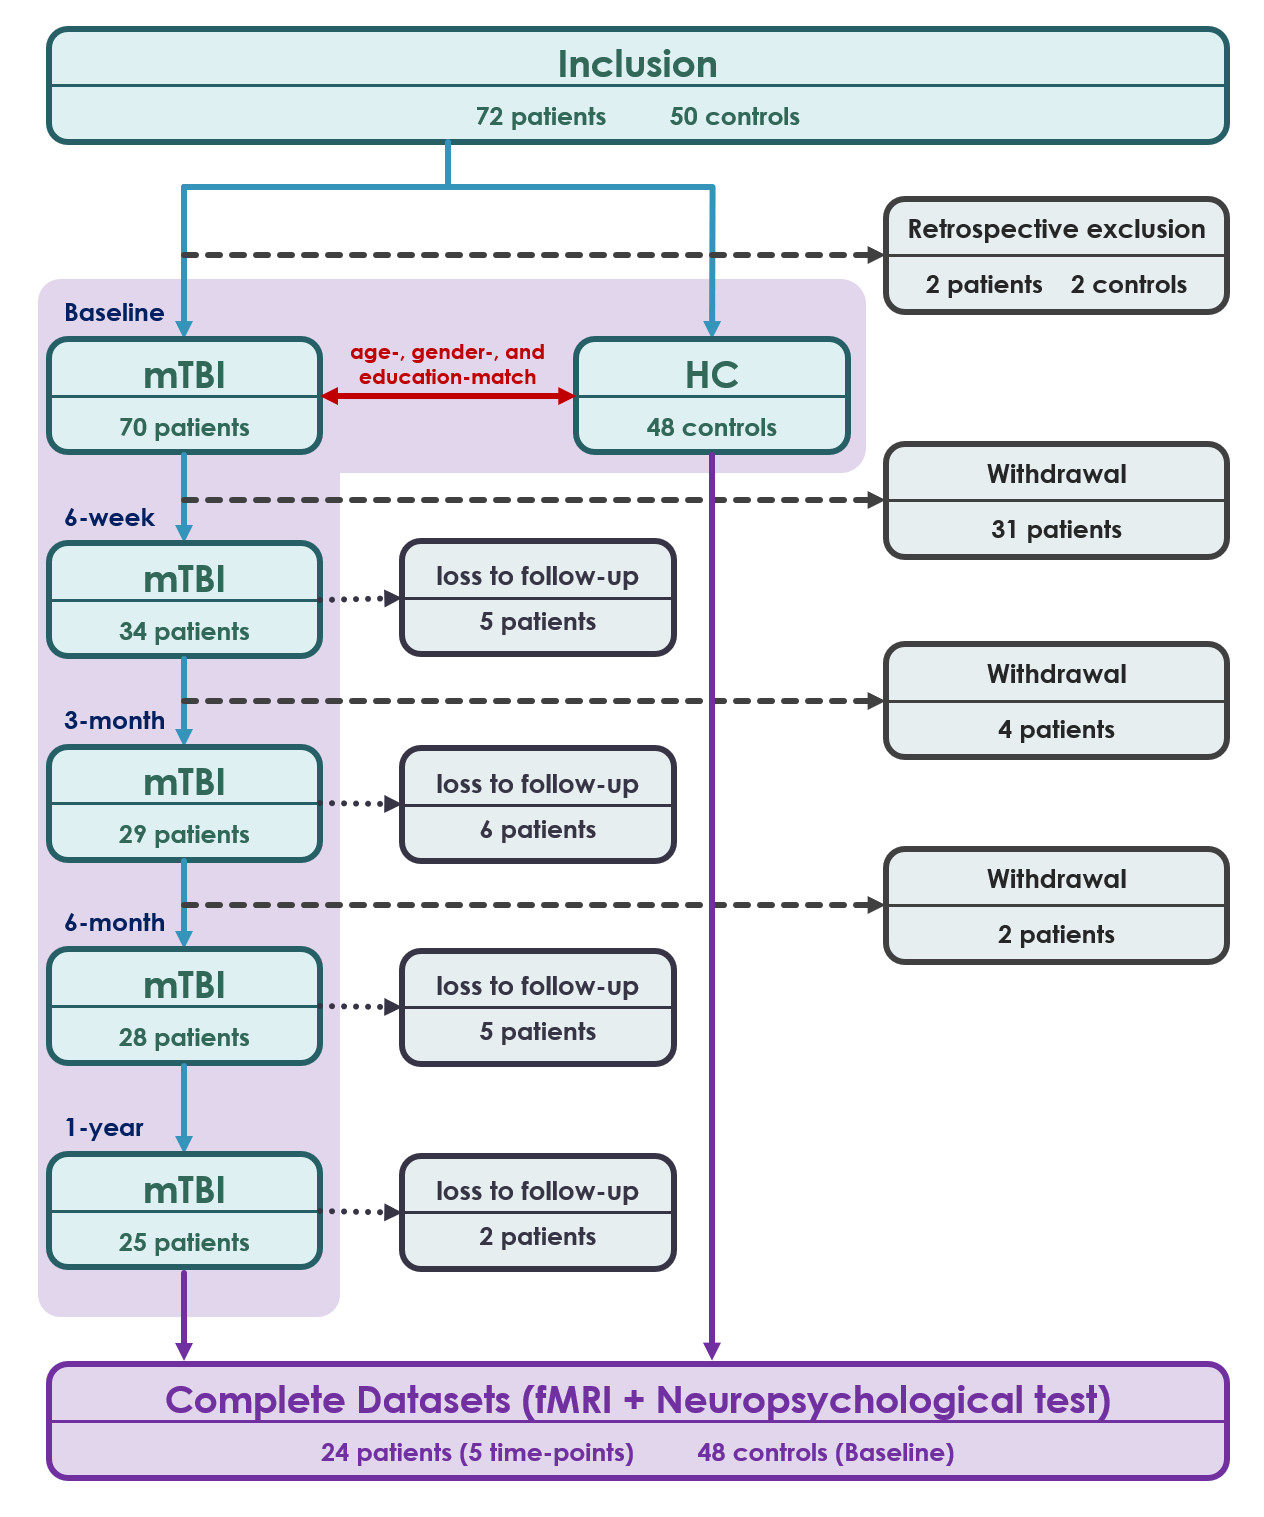
Fig. 1. Flow chart.
Flow chart of participant inclusion and exclusion in this study.
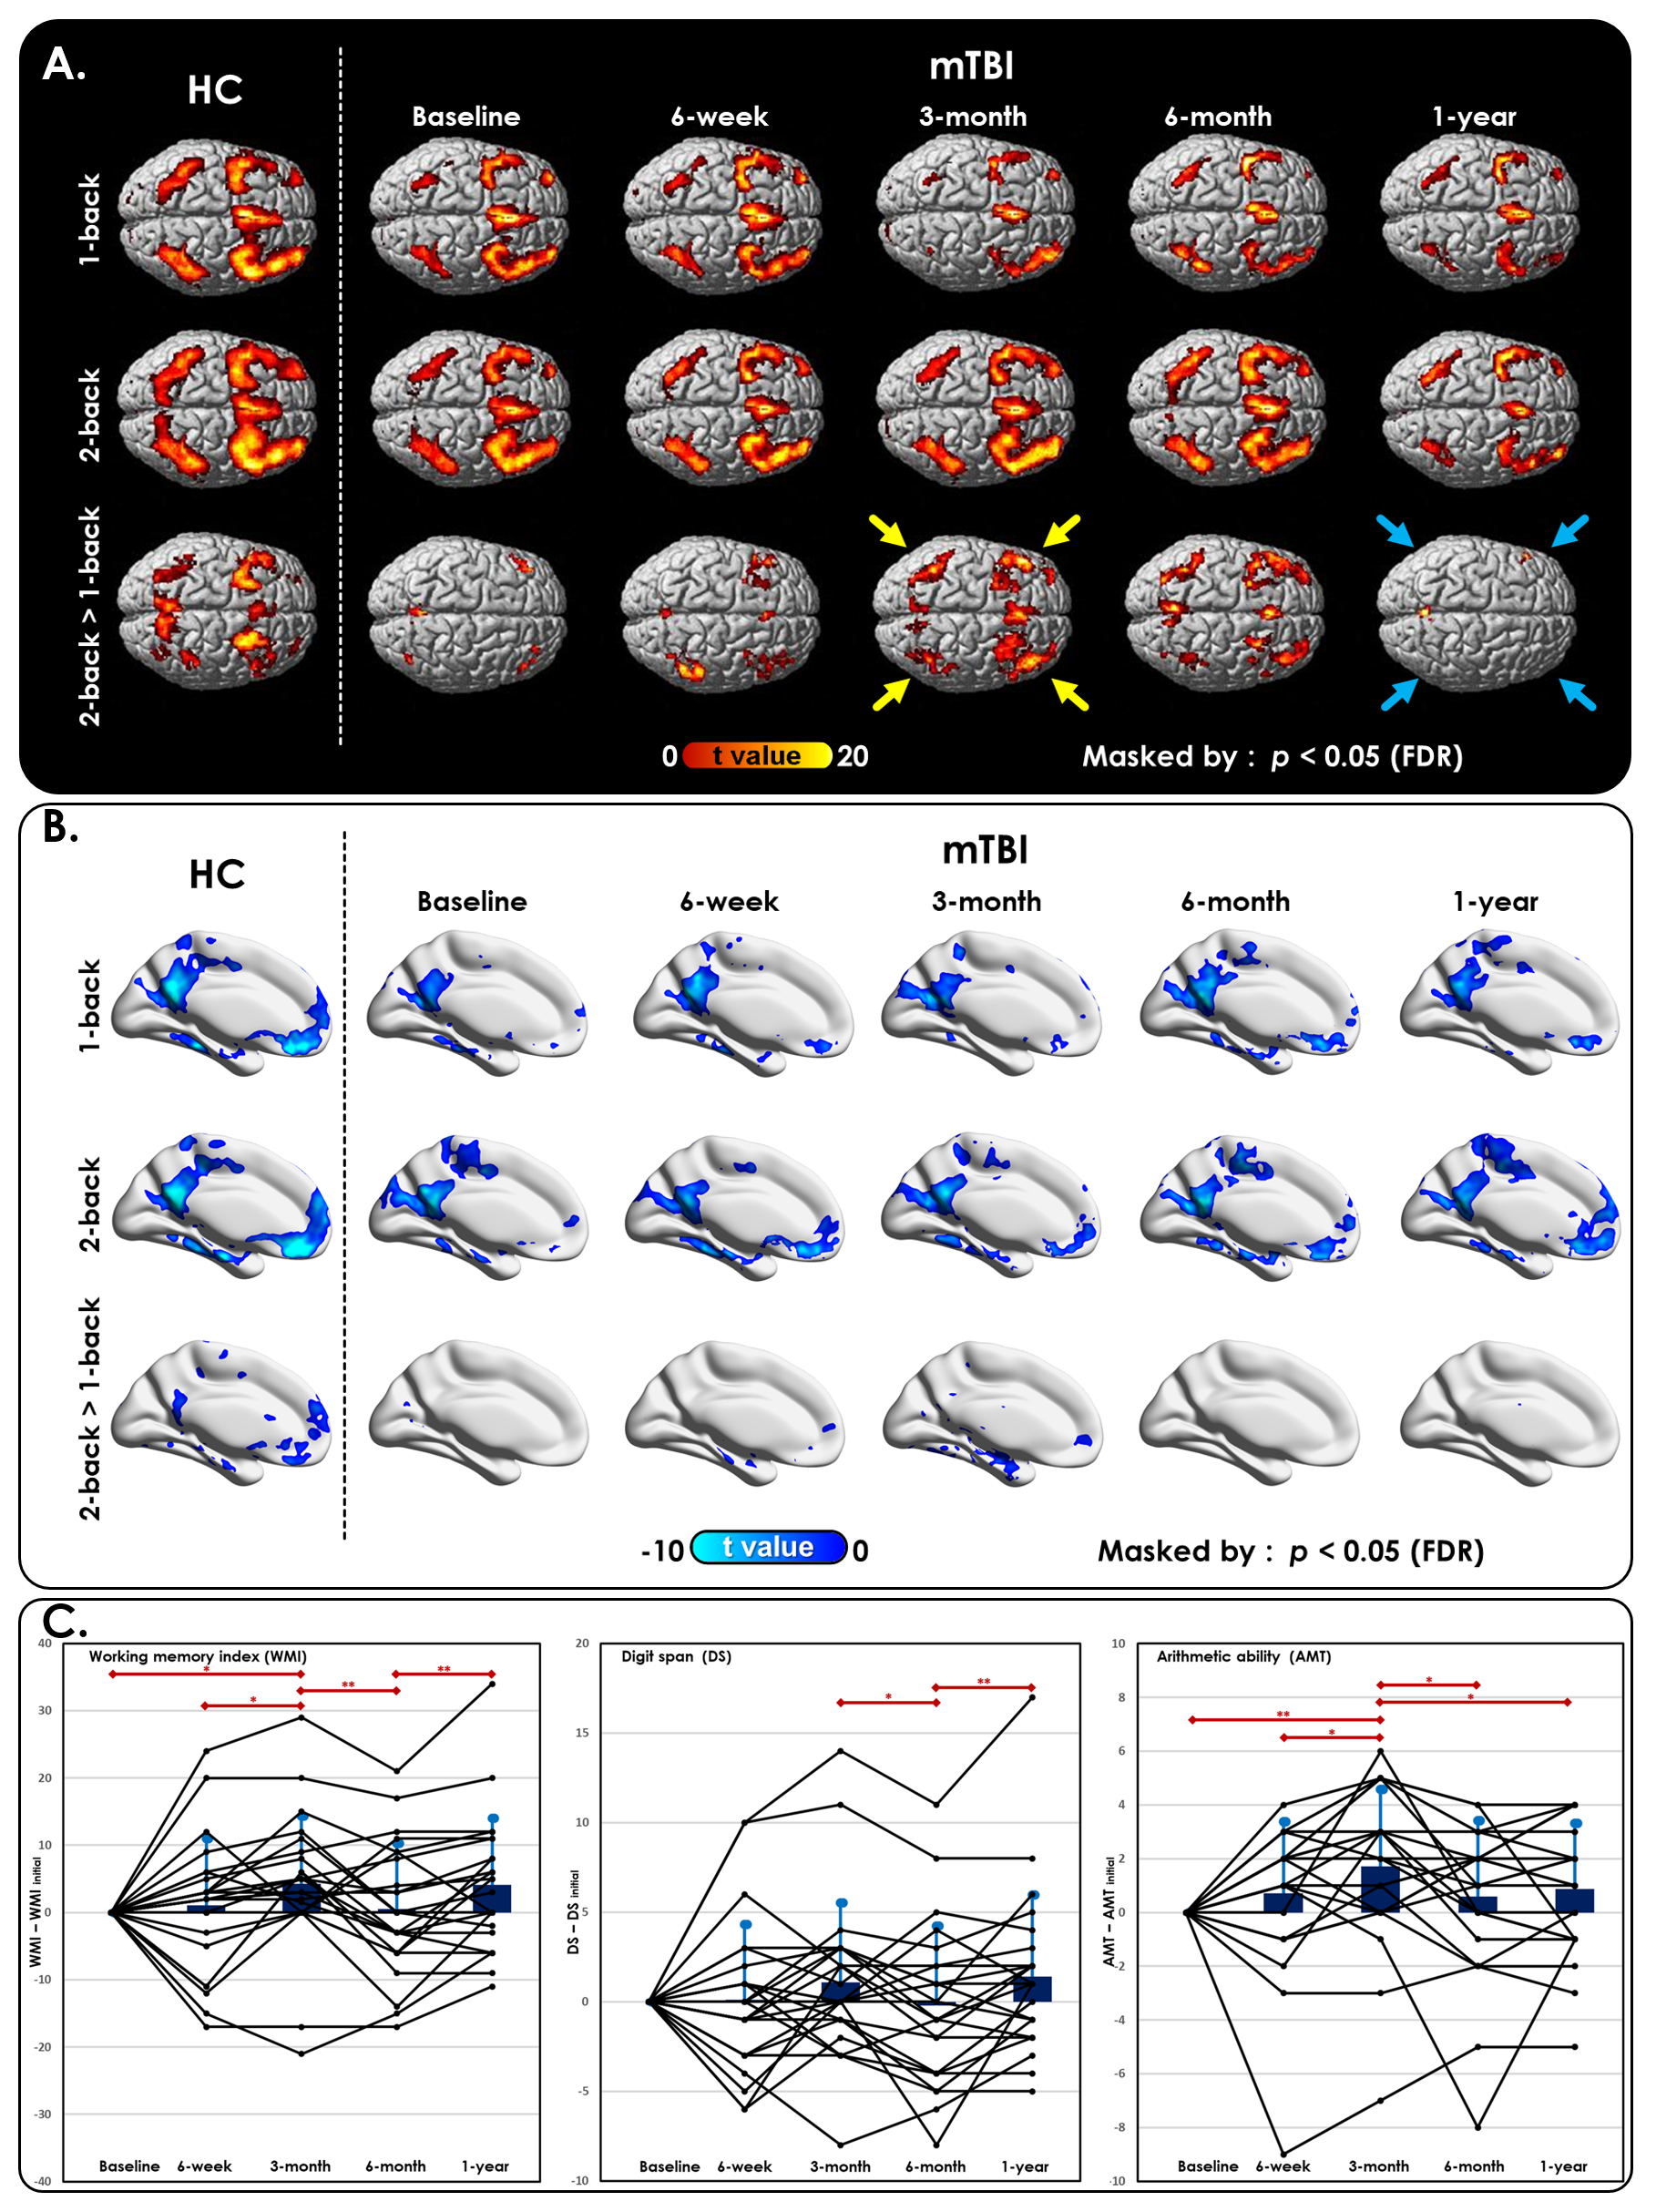
Fig. 2. Post-concussive cognitive changes over time between baseline and follow-up.
(A) Activation and (B) deactivation maps of 1-back, 2-back, and 2-back > 1-back WM conditions in HCs and patients with mTBI at each time point. Dynamic individual patients’ trajectories of (C) WMI, (D) AMT, and (E) DS at each time point. The trajectories were normalized by subtracting baseline measurements for better visualization. Compared with baseline measurements, roughly half of the patients with mTBI displayed reduced cognitive function after 1 year.
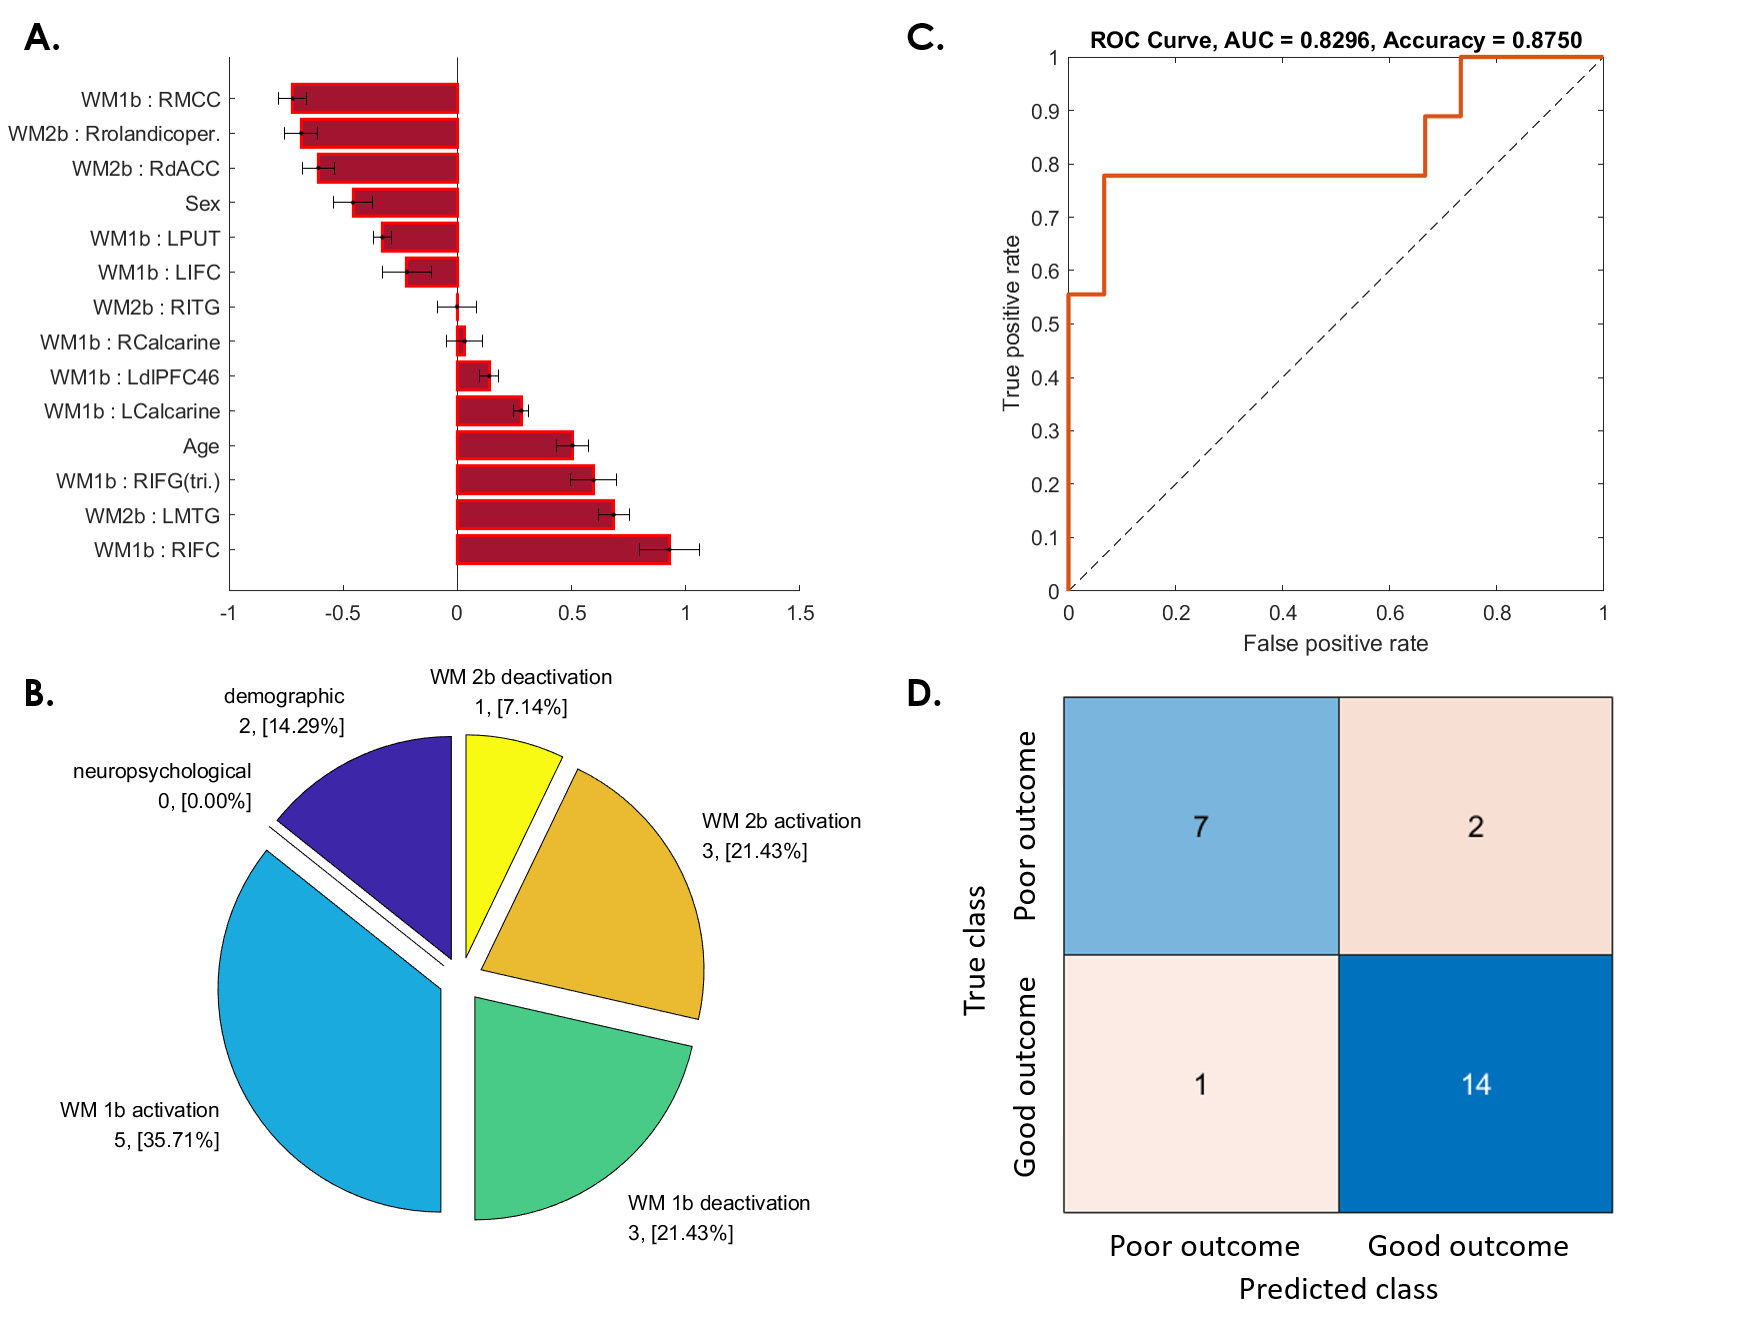
Fig. 3. SVM predictive model for 37.5% of patients whose WM ability did not recover at 3-month follow-up.
(A) The red bar graph and the corresponding error bar, respectively, represent the average and standard deviation of the discriminative feature weights among the 10 cross-validated SVM classifiers.
(B) Profiles of selected features for constructing the SVM classification model.
(C) ROC curve of the selected feature to differentiate the “poor outcome group” from the “good outcome group.”
(D) Confusion matrix to summarize the result of this binary classification model.
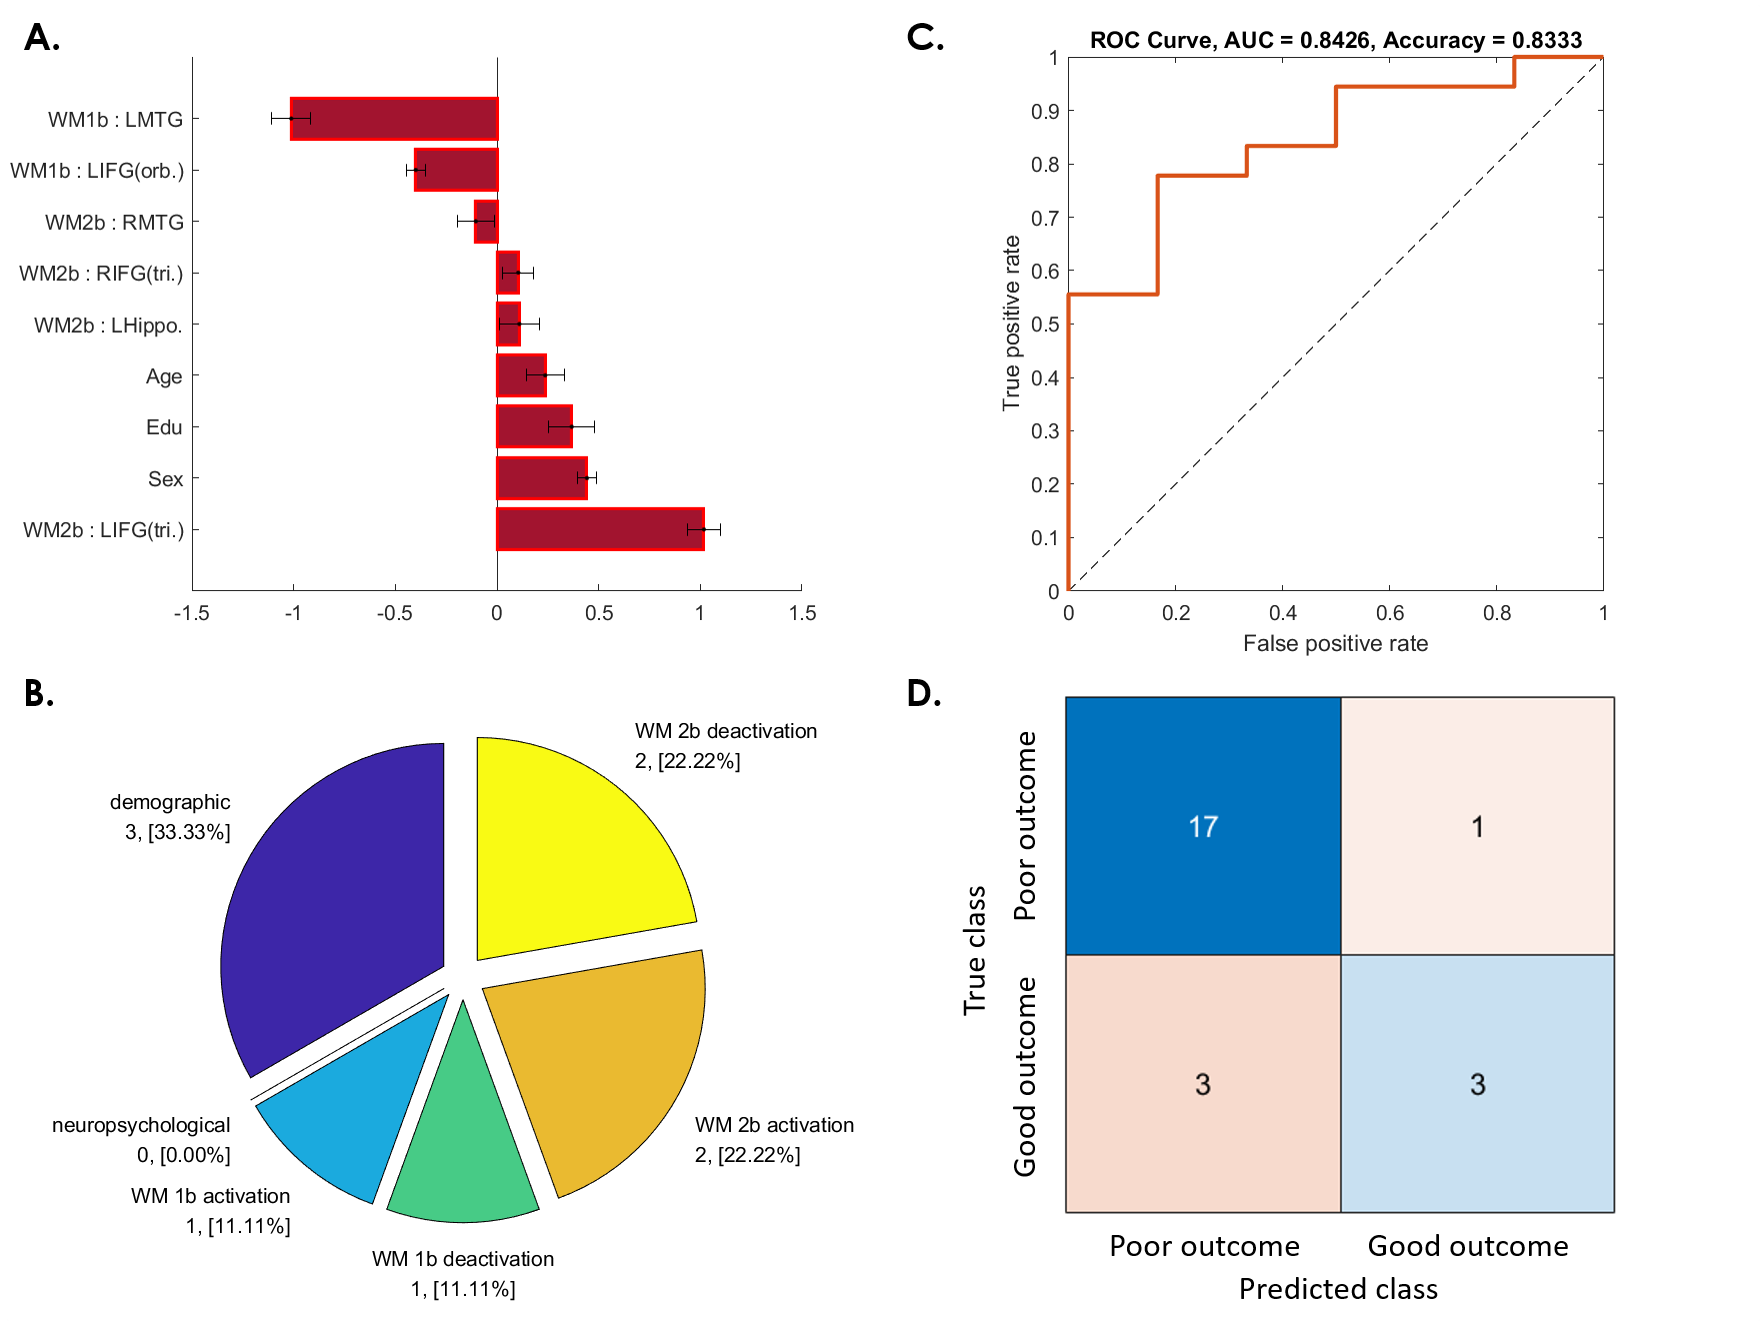
Fig. 4. SVM predictive model for 75% of patients whose WM ability dropped from 3 to 6 months after concussion.
(A) The red bar graph and the corresponding error bar, respectively, represent the average and standard deviation of the discriminative feature weights among the 10 cross-validated SVM classifiers.
(B) Profiles of the selected features for constructing the SVM classification model.
(C) ROC curve of the selected feature to discriminate the “poor outcome group” from the “good outcome group.”
(D) Confusion matrix to summarize the result of this binary classification model.

Fig. 5. SVM predictive model for 37.5% of patients whose WM ability dropped from 6-month to 1-year follow-up.
(A) The red bar graph and the corresponding error bar, respectively, represent the average and standard deviation of the discriminative feature weights among the 10 cross-validated SVM classifiers.
(B) Profiles of the selected features for constructing the SVM classification model.
(C) ROC curve of the selected feature to discriminate the “poor outcome group” from the “good outcome group.”
(D) Confusion matrix to summarize the result of this binary classification model.
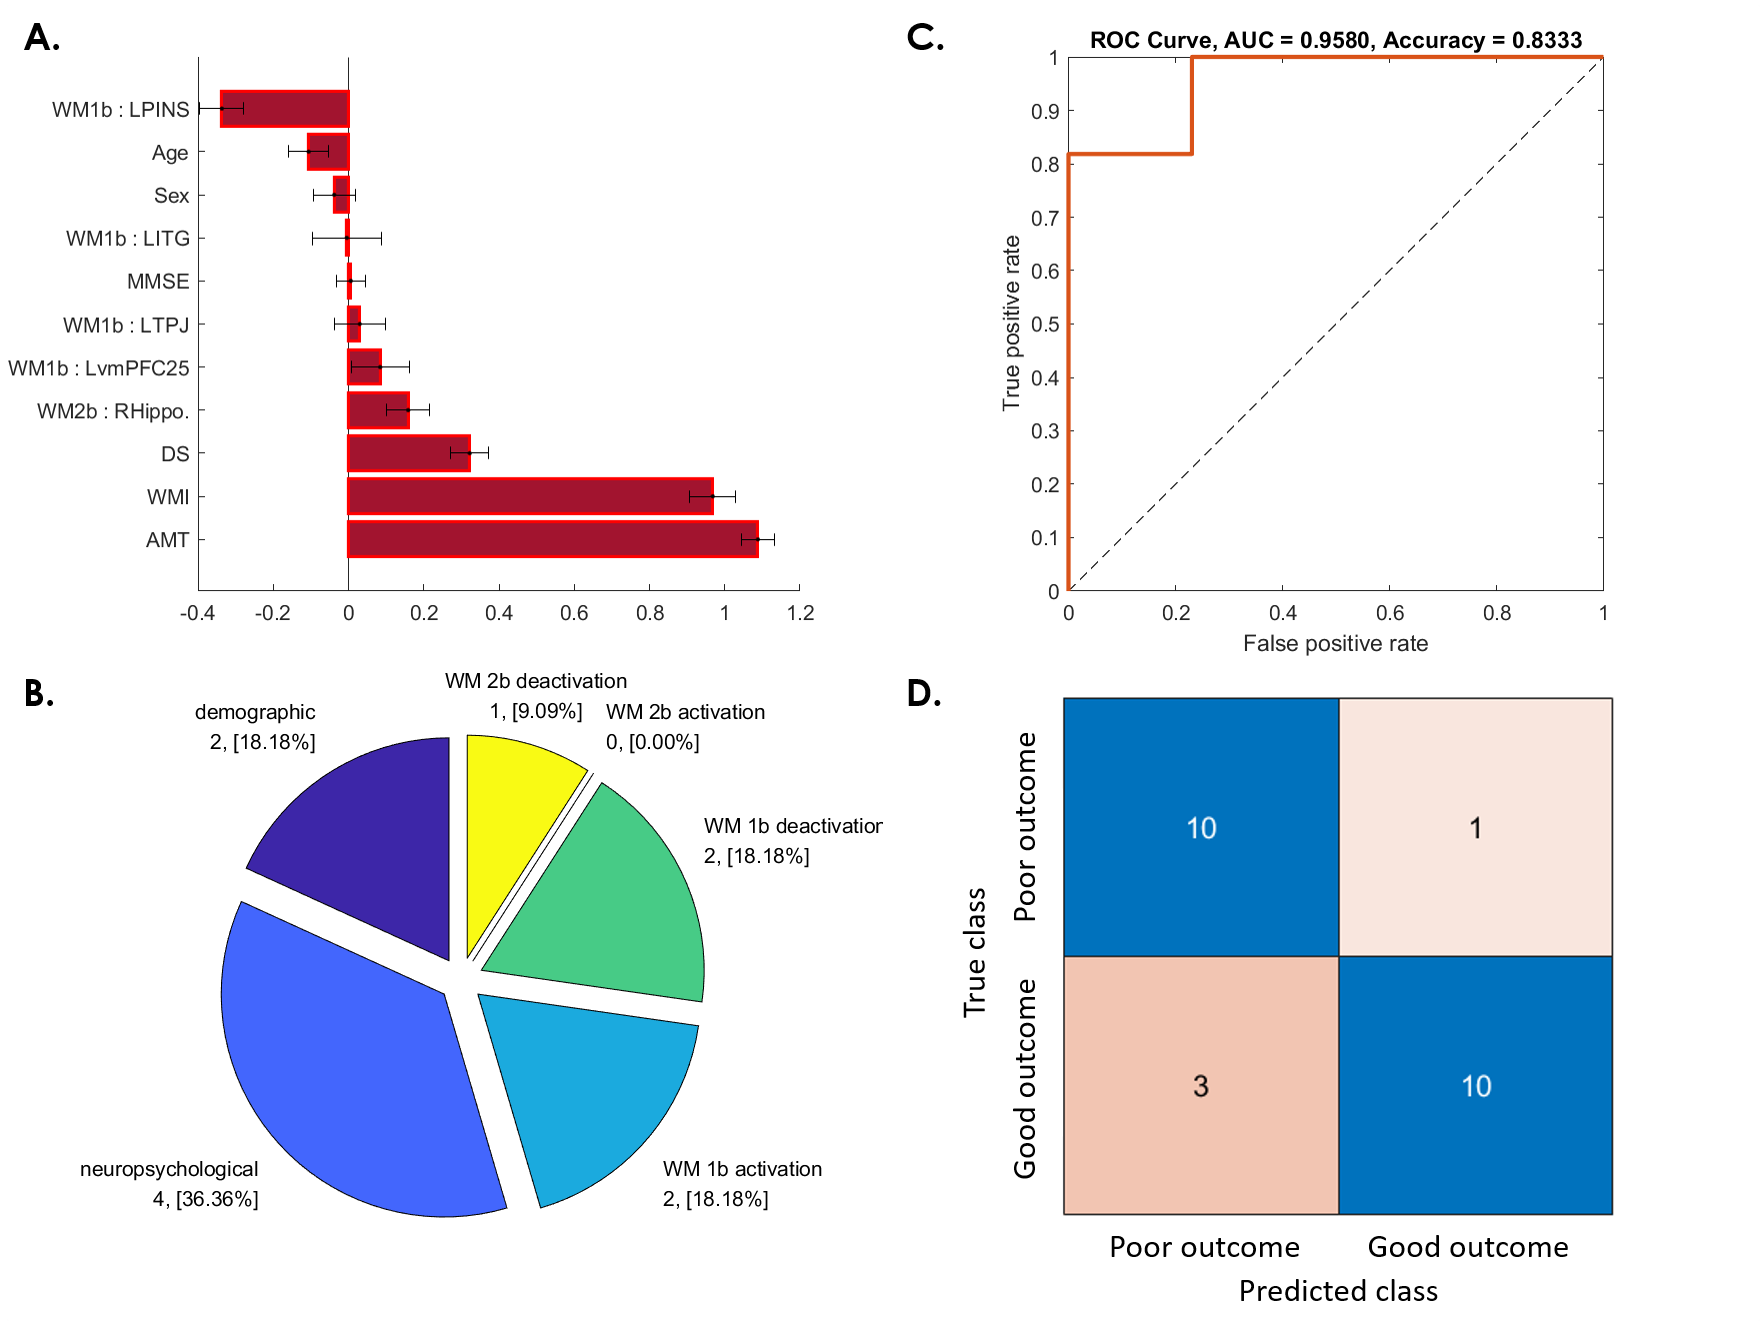
Fig. 6. SVM predictive model for 45.83% of patients whose WM ability after 1 year became worse than at baseline.
(A) The red bar graph and the corresponding error bar, respectively, represent the average and standard deviation of the discriminative feature weights among the 10 cross-validated SVM classifiers.
(B) Profiles of the selected features for constructing the SVM classification model.
(C) ROC curve of the selected feature to discriminate the “poor outcome group” from the “good outcome group.”
(D) Confusion matrix to summarize the result of this binary classification model.