3115
Age Related Atypical Dynamic Brain Activity of Autism Spectrum Disorder Analyzed by Co-Activate Pattern1School of Biomedical Engineering, Faculty of Electronic and Electrical Engineering, Dalian University of Technology, Dalian, China
Synopsis
Atypical dynamic brain activities (dBAs) of people with autism spectrum disorder (ASD) were reported related to ASD symptoms. However, the most commonly used dynamic function connectivity method is affected by sliding window size. In this study, co-activate pattern analysis which keeps high temporal resolution and without the limitation of window size, is used to evaluate dBAs. It is found that the atypical dBAs of ASD is related to ASD core symptoms, and the atypical dBAs pattern of ASD is also affected by age.
Introduction
Many studies have proved people with autism spectrum disorder (ASD) had atypical brain function and the connectivities among default mode network (DMN), control network (Cont) and salience network (SN) was the most concerned[1-3]. Studies analyzed dynamic brain activity (dBA) revealed that ASD group had cognitive flexibility deficits. However, most of these studies used dynamic function connectivity method which had low time resolution (about 30s to 1 min) and would be affected by the sliding window size. In this study, co-activate pattern (CAP) which shows advantage on high time resolution (1 TR) and without the limitation of window size was applied to detect the atypical dBA of ASD[4-6] by analyzing 765 subjects obtained from ABIDE II[7] dataset. We found that atypical dBA dominated by the triple networks was related to the ASD core symptoms. Age also affected the results that atypical dBA of SN for ASD was observed in children and adults, while atypical dBA of Cont were observed in children and adolescents with ASD.Method
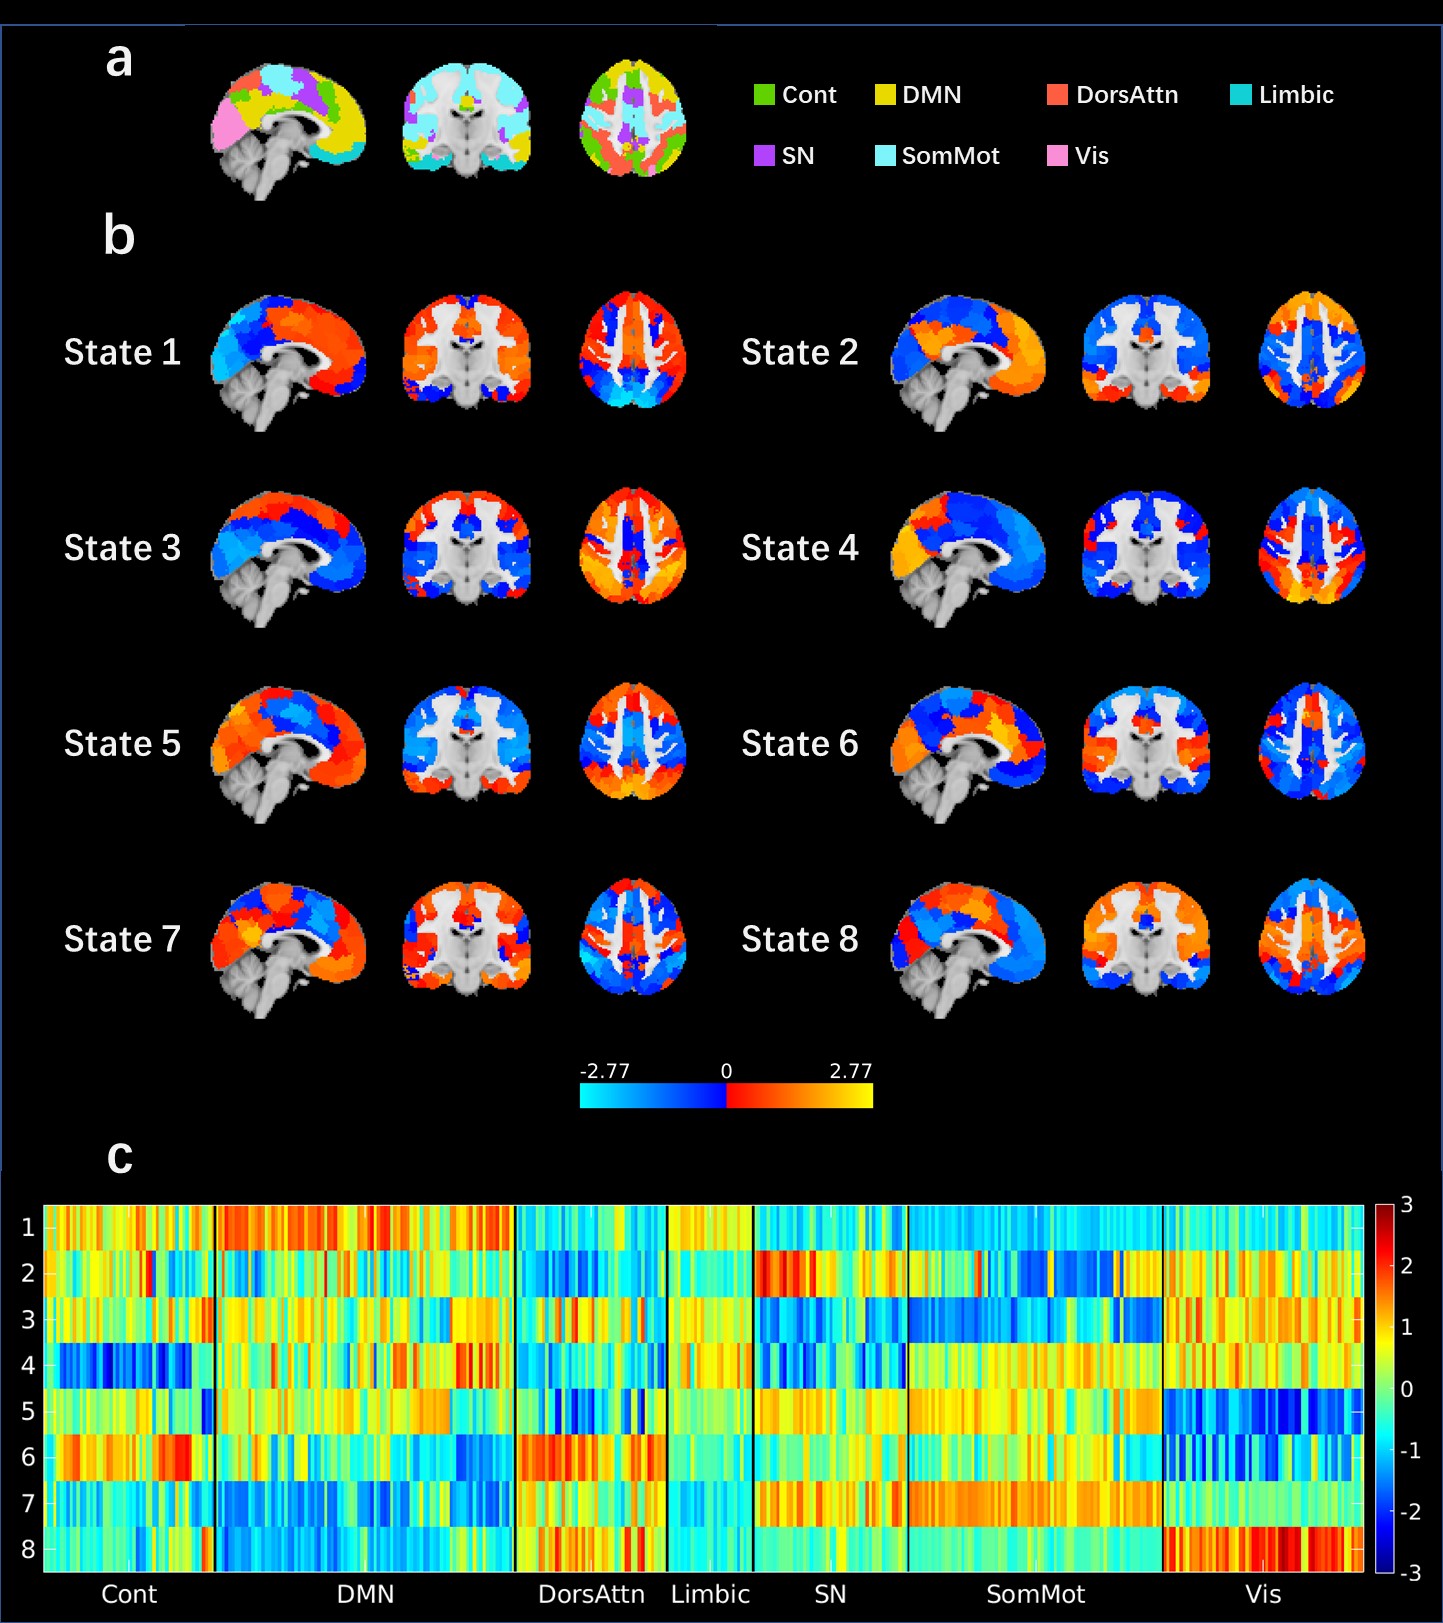
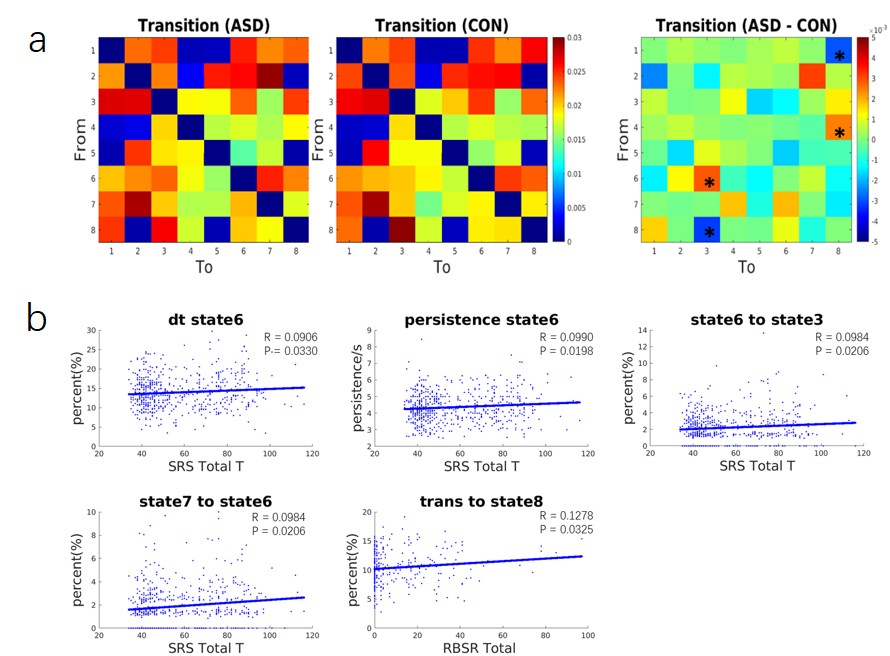
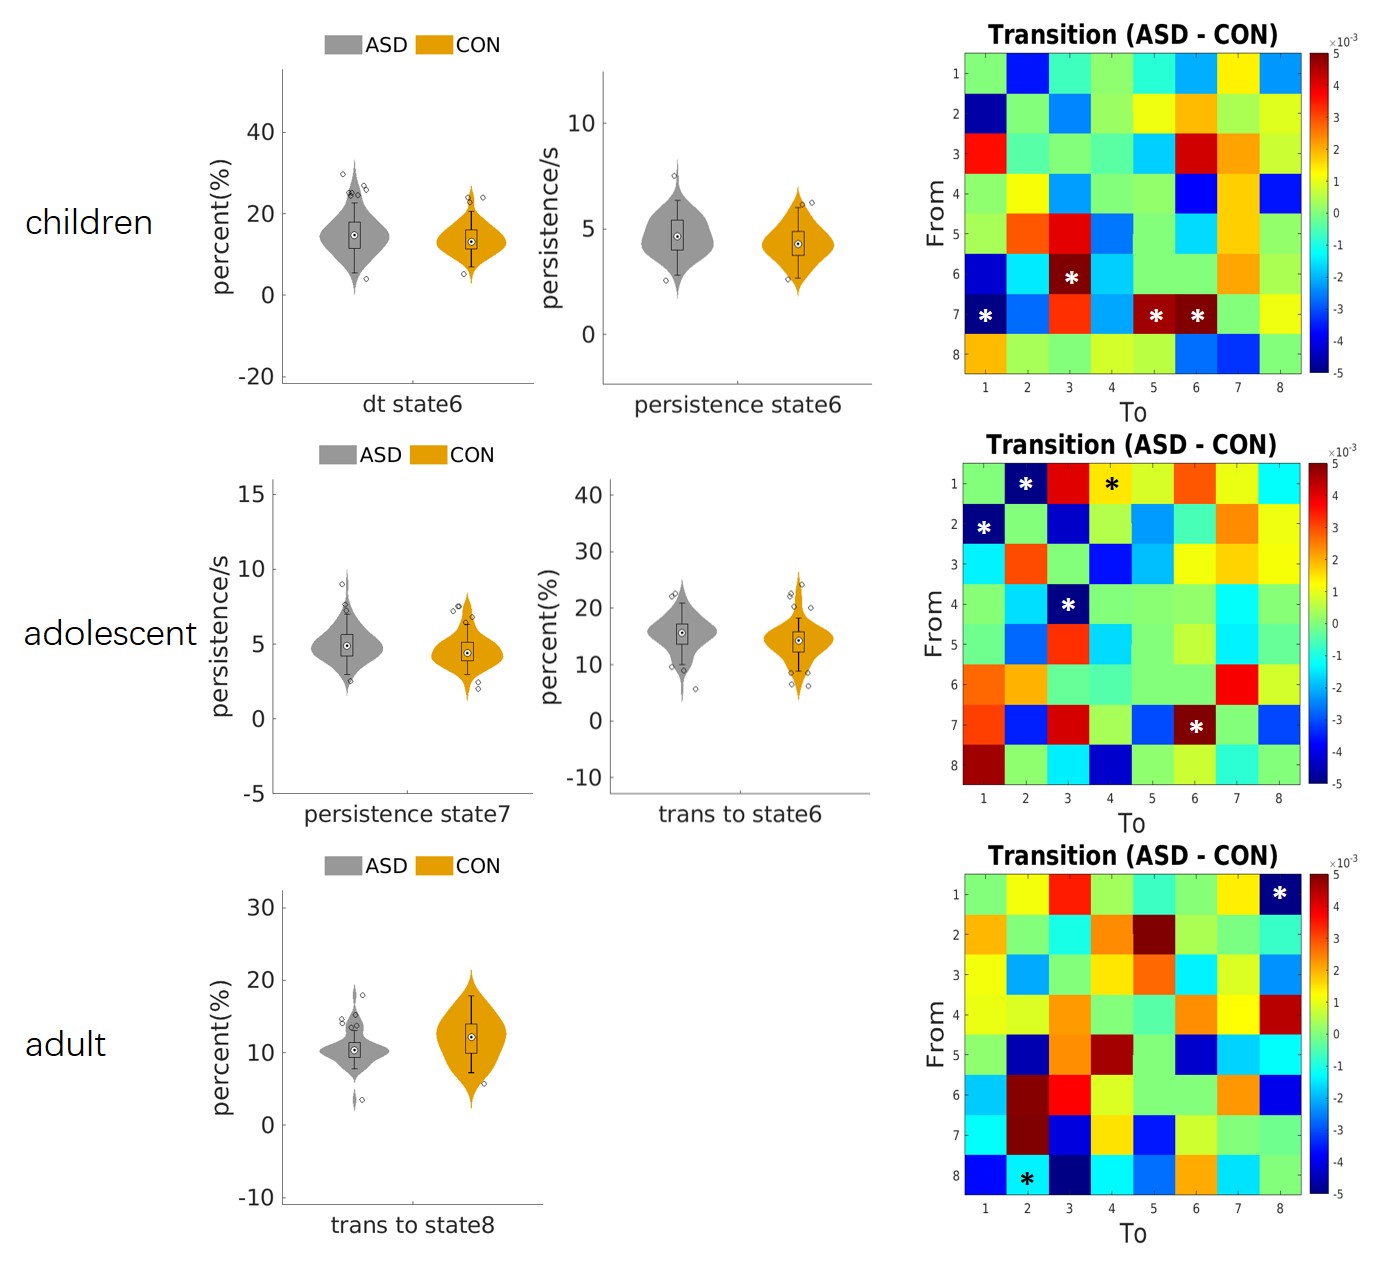
Data: After quality control, total of 756 subjects (314 ASD, 273 male and 41 female, age: 5.22 - 62.00, IQ: 49-149; 451 control (CON), 313 male and 138 female, age: 5.89-64.00, IQ: 73-151) from ABIDE II dataset included 16 sites were used in this study. The subjects were labeled as children (under 12 years old), adolescent (12-20 years old) and adult (over 20 years old), IQ levels were also labeled as medium IQ (80-115) and high IQ (over 115) according to full IQ. High-resolution structural MRI data and functional MRI (fMRI) data for each subject were used. Data processing: FSL was used to preprocess the resting state fMRI data and the procedure included: removing first 5 volumes; non-liner registration to 2mm MNI template; motion correct; spatial smoothing (6mm at FWHM); band-pass temporal filter (0.01-0.1Hz). Detrending was conducted with DPARSF toolbox, involved demean, liner and quadratic trend. Especially, we performed singular value decomposition to remove physiological noise. CAP was conducted with the capcalc (https://github.com/bbfrederick/capcalc) toolbox. The Schaefer 400-node cortical parcellation[8] which parcellated 7-networks of whole brain into 400 subregions (Fig. 1a) was used to extract time courses of each parcel. K-means clustering method was applied for CAP to select stable clusters. When selecting k, we made sure that every subject contained at least one volume of every cluster, finally eight stable clusters were extracted for subsequent analysis. There were four indicators used to represent the dBA difference between ASD and CON: proportion of dwell time (DT), the proportion of each state; persistence, average time a state appeared continuously; proportion of transition into each state and proportion of transition from one state to others. The indicators were standardized into second and proportion because the TRs and volumes were inconsistent across sites. Post-hoc analysis: three-way ANOVA was applied to evaluate the group difference (ASD vs. CON) and the interaction between group and age as well as group and IQ. Participants with IQ under 80 were excluded from the statistical analysis because the lack of matched CON with low IQ. We calculated the correlation between CAP indicators and ASD symptoms (SRS total score for social deficit and RBSR total score for restrictive, repetitive patterns of behavior) to explain the group difference. Moreover, to study the age effect while eliminate others, participants with matched IQ and gender were selected in each age group. For each age group, two sample t-test was applied to study the difference between ASD and CON.Results
The spatial maps of the 8 states were displayed in Figs. 1. ASD participants had larger proportion of transitions from dorsal attention network (DorsAttn) to SN but less from DMN to SN. The larger proportion of transitions from state 6 (dominated by positive SN activation and negative somatomotor network (SomMot) activation) to 3 (dominated by positive Cont and DorsAttn activation) and less from state 8 (dominated by positive SN and SomMot activation) to 3 were both observed in ASD, which means the connection between SN and SomMot may be related to ASD. The transition from state 6 to 3 also had a significant correlation with SRS total T score as displayed in Fig. 2b. For matched group, age had effect on the results. Children and adolescents with ASD had atypical pattern of the separation of DMN and task activate network (Cont and DorsAttn). Children and adults with ASD had atypical dMA related to SN.Discussion and conclusion
In this study, we revealed the atypical dynamic brain activity of ASD with CAP method. The dBA of triple networks and some other netwotks (SomMot) was correlation with ASD core symptoms. The atypical dynamic brain activity of ASD was not consistent in each age group.Acknowledgements
No acknowledgement found.References
1. Abbott, A.E., et al., Patterns of Atypical Functional Connectivity and Behavioral Links in Autism Differ Between Default, Salience, and Executive Networks. Cereb Cortex, 2016. 26(10): p. 4034-45.
2. Bi, X.A., et al., Abnormal Functional Connectivity of Resting State Network Detection Based on Linear ICA Analysis in Autism Spectrum Disorder. Front Physiol, 2018. 9: p. 475.
3. Hogeveen, J., et al., Insula-Retrosplenial Cortex Overconnectivity Increases Internalizing via Reduced Insight in Autism. Biol Psychiatry, 2018. 84(4): p. 287-294.
4. Janes, A.C., et al., Dynamic functioning of transient resting-state coactivation networks in the Human Connectome Project. Hum Brain Mapp, 2020. 41(2): p. 373-387.
5. Liu, X. and J.H. Duyn, Time-varying functional network information extracted from brief instances of spontaneous brain activity. Proc Natl Acad Sci U S A, 2013. 110(11): p. 4392-7.
6. Liu, X., et al., Co-activation patterns in resting-state fMRI signals. Neuroimage, 2018. 180(Pt B): p. 485-494.
7. Di Martino, A., et al., Enhancing studies of the connectome in autism using the autism brain imaging data exchange II. Sci Data, 2017. 4: p. 170010.
8. Schaefer, A., et al., Local-Global Parcellation of the Human Cerebral Cortex from Intrinsic Functional Connectivity MRI. Cereb Cortex, 2018. 28(9): p. 3095-3114.
Figures