3113
Altered segregation of gray matter structural Covariance Networks in prediabetes1Department of Radiology, the Third Xiangya Hospital, Central South University, Changsha, China, 2Philips Healthcare, Guangzhou, China
Synopsis
The structural covariance of connected gray matter has been demonstrated valuable in inferring large-scale structural brain networks. The alterations of grey matter structural covariance networks in prediabetes remains unclear. In this study, the topological features and robustness of gray matter structural covariance networks in prediabetes were examined. Results showed that the prediabetes group retained the small-worldness characteristics. The prediabetes group showed higher clustering coefficient, higher local efficiency and more vulnerable to random failure than healthy controls (HCs) group, suggesting that prediabetes disturbed the segregation of gray matter structural covariance networks, which provided new insights into the pathophysiology of this disease
INTRODUCTION
Prediabetes is the early stage of diabetes development and has been a major global health issue that affected approximately 400 million Chinese in 2013[1]. Some evidence has proved that prediabetes is associated with increasing risk neurocognitive deficits [2.3] and neurological degenerative diseases [4]. Recently, the structural covariance of connected gray matter has been demonstrated valuable in inferring large-scale structural brain networks and has attracted increased attention from researchers. A key foundation of this methodology is that the interconnected brain regions share common development and maturation effects, so they would covary in morphological characteristics [5]. To date, the alterations of grey matter structural covariance networks in prediabetes remains unclear. More importantly, given that prediabetes has recently been shown to be associated with abnormalities in morphology features, structural covariance network analysis based on gray matter morphology may provide new insights into the pathophysiology of this disease. The aim of this study was to examine the topological features and robustness of gray matter structural covariance networks in pre-diabetic patients using theoretical analysis. This would provide new information about the potential pathogenesis of prediabetes-related brain diseases and would be beneficial to the early prevention and treatment of related brain diseasesMETHODS
Participants: 48 subjects including in this study, according to the diagnostic criteria published by American Diabetes Association 2014 [6], volunteers were divided into prediabetes group and HCs groups. This study was approved by the Medical Ethics Committee of the Third Xiangya Hospital of Central South University. After a detailed description of the study, all participants gave written informed consent. MRIData acquisition and preprocessing: Structural images were acquired with a three-dimensional T1WI sequence in a Philips 3.0 T scanner (Ingenia, Philips Healthcare, Best, Netherlands): repetition time (TR)/echo time (TE) =7.8/2.3 ms; slices = 226; thickness = 1 mm; gap = 0 mm; flip angle (FA) = 7°; acquisition matrix = 240× 240; times=376 s. All structural data were performed VBM analysis using Computational Anatomy Toolbox (CAT12) (http://dbm.neuro.uni-jena.de/cat12/) with Statistical Parametric Mapping software (SPM12) (Wellcome Department of Cognitive Neurology, London, UK; http://www.fil.ion.ucl.ac.uk/spm) based on Matlab 2014a (MathWorks, Natick, MA). All graph analysis in this study was performed using the GAT toolbox(http://ncnl.stanford.edu/tools.html) [7]and the analysis process is the same as the previous article [8].
Statistical analysis: Comparison of demographic data between prediabetes and HCs groups was performed using independent two-sample t-tests and χ2 tests on SPSS 24 software (SPSS, Chicago, IL, USA). All tests were two-tailed, and p < 0.05 was considered statistically significant. A non-parametric permutation test with 1,000 repetitions was used to test the statistical significance of the between-group differences
RESULTS
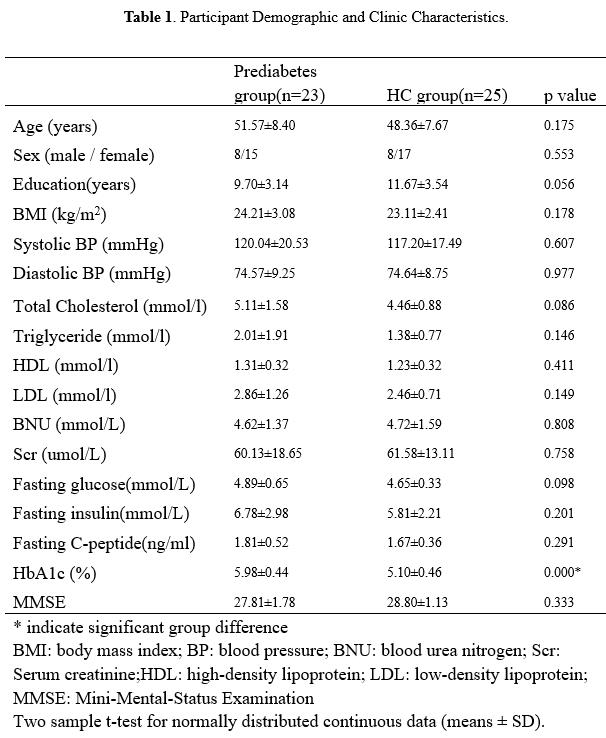
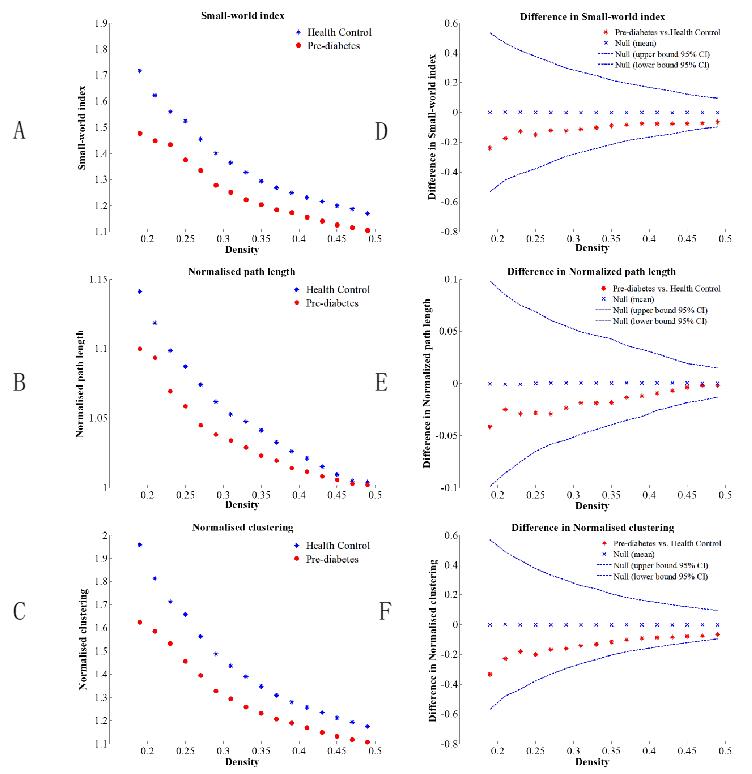
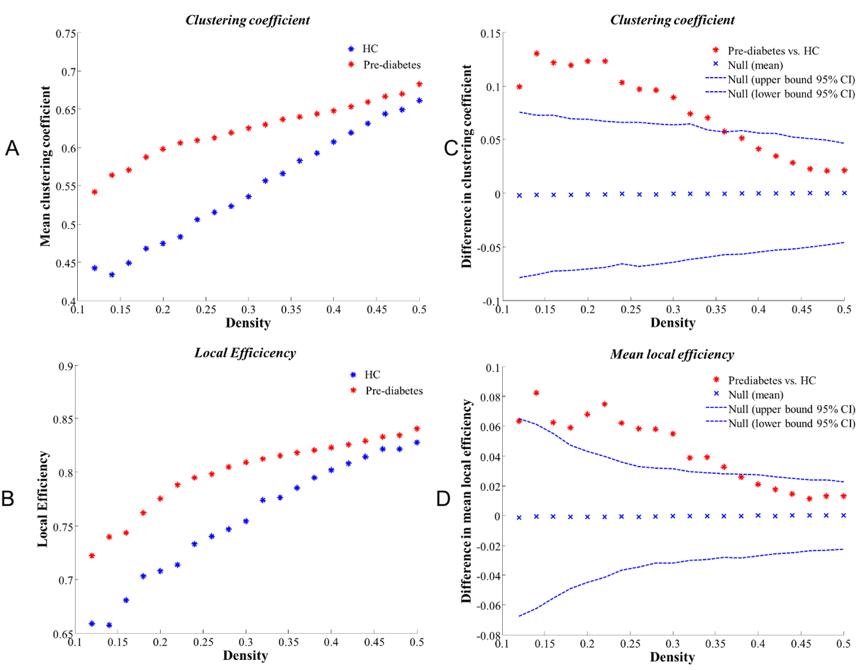
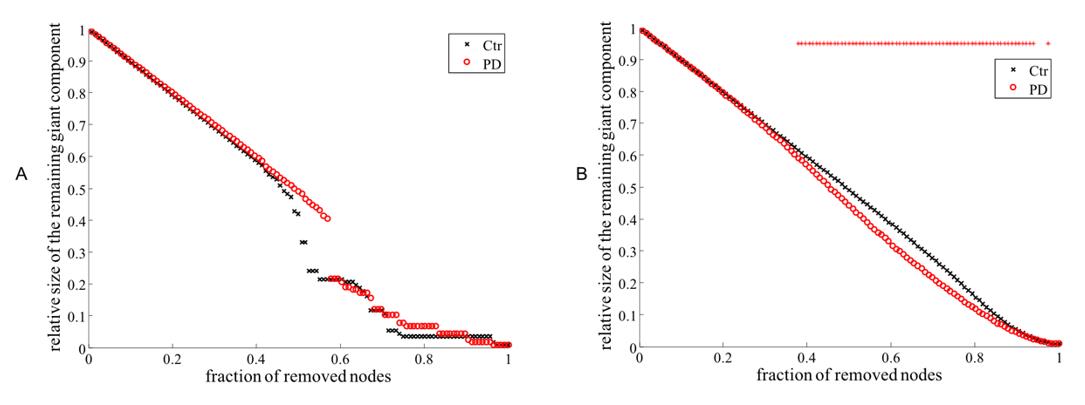
Table 1 showed the detailed demographic and neuropsychological characteristics of the prediabetic patients and healthy controls. The prediabetes had higher HbA1c than the health controls (all p < 0.05). No significant intergroup differences were found in terms of age, sex, education, body mass index (BMI), blood pressure (BP) and Lipid parameters (all p> 0.05). Global network measures comparisons We found that the normalized clustering coefficient was much greater than one(γ>1, Figure 1A), normalized characteristic path length was close to one (λ≈1, Figure 1B) and small-world index was greater than one (σ>1, Figure 1C) across the density range of 0.12–0.50 in two groups. It indicated that the structural network of both groups exhibited typical features of small-world properties. AUC analysis showed no significant difference between groups, indicating that the prediabetes gray matter network retained the small world characteristics (Figure 1D-F). Compared to HCs, prediabetes network exhibited significantly increased Eloca and clustering coefficient across a series of network sparsities (Figure 2A-B). AUC analysis confirmed that Eloca and clustering coefficient were significantly increased (P < 0.00001, p=0.004, respectively) in the PD network as compared to HC across densities ranging from 0.12 to 0.50 (Figure 2C-D). These suggested that the network segregation of structure network had been altered in prediabetes. In network robustness, the prediabetes network was less robust than health control network during random failure, and the difference was significant (p < 0.05) at several fractions of attacked nodes (Figure 3).DISCUSSION & CONCLUSION
To our knowledge, this was the first report of altered organization of gray matter structural covariance networks and the vulnerability of robustness of brain network models in prediabetes. In the current study, we found that the gray matter structure network of pre-diabetes patients and health controls group have the characteristics of small-world networks. However, prediabetes structure network showed increased mean local efficiency and clustering coefficient than healthy controls, which indicating that the abnormal topological properties of the structural network could be observed before the onset of diabetes. The clustering coefficient and local efficiency were the main measure of local network connectivity and quantifies the extent that neighboring brain regions were also connected. A network with a high cluster coefficient contains densely connected local clusters and the local efficiency reflects the average efficiency of local clusters [9]. Therefore, our results showed that the local network connectivity and the average efficiency of local clusters of gray matter covariance networks were disrupted in prediabetes.Acknowledgements
No acknowledgement found.References
[1] Wang L, Gao P, Zhang M, Huang Z, Zhang D, Deng Q, Li Y, Zhao Z, Qin X, Jin D, Zhou M, Tang X, Hu Y, Wang L. Prevalence and Ethnic Pattern of Diabetes and Prediabetes in China in 2013. JAMA. 2017;317(24):2515-2523.
[2] Dybjer E, Nilsson PM, Engström G, Helmer C, Nägga K. Pre-diabetes and diabetes are independently associated with adverse cognitive test results: a cross-sectional, population-based study. BMC Endocrine Disorders. 2018;18(1):91.
[3] Marseglia A, Fratiglioni L, Kalpouzos G, Wang R, Bäckman L, Xu W. Prediabetes and diabetes accelerate cognitive decline and predict microvascular lesions: A population-based cohort study. Alzheimers. 2019;15(1):25-33.
[4] Buysschaert M, Medina JL, Bergman M, Shah A, Lonier J. Prediabetes and associated disorders. Endocrine. 2015;48(2):371-393.
[5] Alexander-Bloch A, Raznahan A, Bullmore E, Giedd J. The convergence of maturational change and structural covariance in human cortical networks. Journal of Neuroscience. 2013;33(7):2889-2899.
[6] American Diabetes Association. Diagnosis and classification of diabetes mellitus. Diabetes Care. 2013;36(Suppl 1): S67-74.
[7] Hosseini SM, Hoeft F, Kesler SR. GAT: a graph-theoretical analysis toolbox for analyzing between-group differences in large-scale structural and functional brain networks. PLoS One. 2012;7(7): e40709.
[8] Guo T, Guan X, Zeng Q, Xuan M, Gu Q, Huang P, Xu X, Zhang M. Alterations of Brain Structural Network in Parkinson's Disease With and Without Rapid Eye Movement Sleep Behavior Disorder. Front Neurol. 2018;9:334.clini
[9] Sporns O. Structure and function of complex brain networks. Dialogues in Clinical Neuroscience. 2013;15(3):247–262
Figures