3112
Lower-limb fat: how it is distributed spatially and its potential in approximating whole-body fat content1Vascular and Physiologic Imaging Research (VPIR) Lab, School of Biomedical Engineering, ShanghaiTech University, Shanghai, China, 2School of Biomedical Engineering, ShanghaiTech University, Shanghai, China, 3School of Biomedical Engineering, Shanghai Jiao Tong University, Shanghai, China
Synopsis
Fat content in lower limb is of highly clinical interest as it reflects physical activity. In this study, we quantified lower-limb fat content in a comprehensive way using a Dixon method. We found that fat content in lower limb generally decreased from pelvis to ankle. Of particular note, fat content in thigh was significantly higher than that in calf, and can potentially differentiate subjects with different body-mass index (BMI). It is also encouraging that fat content for a single cross-section at mid-thigh (30 sec scan time) approximated whole-limb fat content well, as it makes whole-body quantification in clinical setting feasible.
Introduction
Whole-body fat content is an important index for various diseases such as Sarcopenia or obesity 1,2. Magnetic resonance imaging (MRI) is an excellent imaging tool for soft tissues like fat and muscle, but its capability in imaging whole-body fat vs muscle contents is limited in clinical setting by size of radio-frequency coil and scanning time 3. Multiple studies in literature suggested that lower-limb fat content correlates well with the whole-body level 4,5. In this study with a robust Dixon method, we measured fat content for the entire lower limb for multiple subjects, studied the distribution of fat along the axial direction (thigh vs calf) and within the transverse plane (subcutaneous vs intramuscular), and determined the optimal cross-section that could approximate the entire lower-limb’s fat content.Methods
The study was approved by the institutional review board. Four healthy volunteers (age: 25.0±1.1 years, height: 175.0±3.6 cm, weight: 72.3±9.0 kg) participated in this study after signing written consent form. The MRI exam was performed on a 3T MRI scanner (uMR890, United Imaging Healthcare), using a 36-channel coil for lower limbs. A two-point Dixon method was implemented with the following parameter values: field of view (FOV) 210x210 mm2 for thigh and 180x180 mm2 for calf, repetition time (TR) 3917ms, echo time (TE) 71ms, and slice thickness 3 mm. Acquisition for each slice lasted for 30 seconds. The acquisition resulted in one fat-only map and one water-only map. Overall 10 axial acquisitions were performed, 5 slices evenly distributed from the anal transverse plane to the upper edge of the patella and the other 5 from the lower edge of the patella to the ankle joint (Fig. 1).The acquired data were transferred to a personal computer and were then processed in MATLAB environment. Specifically, in the fat-only map we first separated the subcutaneous fat and the muscle region by applying a thresholding method. To further quantify intramuscular fat content in the segmented muscle region, we used a double-threshold method, i.e. the medium muscle intensity as the lower limit and the medium intensity of subcutaneous fat as the upper limit, to re-window the original fat-only map, thus enhancing and facilitating the segmentation of intermuscular fat. From the segmented mask of subcutaneous fat and of intramuscular fat, we computed the areas of these fat regions for each slice, and summed up the two values to obtain the overall fat content for each cross-sectional slice. Intramuscular fat content was also quantified by its ratio over the area of the entire muscle region.
Results
Segmentation of subcutaneous and intramuscular fat was successfully performed for each subject, with representative results shown in Fig.1. The fat content values measured for each cross section are shown in Fig.2. First, on average, fat contents in thigh (10%-20%) were substantially higher than those in calf (5%-10%). Second, along the direction from pelvis to ankle, all fat contents decreased, except for intramuscular fat in calf. The fat contents were relatively high as it approached the knee on the thigh side. It is also noted that the variance of the fat contents was large among the subjects even though all of them were healthy. Fig. 3 confirmed that fat content in thigh was significantly higher than that in calf (P<0.001), and showed that among all the sections, the 4th section’s fat content is the closest to that of the whole lower limb. In addition, good correlation was found between the subjects’ BMI and the measured fat content, particularly for the thigh (Fig. 4).Discussion
With a wide-FOV imaging protocol, we managed to measured fat content for multiple cross sections along lower limbs. Our results showed that fat content in the thigh was significantly higher than that in the calf, and had a high variance even across different healthy subjects. A closer look at the fat contents of individual slices indicated that the 4th section (close to mid-thigh) approximated the whole leg the most, suggesting its high potential in approximating whole-body fat content. This was partially supported by the good correlation between the subjects’ BMI and the thigh’s fat content. Fat content as measured in the calf is not recommended to approximate whole-leg or whole-body’s value, as suggested by the results. This is presumably due to the fact that calf is intensively used in most people’s daily walking and thus its fat content is of low value for differentiation purpose.In conclusion, fat content in a lower-to-middle thigh slice can be used to approximate the fat content in the whole lower limb and thus whole-body. Such a quick acquisition takes about 30 seconds only, making it feasible for routine clinical measurement.
Acknowledgements
No acknowledgement found.References
1. Thomas L, Fitzpatrick A, Malik J, et al. Whole body fat: content and distribution. Prog Nucl Magn Reson Spectrosc. 2013;73:56-80.
2. Song M, Ruts E, Kim J, et al. Sarcopenia and increased adipose tissue infiltration of muscle in elderly African American women. Am J Clin Nutr. 2004;79(5):874-880.
3. West J, Romu T, Thorell S, et al. Precision of MRI-based body composition measurements of postmenopausal women. PloS One. 2018;13(2):e0192495.
4. Codari M, Zanardo M, Sabato M, et al. MRI‐Derived Biomarkers Related to Sarcopenia: A Systematic Review. J Magn Reson Imaging. 2020;51(4):1117-1127.
5. Morrell G, Ikizler T, Chen X, et al. Psoas muscle cross-sectional area as a measure of whole-body lean muscle mass in maintenance hemodialysis patients. J Ren Nutr. 2016;26(4):258-264.
Figures
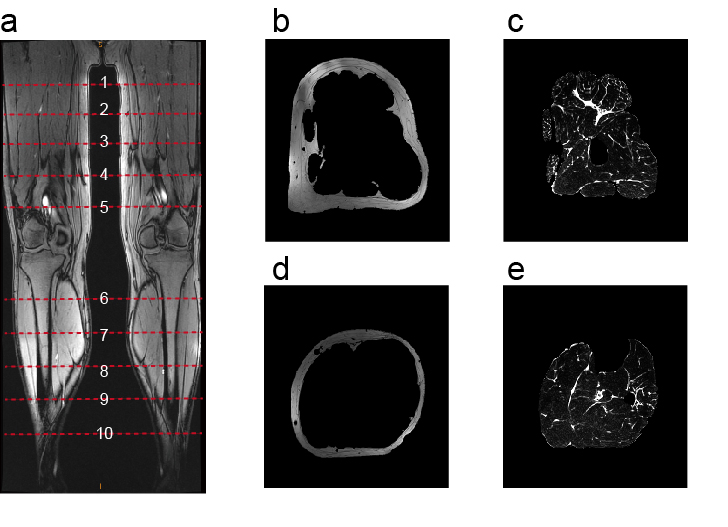
Figure 1. Representative example of MRI of lower limbs. a) A coronal image that shows the location of the 10 cross-sections. b) The segmented subcutaneous fat in a thigh slice. c) The muscle with enhanced intermuscular fat in the same thigh slice as b). d) The segmented subcutaneous fat in a calf slice. e) The muscle with enhanced intermuscular fat in the same calf slice as d).
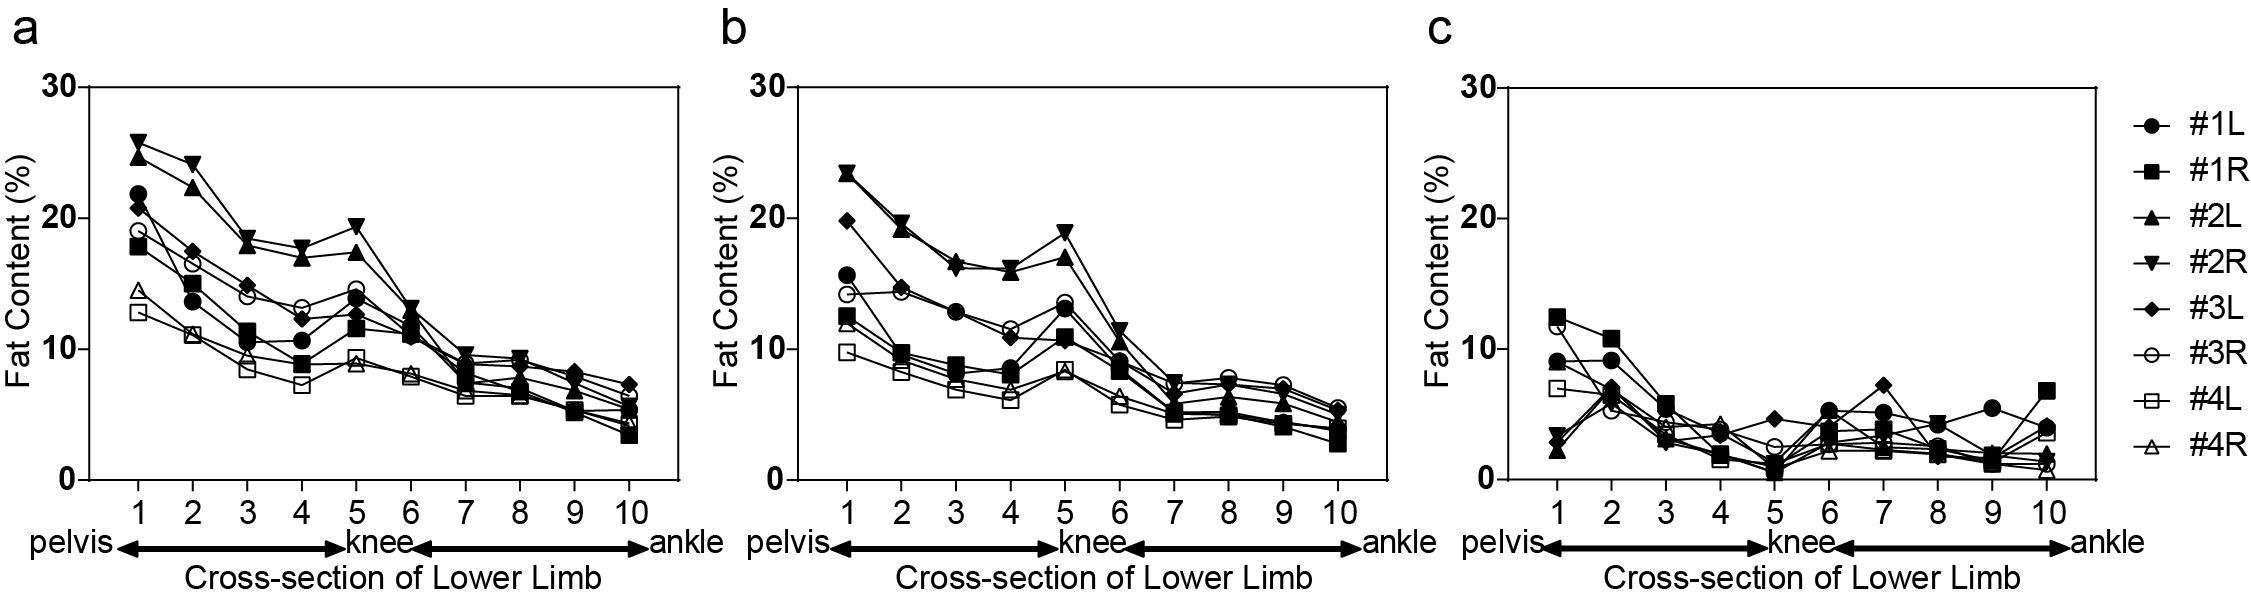
Figure 2. Fat content along axial direction of lower limb. Slice 1 to 5 are on the thigh, and 6-10 on the calf. a) Overall fat content (% over the entire leg cross-section area); b) Subcutaneous fat content (% over the entire leg cross-section area); c) Intramuscular fat content (% over the muscle region, excluding subcutaneous-fat region). As shown on the right side, we included 4 subjects, each with two legs.
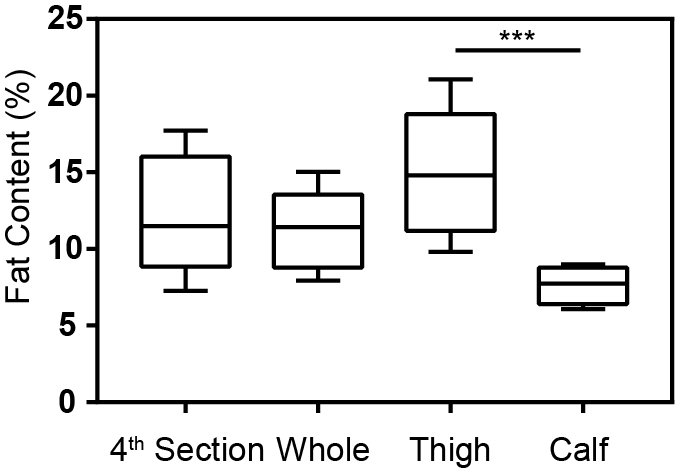
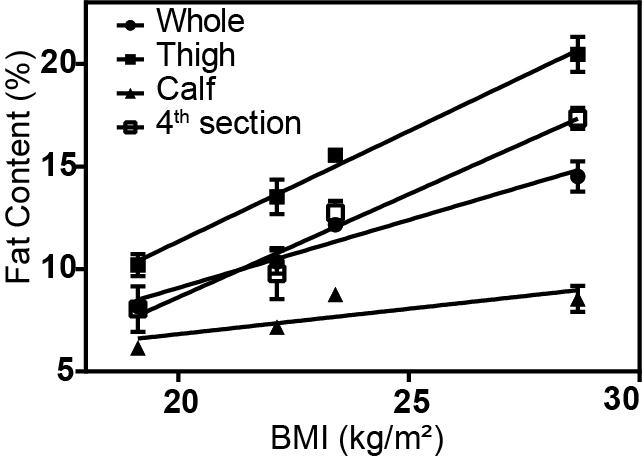
Figure 4. The measured fat content, particularly in thigh, was highly indicative of the subjects’ body mass index (BMI).