3110
Development and validation of an MRI-based radiomics nomogram for distinguishing multiple myeloma from bone metastasis of breast cancer1Diagnostic Radiology, Hiroshima City Hiroshima Citizens Hospital, Hiroshima, Japan, 2Diagnostic Radiology, Hiroshima University Hospital, Hiroshima, Japan
Synopsis
We established and validated the feasibility of an MRI-based radiomics nomogram to differentiate between multiple myeloma (MM) and bone metastasis of breast cancer (BC). Regions of interest were drawn for the largest bone lesion per patient on T1- and T2-weighted images of patients with MM (n = 85) and BC (n = 70) from two institutions. The machine learning model with logistic regression resulted in the best performance for differentiating MM from BC with both sequences in the test cases. Our proposed clinical radiomics analysis shows promise in differentiating MM from bone metastasis of BC.
Introduction
Multiple lytic bone lesions during diagnostic imaging workup, suggesting either metastatic lesions or primary bone tumors, clinically constitute a diagnostic dilemma in patients without a relevant clinical history. Multiple myeloma (MM) is the most common type of primary bone tumor, annually affecting approximately 50,000 patients in the United States. Breast cancer (BC) is known to show late recurrence (more than 10 years after initial treatment), and to favor bone as a metastatic site.1Radiomics is an advanced radiological imaging analysis that utilizes quantitative features extracted from MRI together with machine learning for the diagnosis and prediction of bone lesions.2,3 However, to our knowledge, no previous study concerning the differentiation MM from BC using MRI-based radiomics nomogram has been reported.
The purpose of this study was to establish and validate an MRI-based radiomics nomogram using T1-weighted and T2-weighted images for differentiation between MM and bone metastasis of BC.
Methods
We retrospectively analyzed MRIs of 155 patients with MM (n = 85) and bone metastasis of BC (n = 70) treated from 2001 to 2021 at two institutions.MRI included 2D T1-weighted spin-echo and T2-weighted spin-echo sequences using either a 3-T system (n = 65) or a 1.5-T system (n = 90). Regions of interest (ROIs) were drawn for the largest bone lesion per patient using a semiautomatic segmentation method by a radiologist with 28 years' experience in musculoskeletal imaging.
A total of 851 texture features, including first-order features, morphological features, second-level GLCM (Gray-Level Co-occurrence Matrix) and GLDM(Gray-Level dependent Matrix)texture features were extracted automatically from the T1-weighted and T2-weighted images using radiomics plugin (http//:www.slicer.org). The mean decrease in Gini was used to reduce overfitting in the model and highly correlated features were removed using the Pearson correlation coefficient. Finally, the 10 most important features for establishing the radiomics model were determined.
For data classification and model building, a graphical user-interface-based software (Orange Data Mining) was used. We compared the effectiveness of five machine learning approaches: a logistic regression (LR) classification algorithm, a random forest classifier, a support vector machine, a multi-layer perceptron algorithm and a Naive Bayes (NB) algorithm.
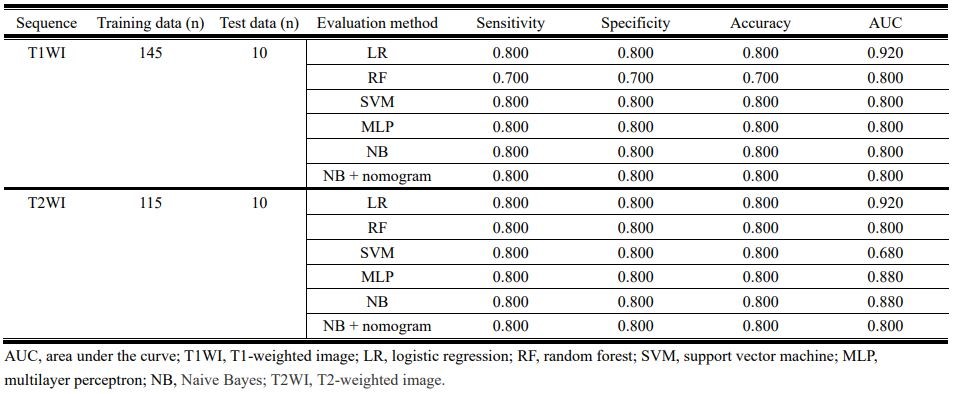
We trained the models using 145 data for T1-weighted images and 115 data for T2-weighted images. The validation fraction was 10% of the training data. Next, we tested the model on data from the five most-recent independent patients from each type of pathology. A nomogram was drawn for the test data sets.
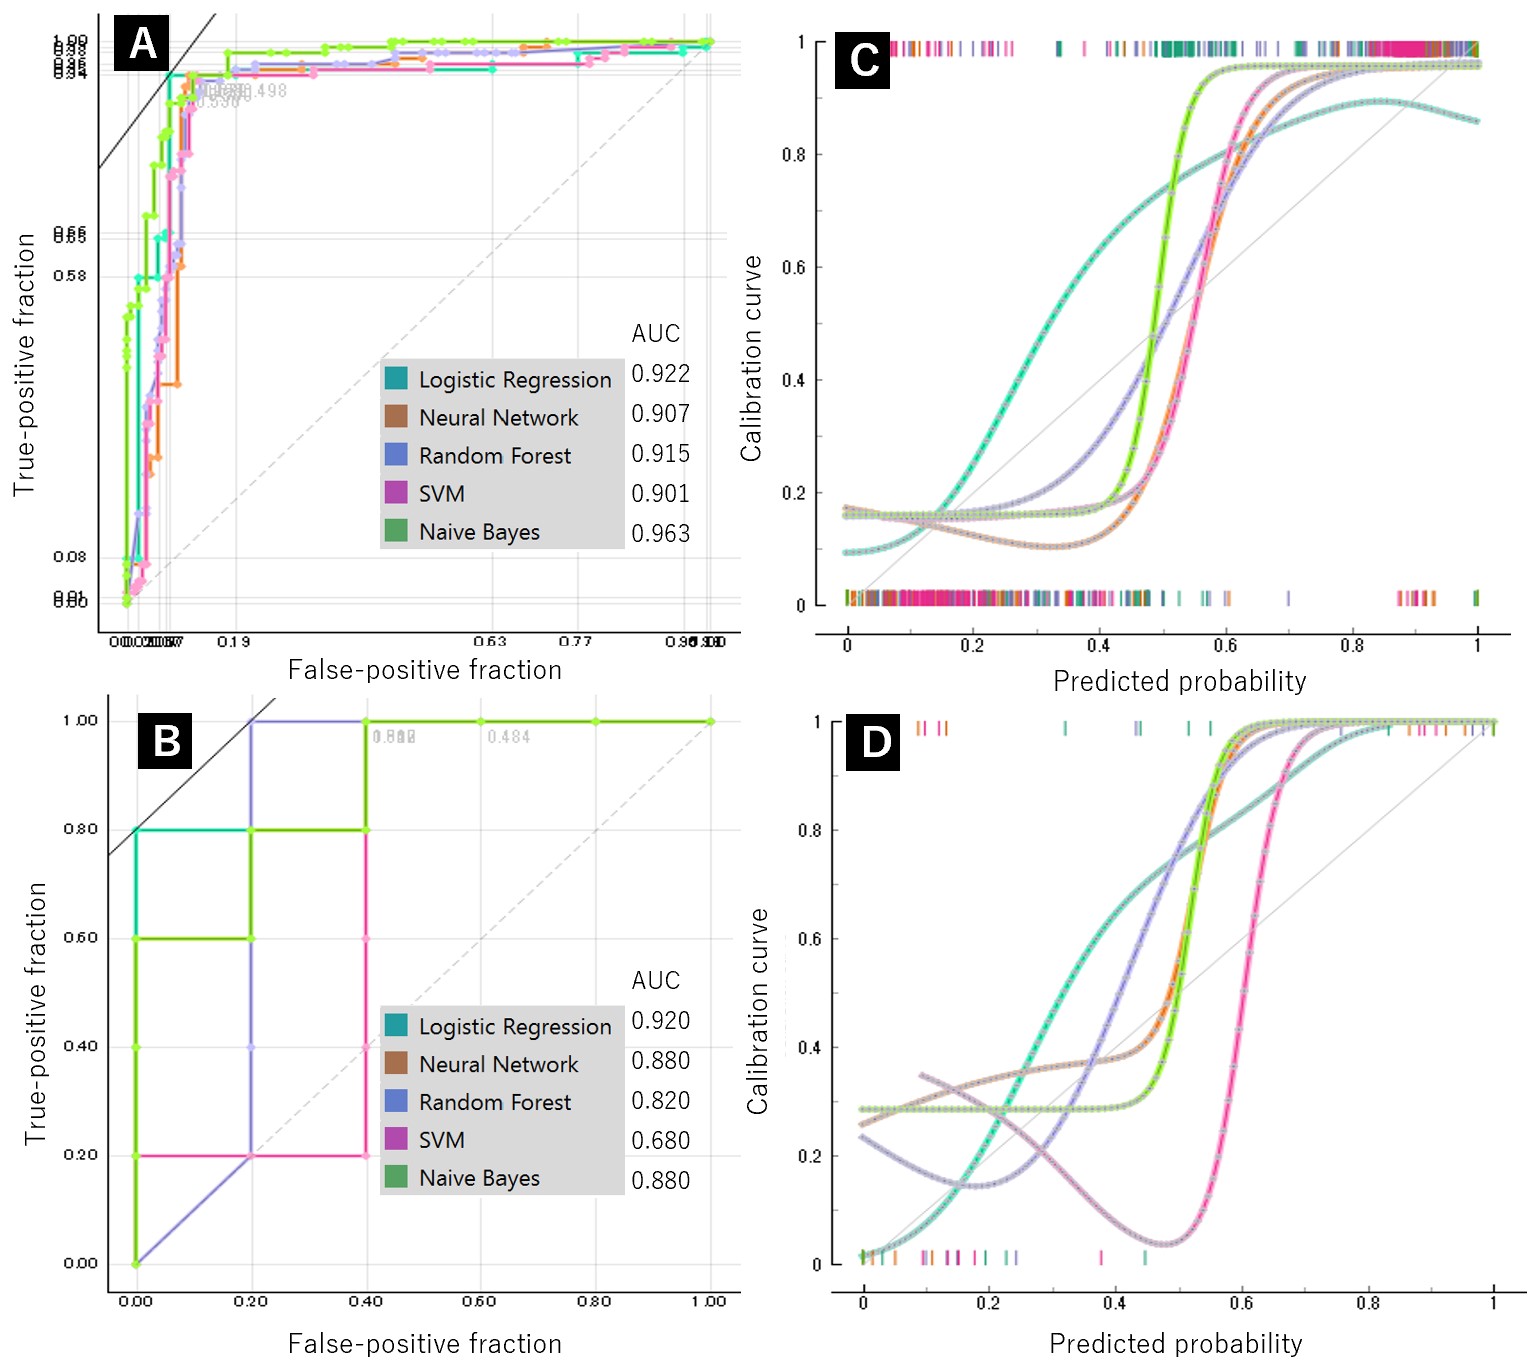
Receiver operating characteristics (ROC) curves were used to evaluate the diagnostic efficacy of the radiomics model and a calibration curve was drawn to evaluate the diagnostic efficacy of the models. Measures of accuracy, sensitivity, specificity and areas under the curve (AUC) were estimated.
Results
For the T1-weighted images, the highest AUC value for differentiation between MM and BC in the training set was 0.925 by NB, and its accuracy, specificity and sensitivity were 0.892, 0.83 and 0. 892, respectively (Fig. 1). For the T2-weighted images, the highest AUC value for differentiation between MM and BC in the training set was 0.963 by NB, with accuracy, specificity and sensitivity of 0.908, 0.908 and 0.916, respectively (Fig. 2).The highest value of AUC in the test set was 0.920 by LR, with accuracy, specificity and sensitivity of 0.800, 0.800 and 0.800, respectively for T1- and T2-weighte images (Fig. 3). AUC values obtained by NB-based nomogram were almost similar to those obtained by other algorithms except for LR and NB-based nomogram did not improve diagnostic accuracy for differentiation between these entities.
Figure 4 shows the diagnostic performance of the radiomic features derived using T1- and T2-weighted images to distinguish between MM and BC. The radiomic features for T1-weighted images had a slightly better predictive value than for T2-weighted images, with the highest AUC value of 0.942 for wavelet- HHHfirstorderVariance.
Discussion
This preliminary analysis showed that our radiomics analysis could non-invasively distinguish between bone lesions due to MM and metastatic BC.The results from the test cohort and the predictive performance with the dataset were comparable between T1-weighted and T2-weighted images, which is contrary to expectations because signal intensity within bone lesions is typically more homogenous on T1-weighted images than on T2-weighted images. This could probably be because subtle changes in signal intensity or texture within the lesion can be observed by the radiomics method but not by visual interpretation by a human reader.
The study protocol using independent test cohorts in this study demonstrated that our machine learning model has the potential for generalization to test data set, although more training datasets are necessary to achieve stable performance.
Conclusion
Our radiomics-based machine learning model allowed differentiation of bone lesions due to MM and BC. Routine incorporation of automated feature extraction algorithms into basic sequences in clinical radiology practice might have potential in the non-invasive diagnosis of MM and BC when the patients’ clinical history is unavailable. Our NB-based nomogram did not improve diagnostic accuracy for differentiation between these entities.Validation of this initial study with larger patient cohorts and in combination with sequences such as diffusion-weighted imaging might offer additional radiomic features and improve the performance of the model.
Acknowledgements
No acknowledgement found.References
1. Nishimura R, Osako T, Nishiyama Y, et al. Evaluation of factors related to late recurrence -later than 10 years after the initial treatment- in primary breast cancer. Oncology. 2013;9:100–110.
2. Yin P, Mao N, Wang S et al. Clinical-radiomics nomograms for pre-operative differentiation of sacral chordoma and sacral giant cell tumor based on 3D computed tomography and multiparametric magnetic resonance imaging. Br J Radiol. 2019; 92:20190155.
3. Lang N, Zhang Y, Zhang E, et al. Differentiation of spinal metastases originated from lung and other cancers using radiomics and deep learning based on DCE-MRI. Magn Reson Imaging. 2019;64:4-12.
Figures