3108
Exercise-induced muscle hyperemia as quantified by a BOLD modelling approach1Vascular and Physiologic Imaging Research (VPIR) Lab, School of Biomedical Engineering, ShanghaiTech University, Shanghai, China, 2School of Life Science and Technology, ShanghaiTech University, Shanghai, China, 3Department of Radiology and Imaging Sciences, University of Utah, Salt Lake City, UT, United States
Synopsis
Muscle hyperemia after exercise is a physiologic phenomenon that could reflect muscle function and performance. For a group of human subjects, we performed dynamic BOLD scan of calf muscles immediately after in-scanner plantar flexion. To analyze the dynamic data, a kinetic model of deoxy-hemoglobin (dHb) was proposed, with exponentially decayed perfusion as determinant. A hyperemia index (HI) was defined based on the estimated perfusion parameters, and was compared to muscle perfusion measured by DCE scans. In conclusion, we proposed a quantitative model for analyzing post-exercise muscle BOLD data, and the new parameter “hyperemia index”.
Introduction
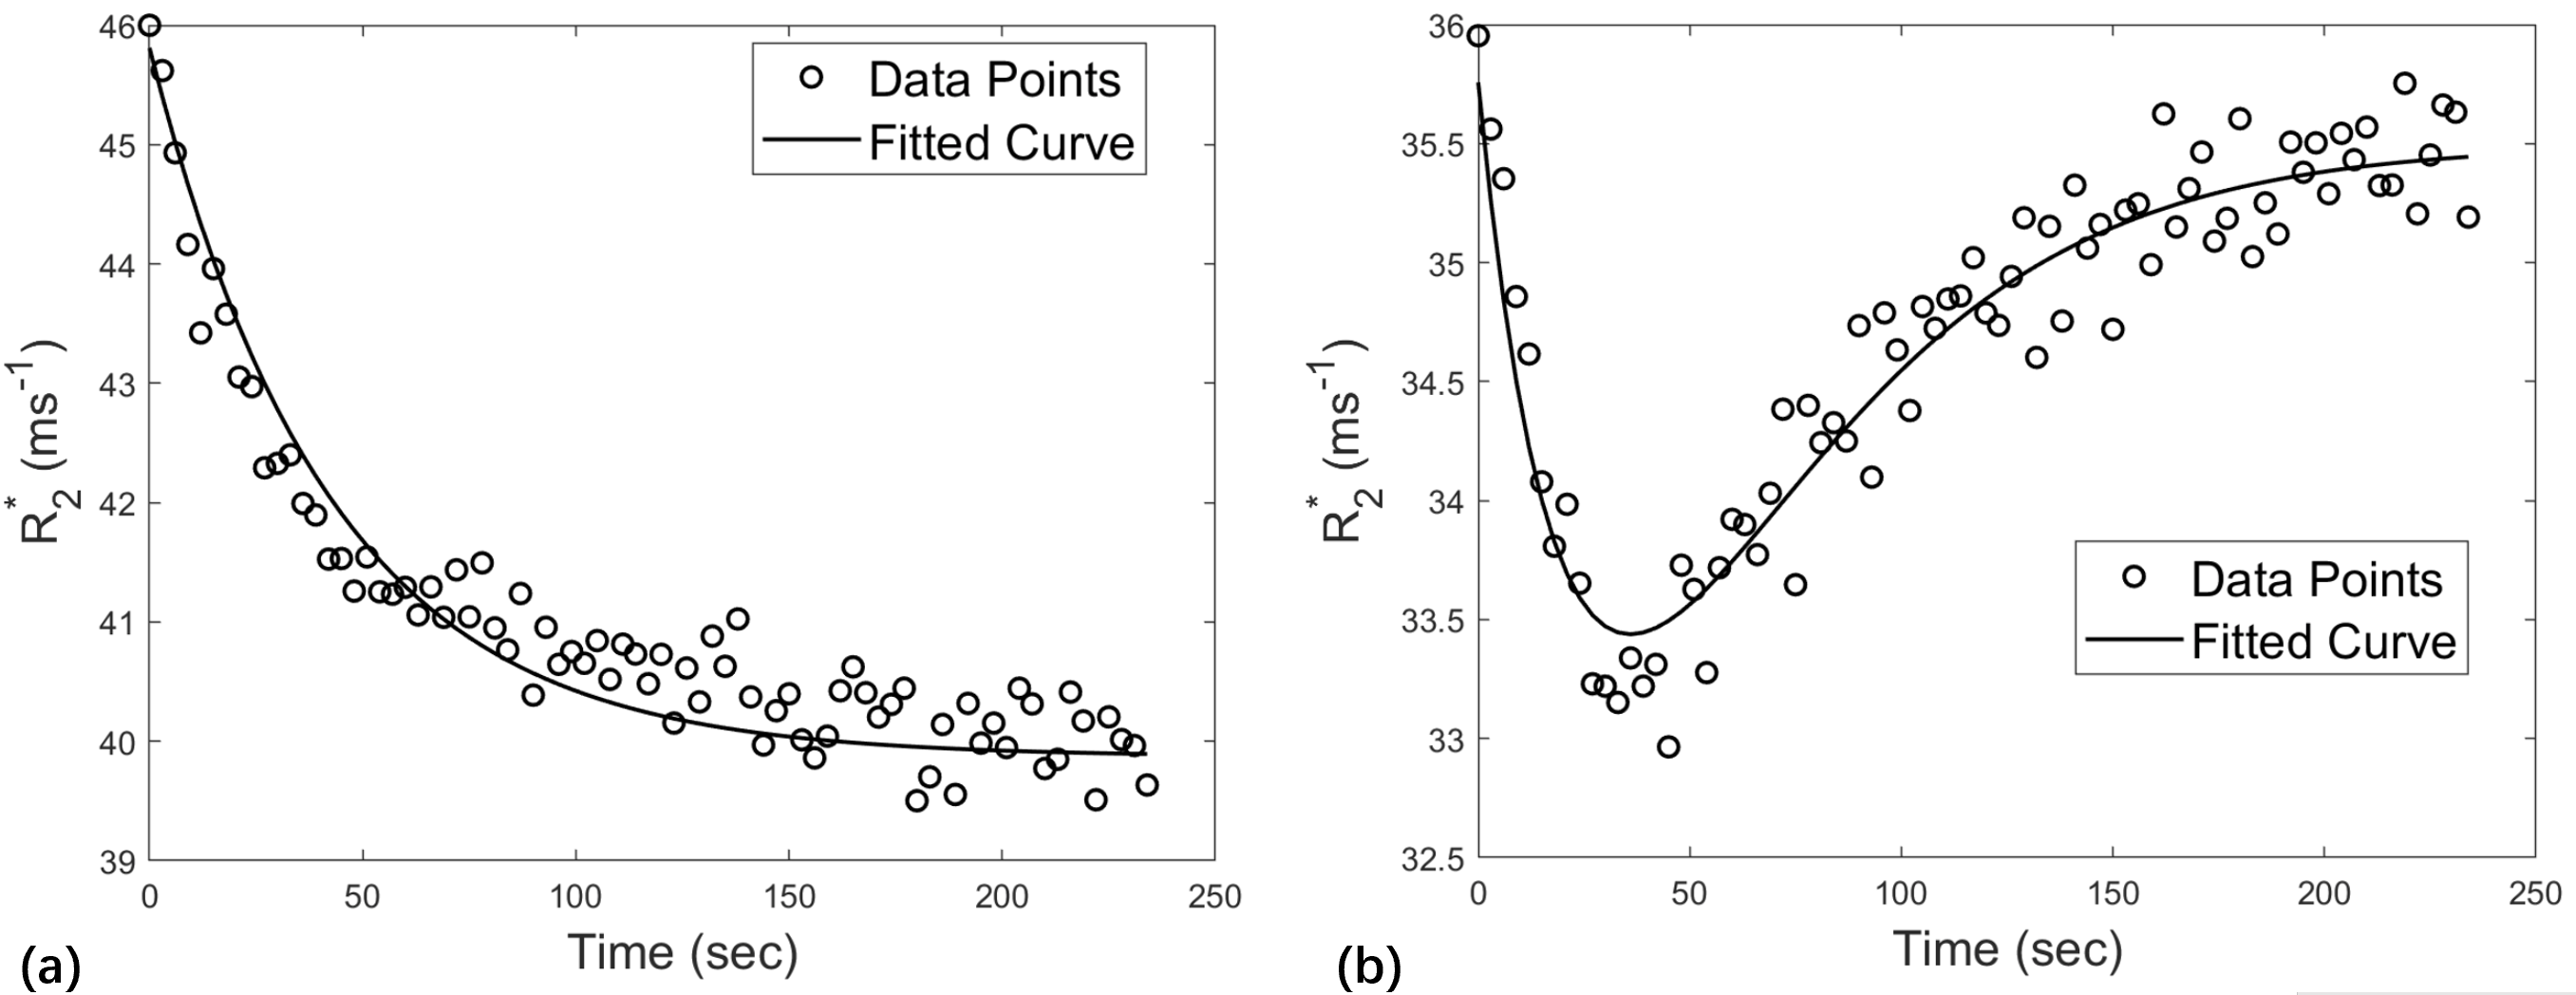
Exercise stimulation for skeletal muscle may induce significant changes in multiple physiologic parameters, including oxygen consumption and muscle perfusion. Notably, muscle hyperemia almost always occurs, presumably to bring more oxygenated blood and flush away the large amount of deoxyhemoglobin (dHb). In this study, we performed dynamic BOLD scans for calf muscles immediately after plantar flexion, with the aim of exploring muscle hemodynamics during exercise recovery. In preliminary analysis of the data, we observed that R2* of the activated muscles may show two different temporal patterns: either decrease to a low level then increase to resting level, or monotonic decrease (i.e., with or without overshoot in Fig. 1). This observation prompted us to model the post-exercise BOLD data in a quantitative way. Based on muscle physiology, the proposed model considered time-varying muscle perfusion as a major determinant.Method
MRI acquisition and processing: Ten healthy subjects were recruited for this study. With written informed consent, each subject was scanned twice on separate days. Each exam included BOLD and then DCE, both stimulated by a same plantar-flexion protocol. More details of the protocol are in a previous paper1. For BOLD, gradient echo signals for an axial calf slice were acquired every 3 seconds for 4 minutes. For each data, we obtained R2* maps with matrix size of 256×256×80. ROI for medial gastrocnemius (MG), lateral gastrocnemius (LG) and soleus (SL) were manually delineated and was used to compute averaged R2* value for each muscle and to obtain a R2*-vs-time curve.A model of dHb kinetics: As BOLD signals originate from dHb, we proposed to characterize dHb concentration with the following equation,
$$ \frac{d[dHb]}{dt}=-F(t)*[dHb]+M $$
where $$$M$$$ relates to oxygen consumption rate, and $$$F(t)$$$ is blood flow. To simplify the model, we chose to model the muscle blood flow during exercise recovery as the following exponential decay form,
$$ F(t)=c_1e^{-c_2t}+F_0 $$
where $$$F_0$$$ is the resting level of $$$F(t)$$$, and parameters $$$c_1$$$ and $$$c_2$$$ characterize muscle hyperemia. Integration of $$$F(t)$$$ shows that $$$c_1/c_2$$$ is the area under the curve above the level of $$$F_0$$$, so we define “hyperemia index (HI)” as $$$c_1/c_2$$$. Also, we assumed a linear relationship between $$$[dHb]$$$ and R2*. In solving the above equations numerically, we estimated $$$[dHb]_0$$$ as the mean of the first 2 points, and $$$[dHb]_{\infty}$$$ as the mean of the last 3 data points. Model fitting was performed with optimization to minimize the root mean square error (RSME) between R2* data points and the fitted curve.
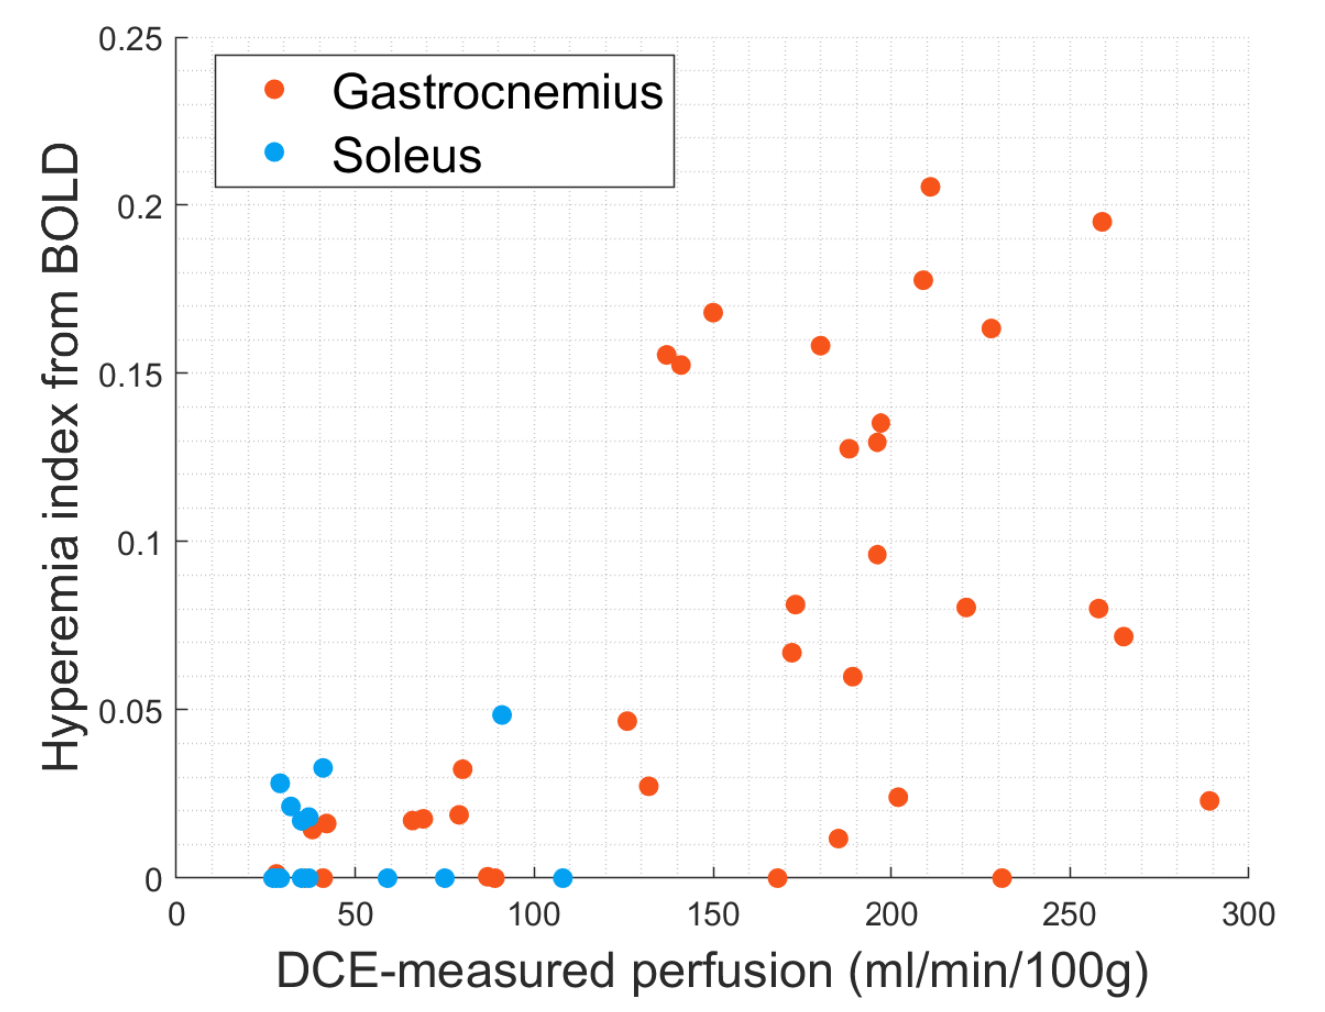
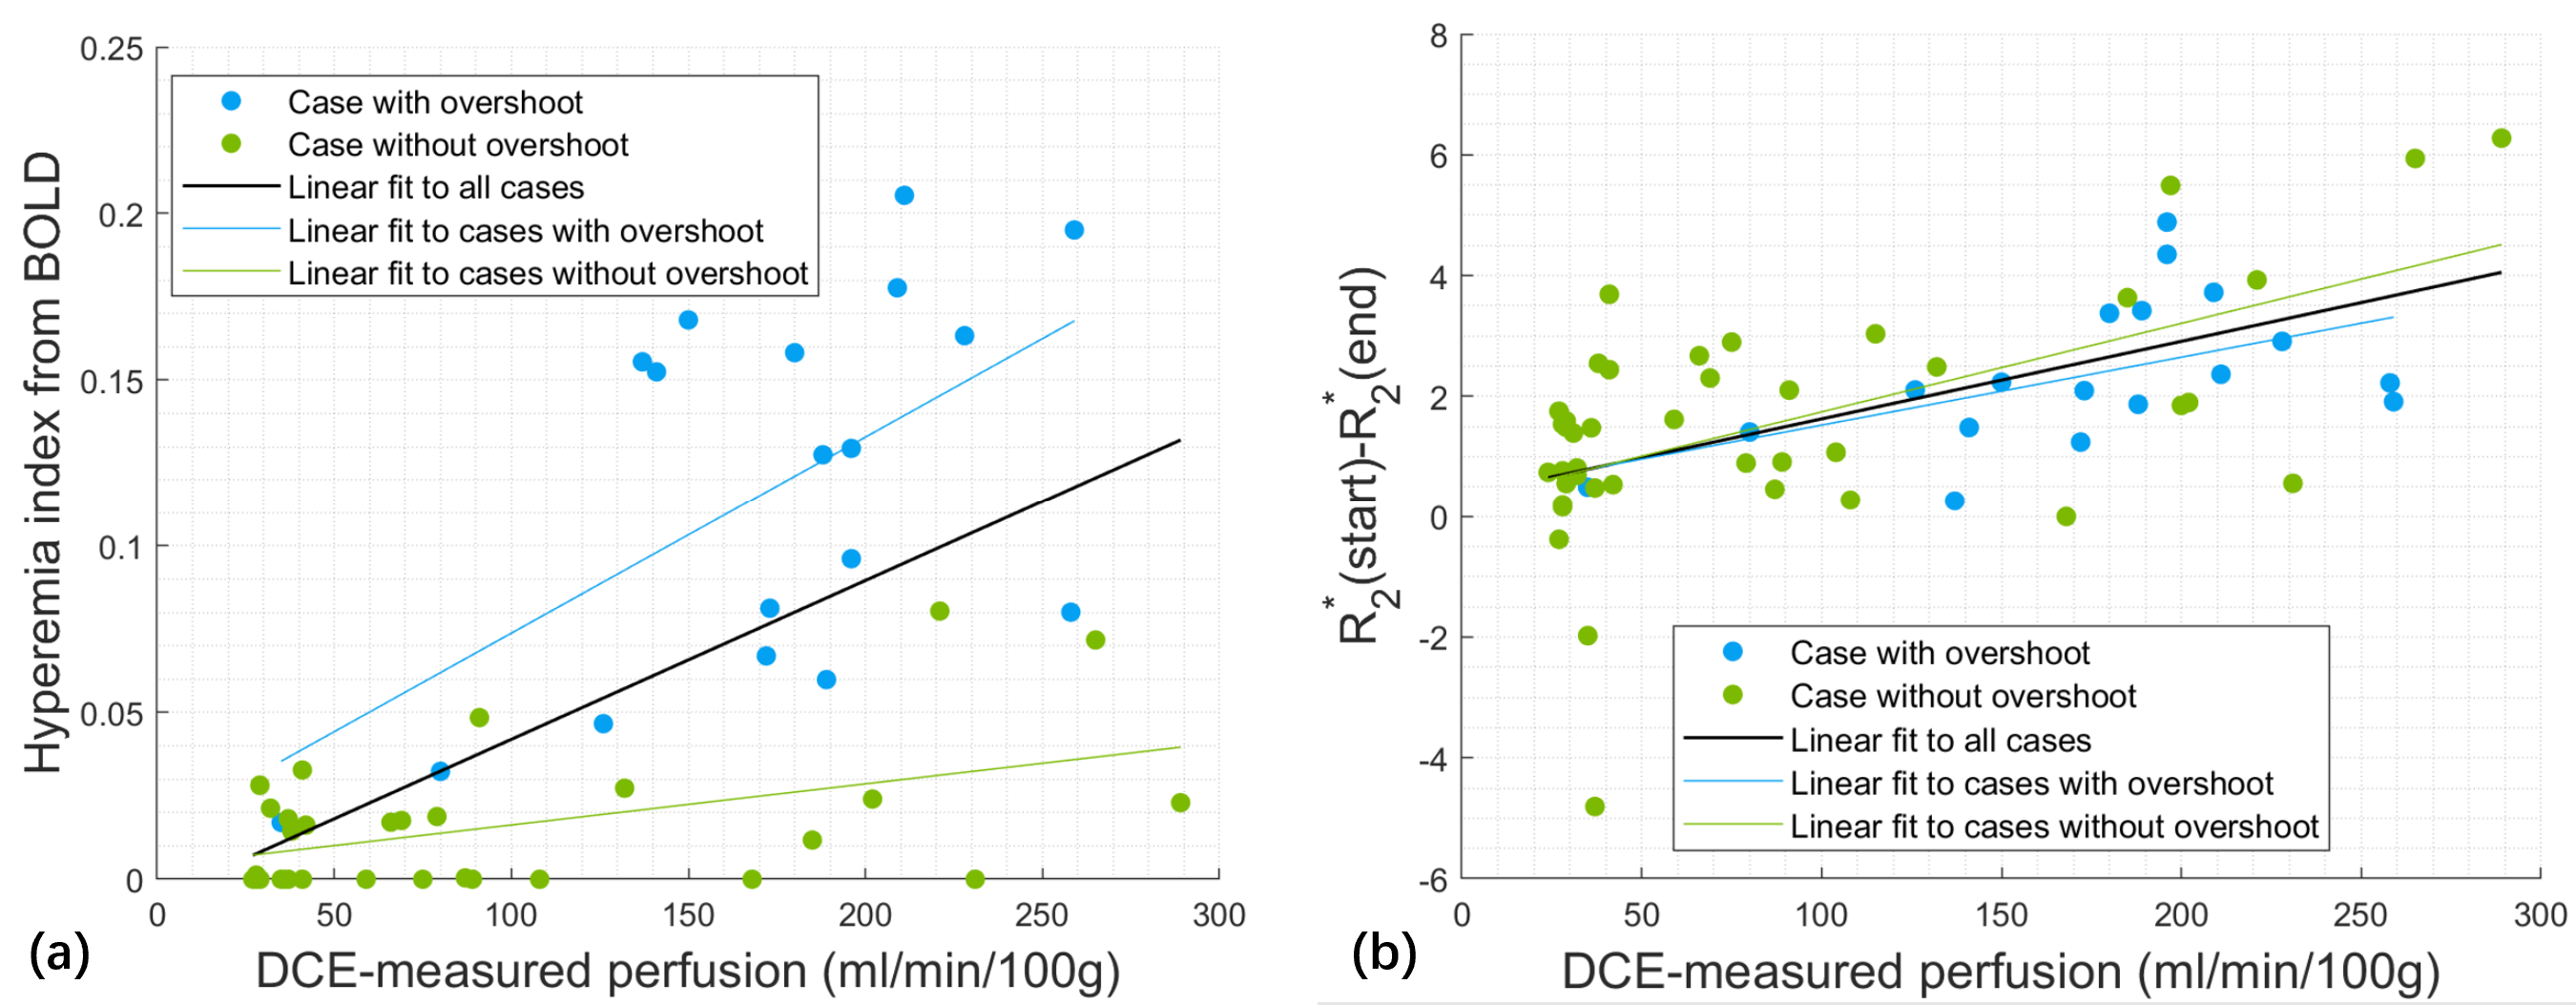
Statistical analysis: Scatter plots were generated to display the HI and the DCE-measured perfusion for all the muscles. Correlation coefficients were computed between the two parameters. The analysis was separated for the muscles with the overshoot feature and those without the feature. As a comparison, we also computed the overall change of R2*, and correlated it with DCE-measured perfusion.
Result
Model fitting for all the data converged successfully, with averaged RMSE of $$$0.39±0.24 ms^{-1}$$$ across all the cases. Two representative examples are shown in Fig.1. Fig. 2 displays the values of hyperemia index (HI) and DCE-measured perfusion for the muscles. Plantar flexion did not significantly stimulate soleus, so both HI and perfusion for soleus were low. However, even though most gastrocnemius had high perfusion ($$$100-300 ml/min/100g$$$), their HI varied within a large range from 0 and 0.2.Based on the presence of overshoot in their R2*-vs-time curves, we separated the data into two groups (shown as different symbols in Fig. 3). The plots reveal very interesting findings. Parameter HI differentiated the “overshoot” cases from the no-overshoot ones (Fig. 3a), while the R2* difference failed (Fig. 3b). It was also noted that the cases with high DCE perfusion level could have high or low HI values.
Discussion
By considering the time-varying blood flow during exercise recovery, we proposed a kinetic model for quantifying dynamic BOLD data of muscles. The model successfully fitted all the cases, with the new hyperemia index (HI) characterizing the overshoot feature. We observed a “discrepancy” between HI and DCE-measured perfusion, i.e., the cases with high DCE-measured perfusion could have high or low HI values. This “discrepancy” is very possibly due to that DCE MRI signal is sensitive to contrast enhancement in blood vessels of all levels, while BOLD signal is sensitive to dHb so reflects capillary-level perfusion. For example, cases with large perfusion value but small HI (the green points in the right-bottom corner of Fig. 3a) could be interpreted as having increased blood flow in large vessels but no significant oxygen consumption in the muscle tissue. The observed discrepancy suggests that a combination of conventional DCE and our new BOLD approach would enable more detailed characterization of post-exercise muscle hyperemia.Conclusion
The proposed model provides a quantitative tool for properly analyzing dynamic BOLD data acquired during exercise recovery. The new parameter hyperemia index has the potential of combining with conventional DCE scan to enable more detailed characterization of post-exercise muscle hyperemia.Acknowledgements
No acknowledgement found.References
1. Zhang JL, Layec G, Hanrahan C, et al. Exercise-induced calf muscle hyperemia: quantitative mapping with low-dose dynamic contrast enhanced magnetic resonance imaging. Am J Physiol Heart Circ Physiol. 2019;316(1):H201-H211. doi:10.1152/ajpheart.00537.2018
Figures