3107
Association of Thigh Muscle Fat with Isometric Strength Measurements in Patients with T2DM Using Chemical Shift Encoding-Based Water-Fat MRI1Department of Medical Imaging, First Affiliated Hospital of Kunming Medical University, Kunming, China, 2GE Healthcare, MR Research China, Beijing, China
Synopsis
Iterative decomposition of water and fat with echo asymmetry and least-squares estimation quantitation sequence (IDEAL-IQ) is a chemical shift encoding-based water-fat MRI technique which allows noninvasive fat quantification. In this study, we investigated the correlation between thigh muscle fat fraction (FF) and isokinetic strength measurements in middle-aged and elderly obese participants with T2DM scanned at 3.0T MR. Intramuscular FF was shown to be a significant predictor of peak torque (PT) and total work (TW) in the thigh muscle. Therefore, intramuscular FF might provide reliable imaging markers for the prevention and monitoring of thigh muscle dysfunction in participants with T2DM.
Introduction
T2DM is a common metabolic disease in middle-aged and elderly people. hyperglycemia, chronic inflammation, oxidative stress and diabetes complications can lead to muscle dysfunction [1,2], which increases the risk of falls in middle-aged and elderly participants. Therefore, early prevention and monitoring of muscle dysfunction in middle-aged and elderly participants with T2DM is very important. Many studies have found a strong correlation between muscle fat content and muscle strength in healthy people [3,4]. However, few studies have explored the relationship between muscle fat content and muscle strength in participants with T2DM. Therefore, we aimed to investigate the correlation between thigh muscle fat content and muscle strength in middle-aged and elderly obese participants with T2DM.Materials and Methods
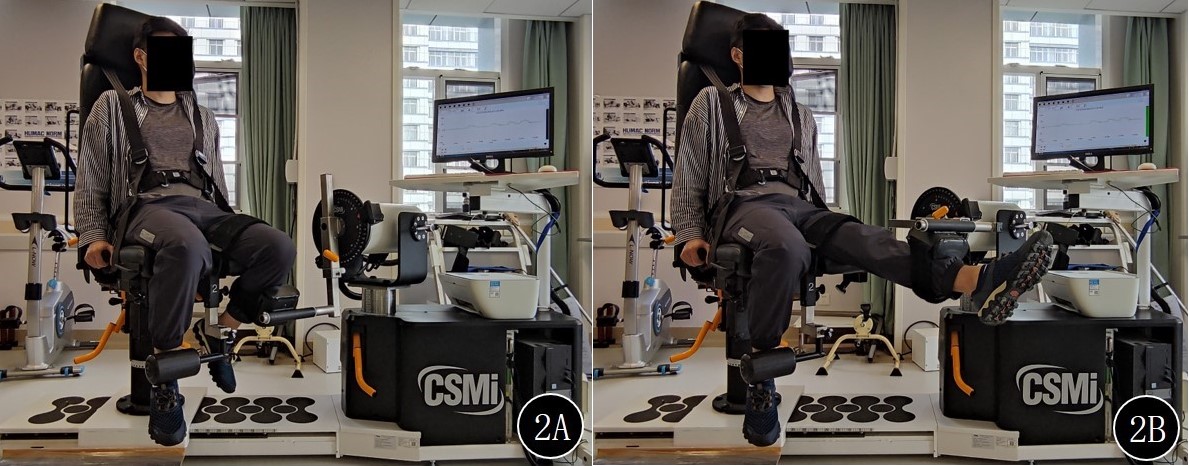
This study was approved by the institutional review board, and written informed consent was obtained from all patients. 30 middle-aged and elderly obese participants with T2DM whose disease duration were more than 10 years and 30 age- and sex-matched normal-weight participants without T2DM were enrolled prospectively. All subjects underwent axial T1WI and IDEAL-IQ of the left mid-thigh, coronal T2WI of the thigh on a 3.0T MRI scanner (Discovery MR 750W, GE Healthcare, Waukesha, USA). The area of interest (ROI) of the knee extensors (quadriceps femoris) and knee flexors (hamstrings) in the left mid-thigh was delineated independently by two senior physicians (Figure 1). Muscle cross-sectional area (CSA),SMI, intermuscular FF, intramuscular FF were obtained. In addition, isokinetic muscle strength measurements were performed on the left knee joint of all participants at angular speeds of 60°/s and 180°/s to obtain peak torque (PT) and total work (TW) of knee flexors and extensors (Figure 2). The differences of CSA, SMI, intermuscular FF, intramuscular FF, PT and TW between the two groups were compared by independent T-test or Mann-Whitney U test. The correlation between CSA, SMI, intermuscular FF, intramuscular FF and PT, TW of thigh muscles were analyzed using Spearman correlation analysis. Multivariate regression analysis was used to determine significant predictors of thigh extension and flexion strength. P-value of less than 0.05 was considered to represent a significant difference.Results
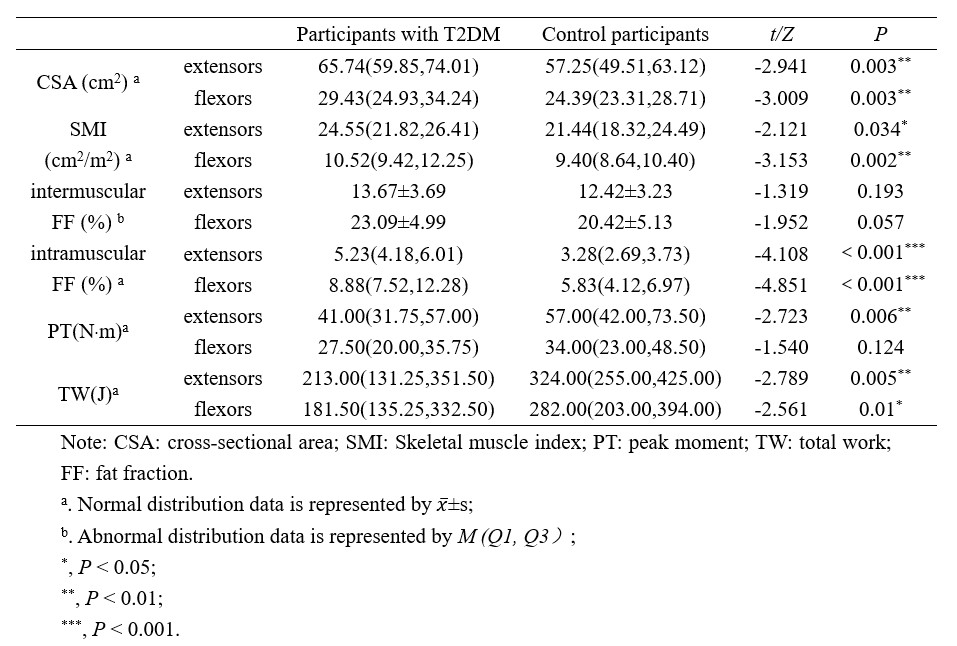
The intermuscular FF, intramuscular FF and CSA measured by the two physicians was highly consistent, with ICC values of 0.866, 0.988 and 0.971, respectively. Intramuscular FF in the flexors and extensors of the thigh in participants with T2DM was higher than that in the control group (P < 0.001), while CSA, SMI and TW were lower than those in the control participants (P < 0.05) (Table 1, Figure 3).There were significant negative correlation between intramuscular FF and PT, TW in participants with T2DM (extensors: r=-0.727, -0.695, P <0.001; flexors: r=-0.664, -0.752, P <0.001); There were significant negative correlation between intermuscular FF and PT, TW (extensors: r =-0.719, -0.695, P <0.05; flexors: r=-0.664, -0.752, P <0.05); The CSA of thigh extensors was significantly correlated with PT and TW (r=-0.519, -0.443, P <0.05). There was no significant correlation between SMI and PT, TW in flexors and extensors of thigh (Table 2). Intramuscular FF was the only statistically significant predictor of PT and TW of extensors and flexors of thigh in multivariate regression analysis (extensors: R2adj =0.534, P=0.006; R2adj =0.432, P=0.008; flexors: R2adj =0.456, P=0.004; R2adj =0.486, P=0.001).Discussion
In our study, thigh muscle FF (intermuscular FF and intramuscular FF) was significantly negatively correlated with muscle strength in middle-aged and elderly obese participants with T2DM, which was similar to previous study about healthy participants [3], and intramuscular FF was found to be a significant predictor of thigh muscle strength in middle-aged and elderly obese participants with T2DM. Possible explanations are that intramuscular fat deposition and the associated inflammation may contribute to insulin resistance, mitochondrial damage, and oxidative stress of muscles, which could impair the proteins that regulate the force production of muscle tissues, leading to the decreased muscle strength of patients with T2DM [5,6].Conclusion
Muscle FF based on IDEAL-IQ can accurately quantify the fat content of thigh muscle in middle-aged and elderly obese participants with T2DM. Intramuscular FF is a significant predictor of extensors and flexors PT and TW of thigh, which can provide a reliable imaging marker for the prevention and monitoring of thigh muscle dysfunction in middle-aged and elderly obese participants with T2DM.Acknowledgements
We are grateful to Dr. Tao Ding from the Department of Rehabilitation, First Affiliated Hospital of Kunming Medical University for isokinetic muscle strength measurements.References
[1] Karampinos D C, Baum T, Nardo L, et al. Characterization of the regional distribution of skeletal muscle adipose tissue in type 2 diabetes using chemical shift-based water/fat separation [J]. J Magn Reson Imaging, 2012, 35(4): 899-907.
[2] Bianchi L, Volpato S. Muscle dysfunction in type 2 diabetes: a major threat to patient's mobility and independence [J]. Acta Diabetol, 2016, 53(6): 879-889.
[3] Baum T, Inhuber S, Dieckmeyer M, et al. Association of Quadriceps Muscle Fat with Isometric Strength Measurements in Healthy Males Using Chemical Shift Encoding-Based Water-Fat Magnetic Resonance Imaging [J]. J Comput Assist Tomogr, 2016, 40(3): 447-451.
[4] Schlaeger S, Inhuber S, Rohrmeier A, et al. Association of paraspinal muscle water-fat MRI-based measurements with isometric strength measurement s [J]. Eur Radiol, 2019, 29(2): 599-608.
[5] Kalinkovich A, Livshits G. Sarcopenic obesity or obese sarcopenia: A cross talk between age-associated adipose tissue and skelet al muscle inflammation as a main mechanism of the pathogenesis [J]. Ageing Res Rev, 2017, 35: 200-221.
[6] Livshits G, Kalinkovich A. Inflammaging as a common ground for the development and maintenance of sarcopenia, obesity, cardiomyo pathy and dysbiosis [J]. Ageing Res Rev, 2019, 56: 100980.
Figures