3106
Fast and accurate creatine chemical exchange saturation transfer muscle imaging with quasi-steady state post-processing algorithm at 3T1National Cancer Center/National Clinical Research Center for Cancer/Cancer Hospital & Shenzhen Hospital, Chinese Academy of Medical Sciences and Peking Union Medical College, Shenzhen, China, 2Shenzhen Institute of Advanced Technology, Chinese Academy of Sciences, Shenzhen, China, 3GE Healthcare, Beijing, China, 4Emory University School of Medicine, Atlanta, GA, United States
Synopsis
Although CrCEST MRI is increasingly employed in muscle imaging, its measurement depends on the RF saturation duration (Ts) and relaxation delay (Td). This study evaluated the quasi-steady-state (QUASS) algorithm for fast and robust CrCEST measurement. Briefly, CrCEST experiments were performed at 3T under two representative imaging conditions. Both phantom and volunteer experiments showed that the routine CrCEST increased significantly with Ts and Td and were significantly smaller than the corresponding QUASS indices. In comparison, the QUASS CrCEST meaurement showed little dependence on the scan protocol, establishing the robustness and accuracy of QUASS CrCEST muscle MRI.
Introduction
Creatine (Cr) CEST MRI enables the detection of the creatine guanidinium group at 1.8 ppm from the bulk water resonance, offering a novel means to image muscular energy metabolism, tumor, and microenvironmental tissue pH [1-3]. However, the measurable CEST effect strongly depends on scan parameters [4, 5], including RF irradiation duration (Ts) and the relaxation delay (Td) between scans [6, 7]. Because CEST MRI scans were rarely performed using sufficiently long saturation times due to scan time or specific absorption rate limitations, equilibrium CEST signal was often underestimated. Building on the development of quasi-steady-state (QUASS) CEST analysis that enables reconstruction of the equilibrium CEST effect from experimental measurements [8], the current study aimed to investigate QUASS CrCEST muscle MRI at 3T.Materials and Methods
Phantom preparation: A phantom consisting of five 20-mL vials with serially varied Gd and Cr concentrations was constructed. In brief, 1% agarose was added to pH buffer solution at 6.86, with three Cr concentrations of 20, 40, and 60 mM. Then, 6 μL or 8 μL Gd were added to the vials to adjust the T1 (Figure 1). The phantom solidified at room temperature before experiments.MRI study: The study was approved by the local Institutional Review Board. Five healthy volunteers without a history of any known musculoskeletal disorders were prospectively enrolled (49.6±12.8 years, 3 males/2 females) and scanned on a 3T scanner (Discovery MR 750w, GE), including T1 (TR/TE=5 s/7.7 ms, inversion time (TI) = 200, 500, 800, 1100, and 1400 ms) and CEST MRI with a fat-suppressed single-shot FSE image readout (TE = 26 ms, saturation power B1=0.75 μT, frequency offsets between ±600 Hz with intervals of 20 Hz in addition to three unsaturated scans, FOV = 240×240 mm2, in-planar resolution = 1.88×1.88 mm2, slice thickness = 5 mm, TE = 26 ms) with Ts/Td of 1s/1s and Ts/Td of 2s/2s. The scan time was 2.13 minutes and 4.27 minutes for Ts/Td of 1s/1s and 2s/2s, respectively.
Data analysis: Data were analyzed in MATLAB. The parametric T1 map (T1w) was obtained by fitting the signal intensity with respect to the recovery time (Ii = I0[1-(1-η)e-TIi/T1w]) per pixel, where η is the inversion efficiency, and TIi is the ith inversion time. The CEST signal evolution was modeled during the relaxation recovery and CEST labeling, from which the QUASS CEST effect is derived [8, 9]. The measured and QUASS-reconstructed Z spectra were compared under different Ts and Td. CrCEST, combined magnetization transfer (MT) and nuclear overhauser enhancement (NOE) effects, and direct water saturation were isolated using a 3-pool Lorentzian fitting model in manually outlined major muscle groups, including anterior tibialis (AT), lateral gastrocnemius (LG), medial gastrocnemius (MG), and soleus of the lower leg. Paired Student's t-test was performed with P values<0.05 considered statistically significant.
Results and Discussion
Figure 1 compares the apparent and QUASS CEST asymmetry images at 1.8 ppm under Ts/Td times of 1s/1s and 2s/2s from the multi-vial phantom. The magnitude of the apparent CrCEST effect increased noticeably with Ts and Td and was lower than the respective QUASS CrCEST measurements. In comparison, QUASS CrCEST images showed little Ts and Td dependence.Figure 2 illustrates correlation tests and Bland-Altman plots of apparent and QUASS CrCEST measurements between Ts/Td of 1s/1s and 2s/2s. The QUASS CrCEST effects consistently exhibited better agreement between different Ts and Td times than respective apparent measures.
Figure 3 shows representative Z-spectra from anterior tibials of a volunteer. The experimentally acquired Z-spectra with the short Ts and Td (i.e., 1s) were substantially higher than those with the long Td/Ts of 2s (Fig. 3a), indicating insufficient saturation transfer. This translates to a noticeable difference of the resolved CrCEST between different Ts/Td times (Fig. 3b). On the contrary, their QUASS Z-spectra nearly overlapped and were comparable (Fig. 3c). Furthermore, the CrCEST signals resolved from QUASS Z-spectra with the multipool Lorentzian model overlapped reasonably well with Ts/Td of 1s/1s and 2s/2s (Fig. 3d). Similar results were obtained in other muscle regions.
Figure 4 shows the multiparametric images of a representative volunteer. The apparent CrCEST signals increased conspicuously with Ts/Td. In contrast, QUASS CrCEST signals were consistently comparable with less dependence on Ts and Td times. Furthermore, the QUASS CrCEST signals were significantly higher than the apparent ones (Table 1, P<0.01). Although QUASS CrCEST signals in LG, MG, and soleus still differed between different Ts/Td times (P<0.05), the magnitude of the difference was much smaller than the respective apparent measures.
Conclusion
We observed a substantial influence of Ts/Td on the apparent CrCEST effect quantification. The QUASS algorithm corrects the CrCEST effect, exhibiting its potential to quantify muscle CrCEST within a shortened scan time. It also bodes well for further CEST quantifications, such as measuring tissue pH and dynamic creatine kinase function. To summarize, the QUASS algorithm offers a practical approach to expedite the CrCEST scans and provide robust quantification at 3T, facilitating the adoption of CrCEST MRI to the clinical routines.Acknowledgements
Grant Support: National Natural Science Foundation of China (81871348 and 91859102).References
1. Haris M, Singh A, Cai K, et al. A technique for in vivo mapping of myocardial creatine kinase metabolism. Nat Med 2014;20(2):209-214.
2. McVicar N, Li AX, Goncalves DF, et al. Quantitative tissue pH measurement during cerebral ischemia using amine and amide concentration-independent detection (AACID) with MRI. J Cereb Blood Flow Metab 2014;34(4):690-698.
3. Harris RJ, Cloughesy TF, Liau LM, et al. pH-weighted molecular imaging of gliomas using amine chemical exchange saturation transfer MRI. Neuro Oncol 2015;17(11):1514-1524
4. Kim J, Wu Y, Guo Y, Zheng H, Sun PZ. A review of optimization and quantification techniques for chemical exchange saturation transfer MRI toward sensitive in vivo imaging. Contrast Media Mol Imaging 2015;10(3):163-178.
5. Dula AN, Dewey BE, Arlinghaus LR, et al. Optimization of 7-T chemical exchange saturation transfer parameters for validation of glycosaminoglycan and amide proton transfer of fibroglandular breast tissue. Radiology 2015;275(1):255-261.
6. Sun PZ, Lu J, Wu Y, Xiao G, Wu R. Evaluation of the dependence of CEST-EPI measurement on repetition time, RF irradiation duty cycle and imaging flip angle for enhanced pH sensitivity. Phys Med Biol 2013;58(17):N229-240.
7. Zaiss M, Angelovski G, Demetriou E, McMahon MT, Golay X, Scheffler K. QUESP and QUEST revisited - fast and accurate quantitative CEST experiments. Magn Reson Med 2018;79(3):1708-1721
8. Sun PZ. Quasi-steady state chemical exchange saturation transfer (QUASS CEST) analysis-correction of the finite relaxation delay and saturation time for robust CEST measurement. Magn Reson Med 2021;85(6):3281-9
9. Zhang XY, Zhai Y, Jin Z, Li C, Sun PZ, Wu Y. Preliminary demonstration of in vivo quasi-steady-state CEST postprocessing-Correction of saturation time and relaxation delay for robust quantification of tumor MT and APT effects. Magn Reson Med 2021;86(2):943-53.
Figures
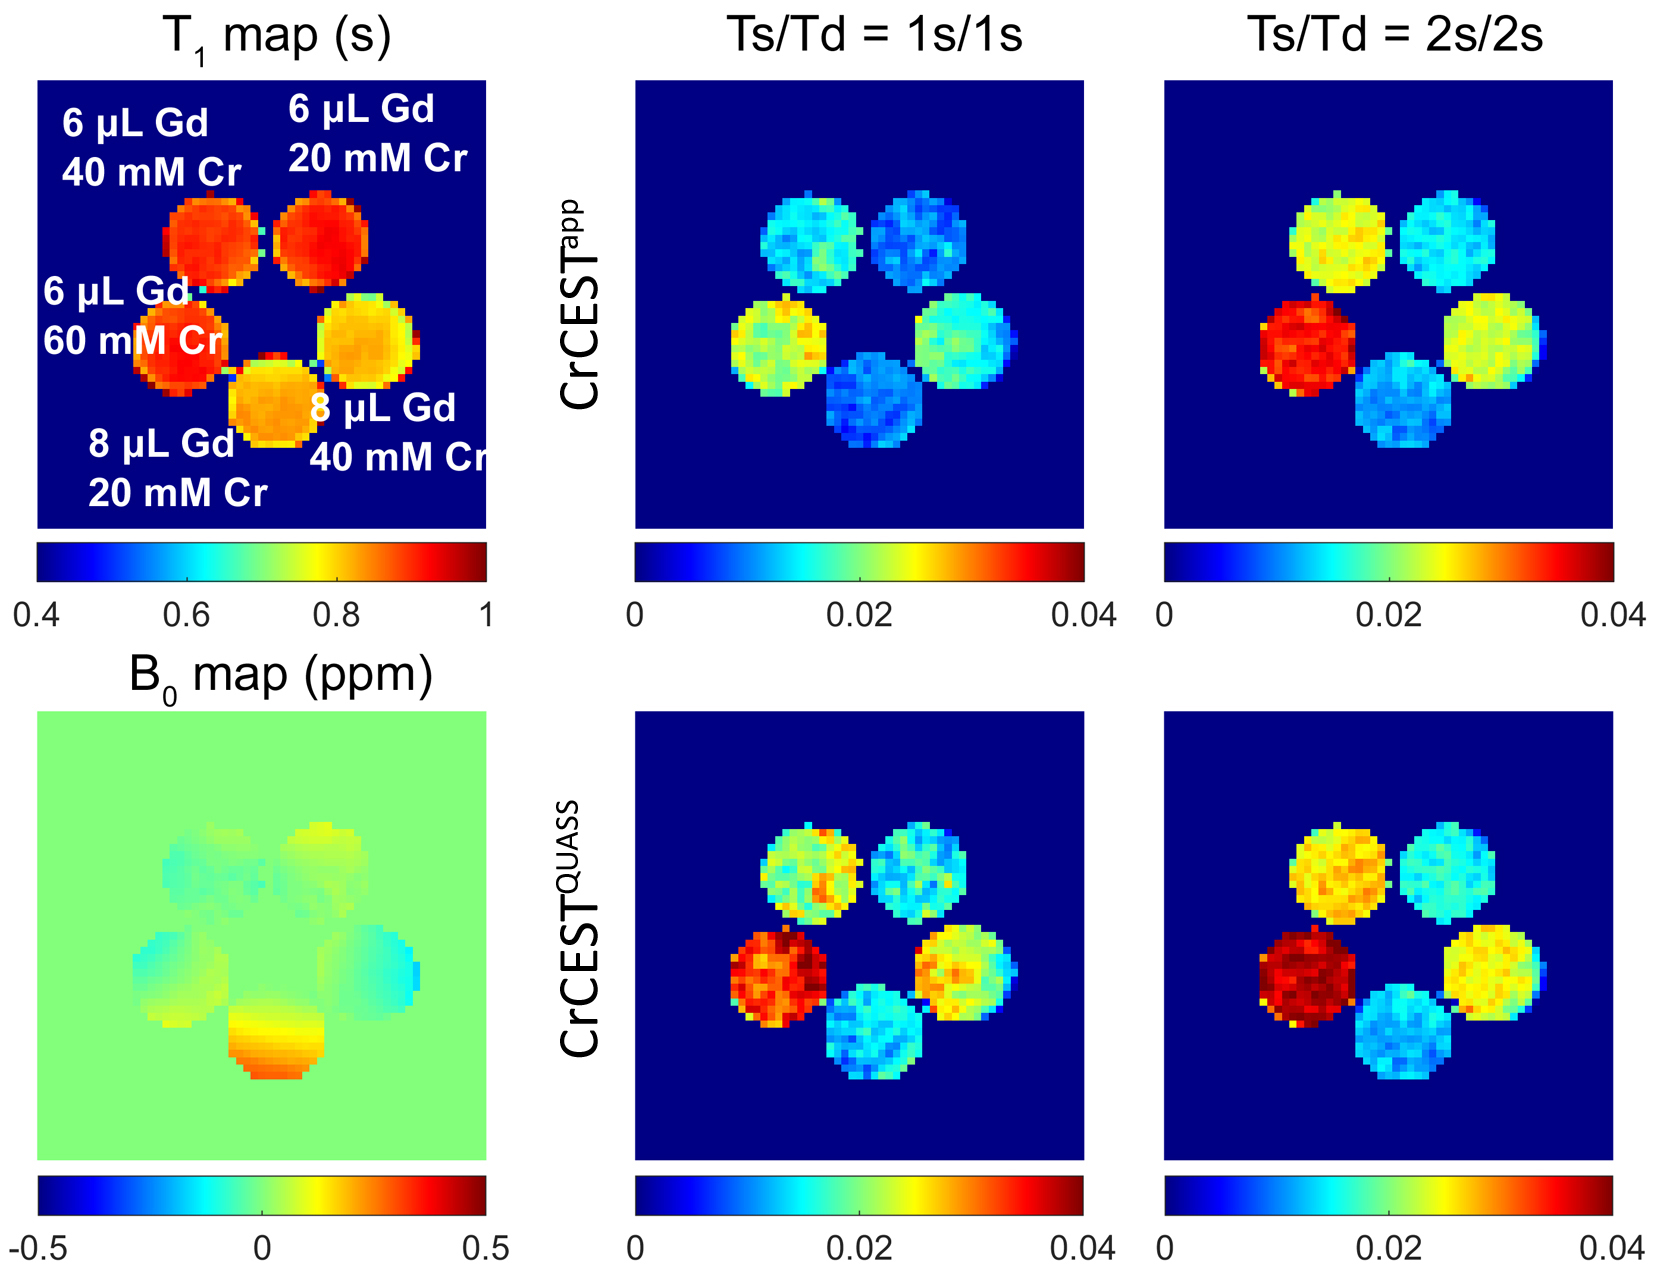
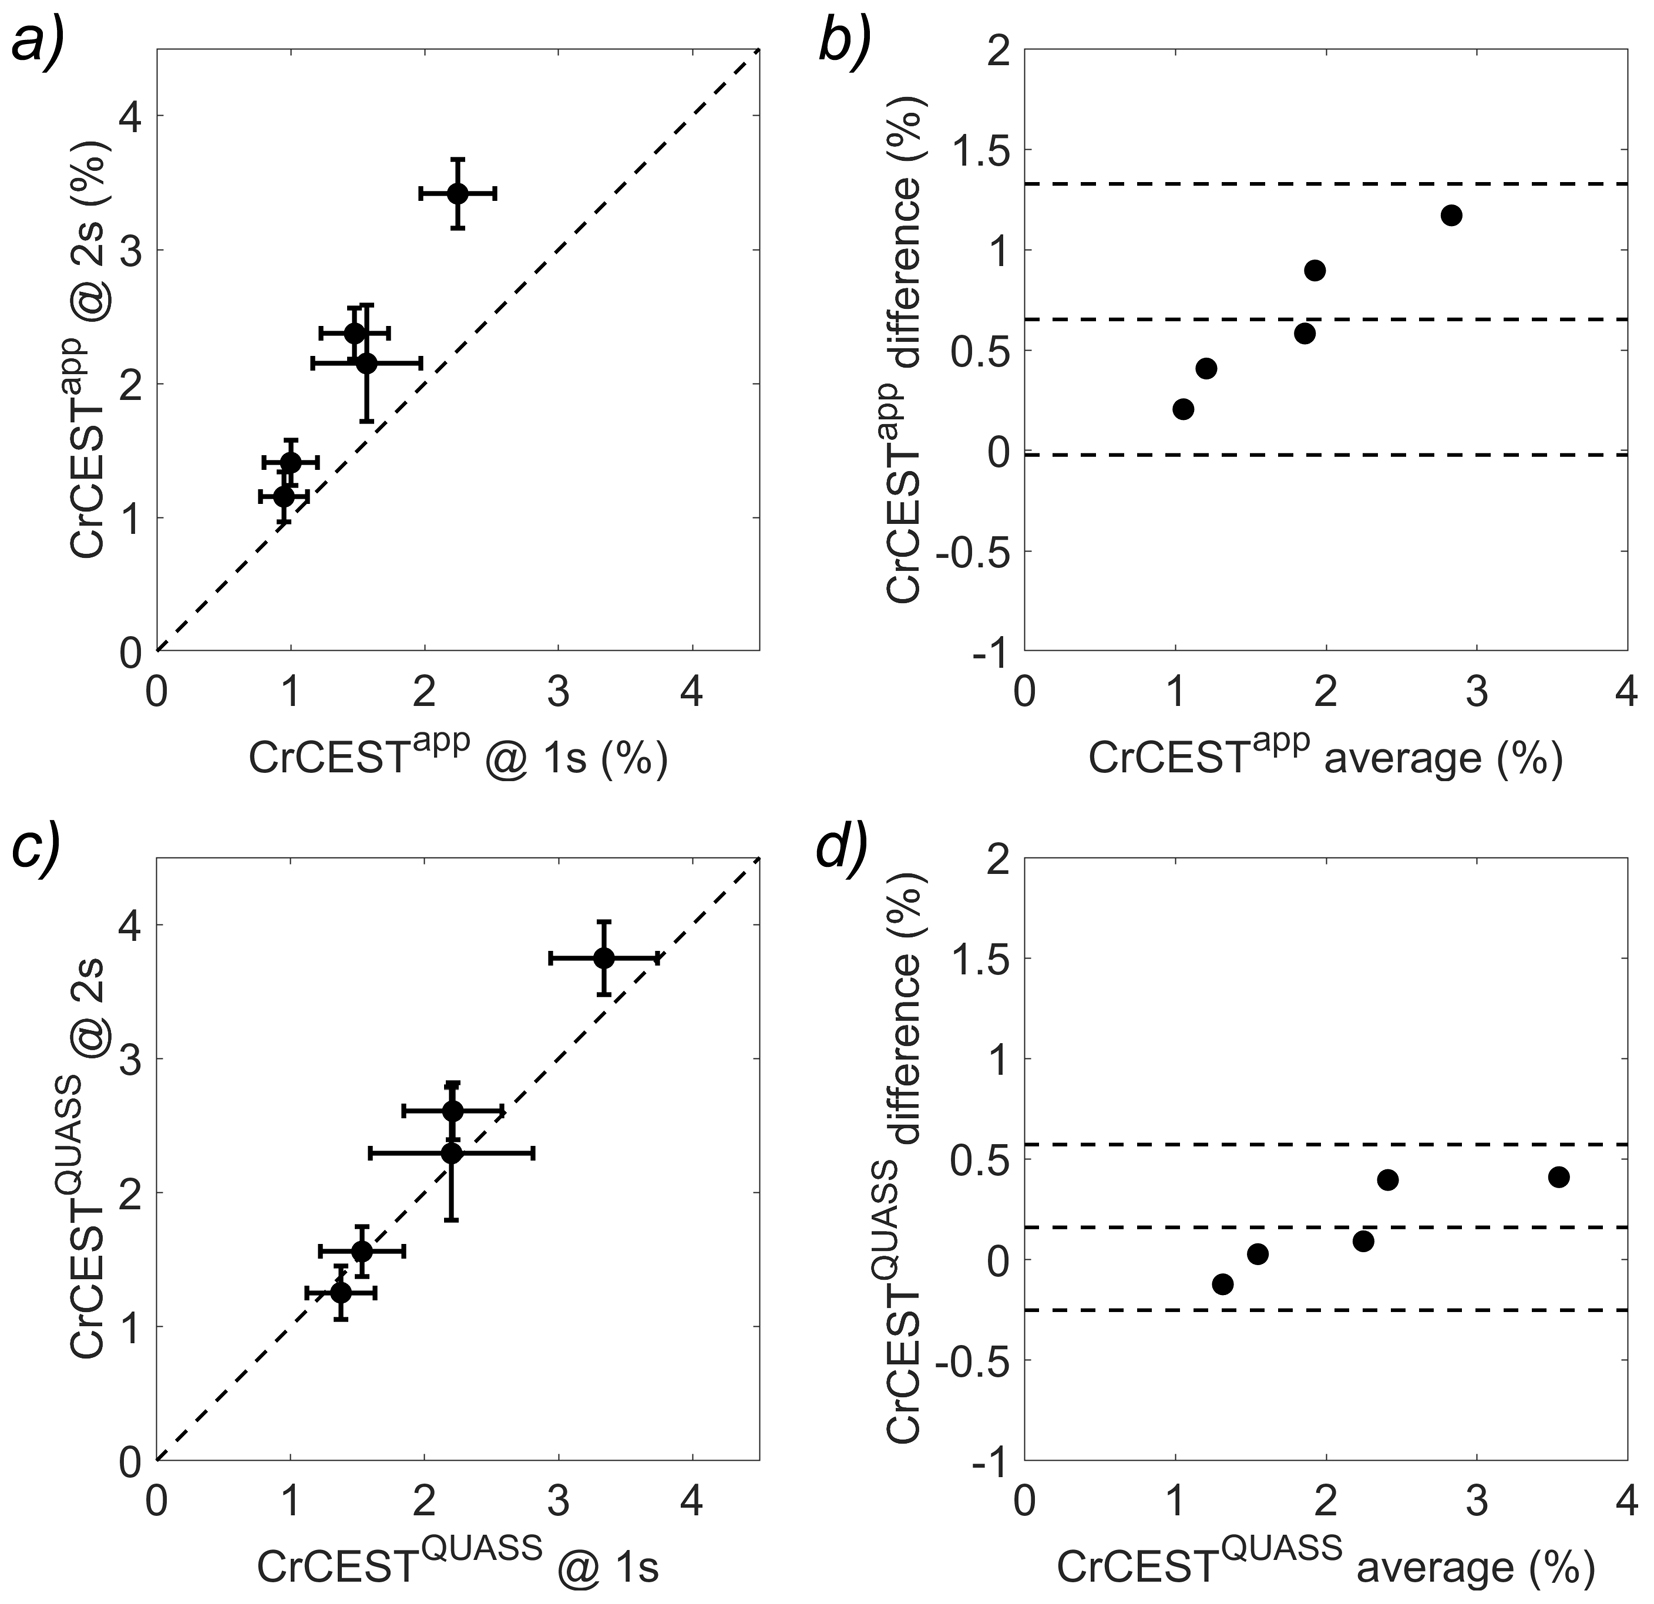
Figure 2. (a) Correlation test and (b) Bland-Altman plots of the apparent CrCEST (CrCESTapp) measurements, and (c) correlation test and (d) Bland-Altman plots of the QUASS CrCEST (CrCESTQUASS) measurements between Ts/Td of 2s/2s and 1s/1s in the multi-compartment Cr phantom. The three horizontal lines depict the mean and the upper and lower limits of agreement (i.e., +1.96 and -1.96 times of standard deviation, respectively).
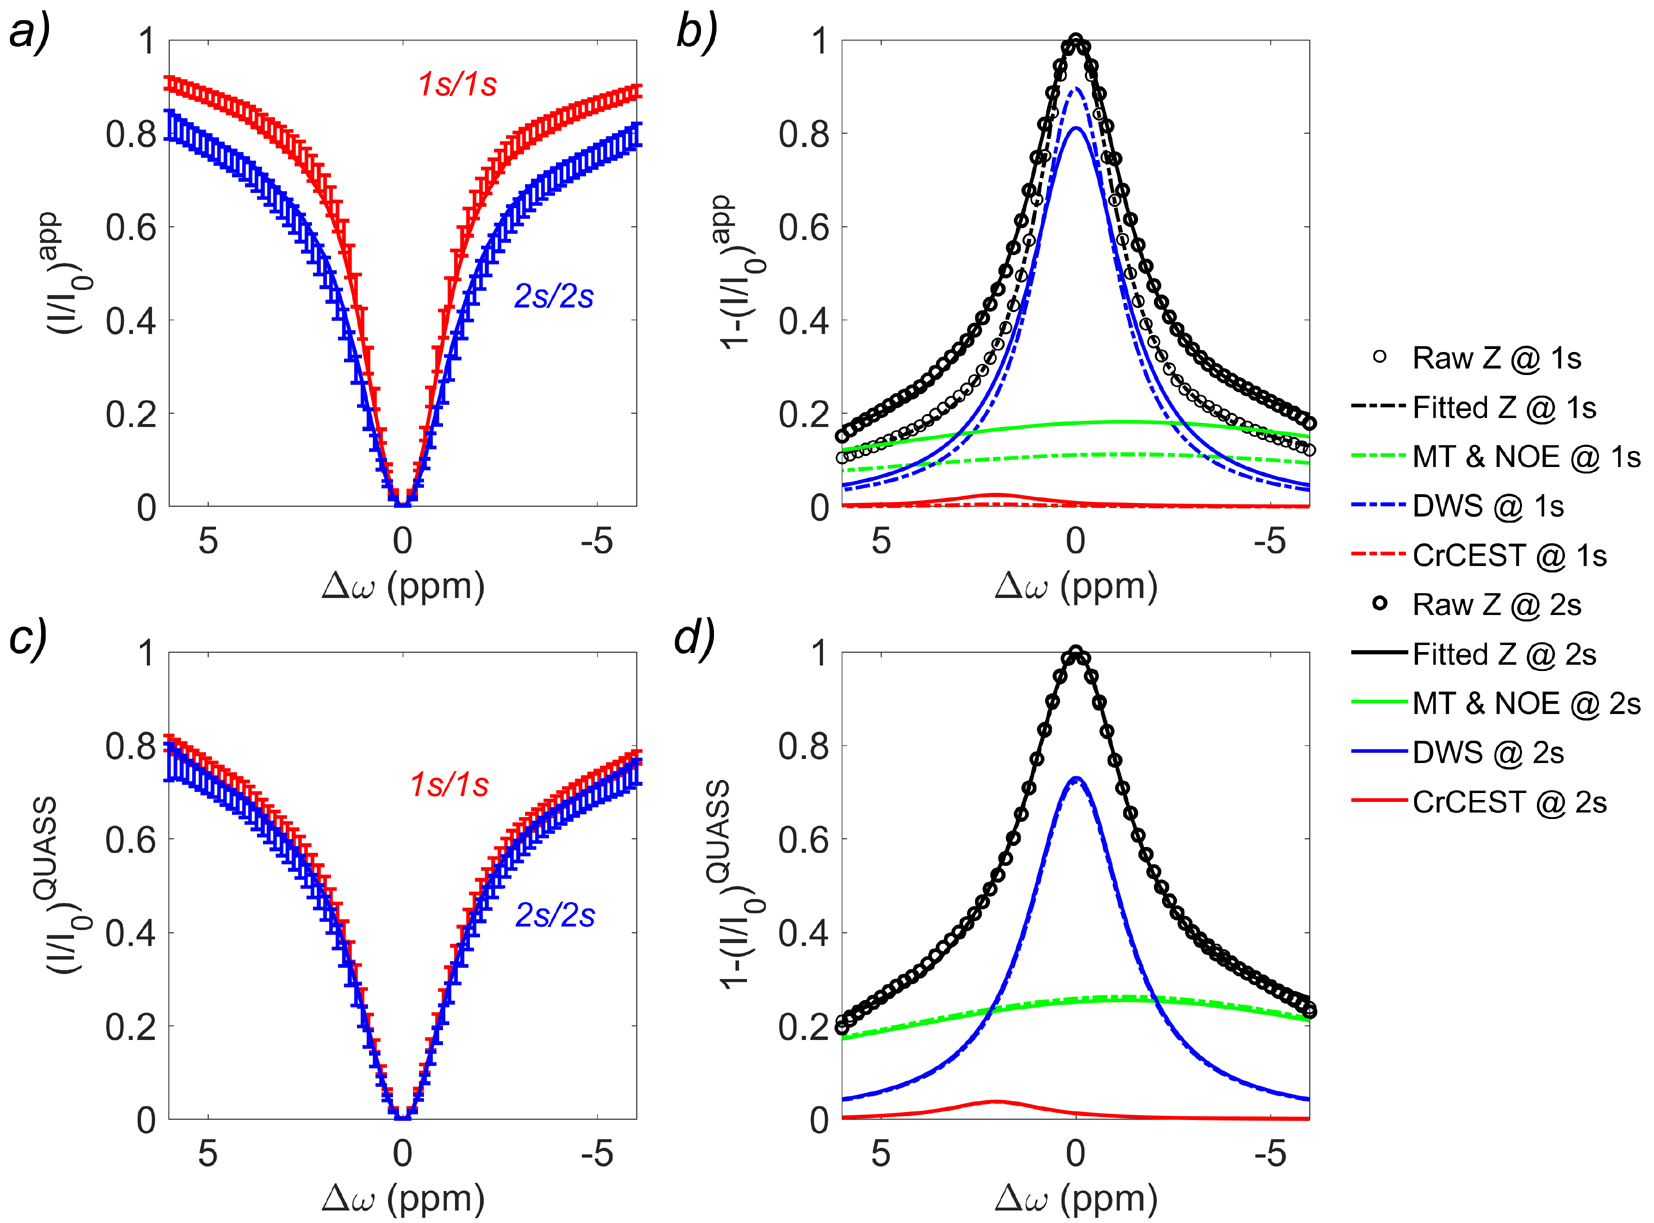
Figure 3. Comparison of (a) apparent Z-spectra and (b) multipool Lorentzian fitting in anterior tibialis from a representative healthy volunteer with Ts/Td of 1s/1s and 2s/2s, respectively. The corresponding QUASS (c) Z-spectra and (d) multipool Lorentzian fitting.
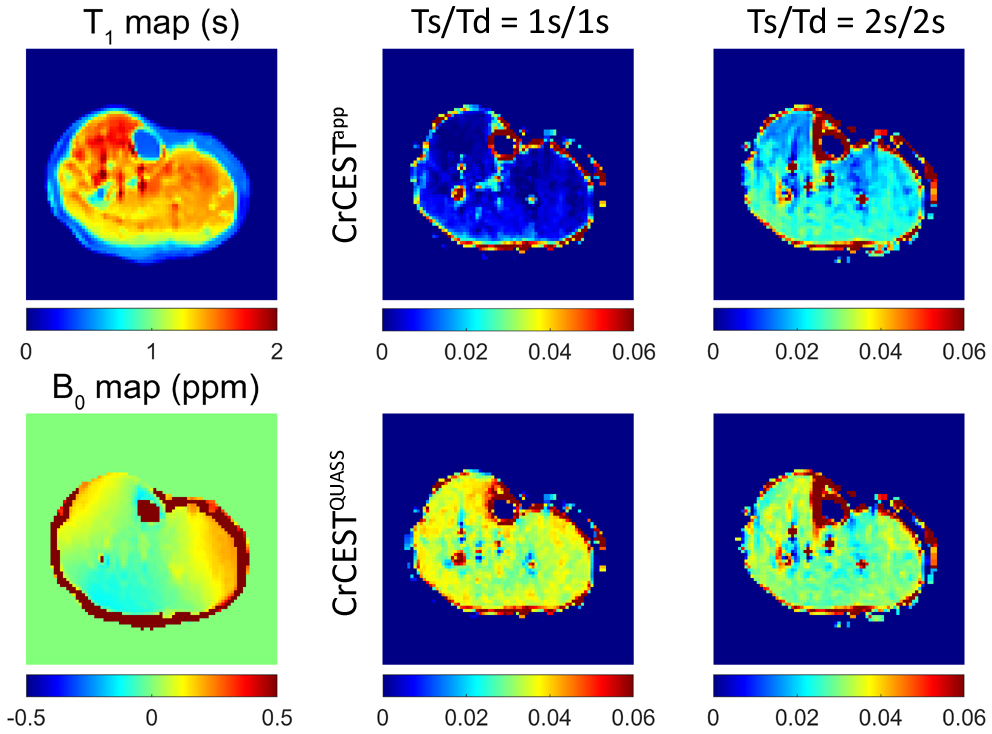
Figure 4. Multi-parametric MR images of a representative healthy volunteer, including T1 map, B0 map, apparent and QUASS CrCEST with Ts/Td of 1s/1s and 2s/2s, respectively.

Table 1. Comparison of apparent and QUASS CrCEST in the four major muscle groups of the lower leg averaged from the five healthy volunteers with saturation time and relaxation delay of 1s/1s and 2s/2s. *P<0.05, **P<0.01, and ***P<0.001 indicate a significant difference between apparent and QUASS measurements under the same saturation time and relaxation delay. AT = anterior tibialis, LG = lateral gastrocnemius, MG = medial gastrocnemius.