3105
QMRI for assessment of anterior cruciate ligament mucoid degeneration and injury1the First Affiliated Hospital of Kunming Medical University, Kunming, China, 2GE Healthcare, MR Research, Beijing, China
Synopsis
The study aims to explore the difference in relaxation time between mucoid degeneration (MD) and injured anterior cruciate ligament (ACL), and evaluate the performance of QMRI (Quantitative magnetic resonance imaging) to identify the grade of MD and injured ACL. It was concluded that T2 * value of the ACL-MD group was higher than that of the injured group, T1, T2 and T2* could be used to quantitatively identify different grades of ACL-MD (T2* may deliberately has the highest diagnostic efficacy), and the same goes for T1 to evaluate ACL injury.
Introduction
For a long time, ACL-MD has been considered as a rare disease, primarily based on case reports. However, recent research has found that it is not as rare as once thought. Studies have shown that the occurrence rate of ACL-MD autopsy is as high as 62.3%[1-2]. Although conventional MRI is currently the preferred examination method for joint diseases, it is limited to the changes of morphology and signal, and It is challenging to recognize the properties and severity of MD and injured ACL.QMRI is mostly used for non-invasive evaluation of the biochemical composition and ultrastructural changes of meniscus and cartilage, while studies on the evaluation of ACL are relatively rare, and no reports have been reported on ACL-MD and ligament injury. In this study, QMRI was used to quantitatively analyze the changes in the relaxation time of the MD and injured ACL, so as to guide their clinical diagnosis and treatment.Methods
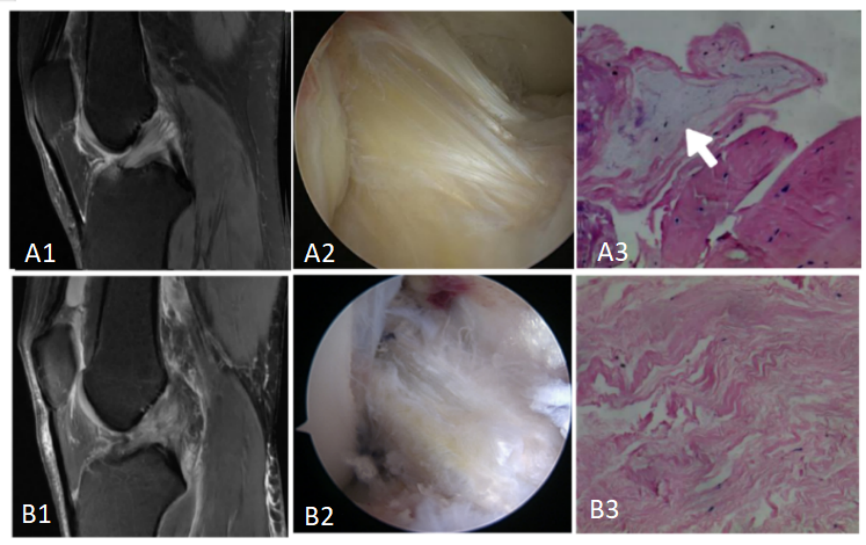
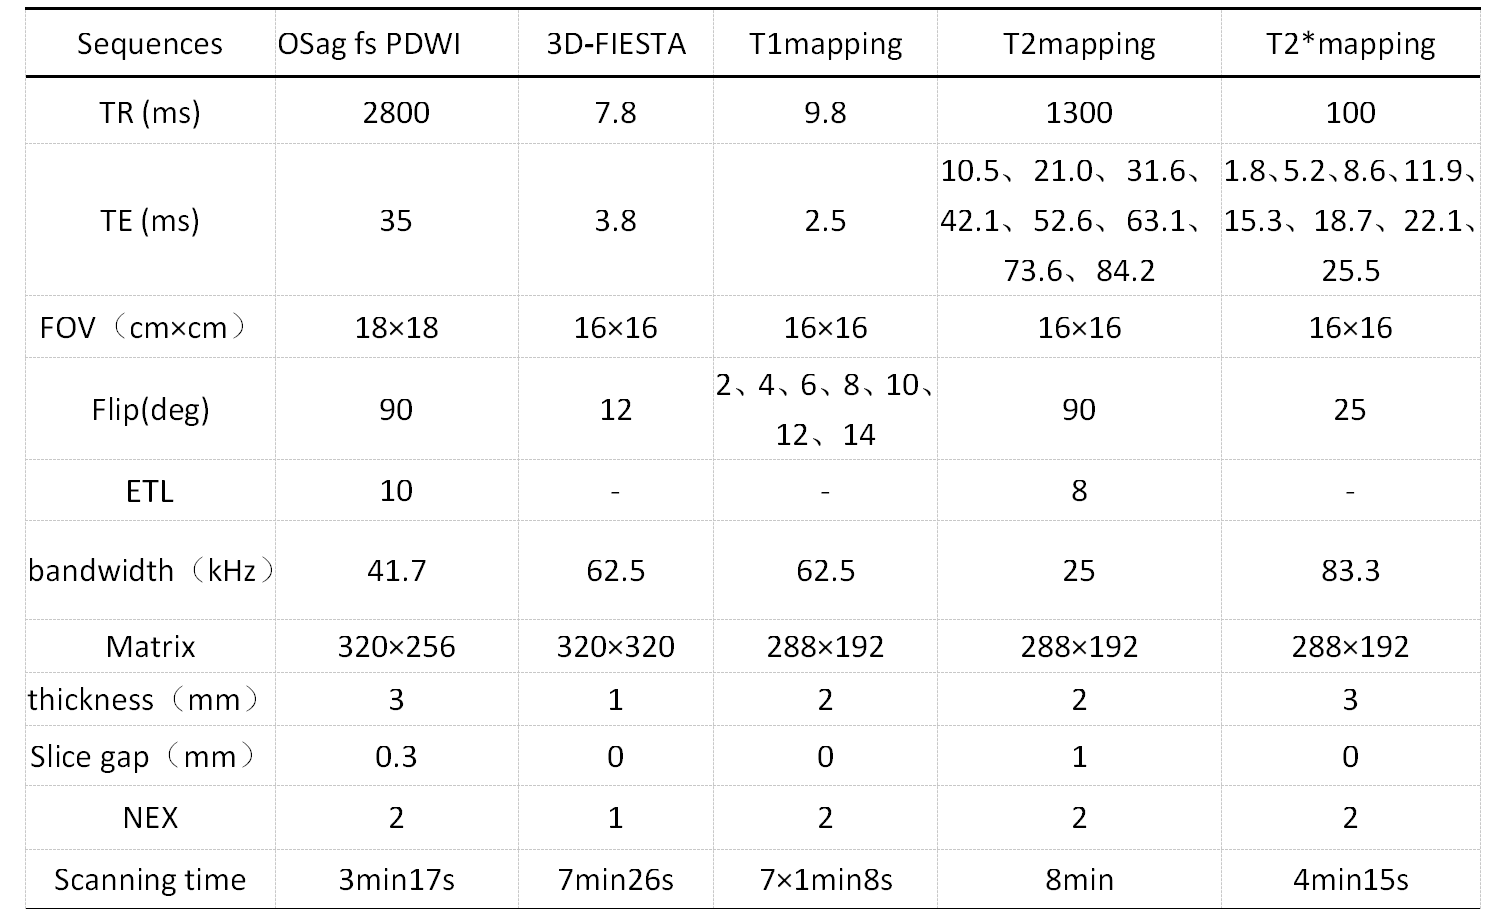
This study was approved by the institutional review board, and written informed consent was obtained from all patients. 91 patients who were scheduled to undergo arthroscopic treatment from March 2020 to April 2021 were enrolled prospectively.The ACL tissue from the lateral edge of the tibial end was taken during the operation examination. Basing on the arthroscopic morphology and pathological diagnosis result(Figure 1), some of them were divided into the group of the ACL-MD group (n=22;degeneration + : 16 , degeneration ++ : 6 ) and the ACL injury group (n=43;grade I, n = 8; grade II, n = 15; grade III, n = 20 ).All subjects underwent scanning on a 3.0 T MRI scanner(Discovery MR 750W, GE Healthcare, Waukesha, USA)before the knee joint surgery,Scan sequences and parameters were shown in Table 1.And the scanned images were post-processed to measure the T1, T2, and T2* values of the tibial end of the ACL. Two independent samples t-test and chi-square test of categorical variables were used for comparison between groups. Analysis of variance was used for multi-group comparison. The ROC curve was used to analyze the sensitivity, ficity, and optimal cutoff thresholds of ACL-MD + and ACL-MD ++. A P<0.05 was considered statistically significant.Results
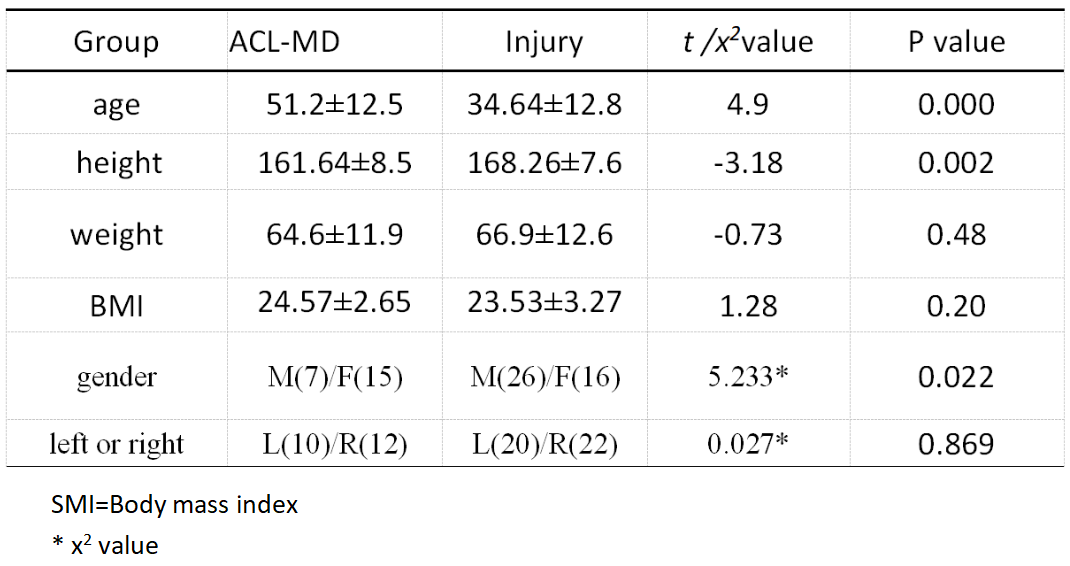
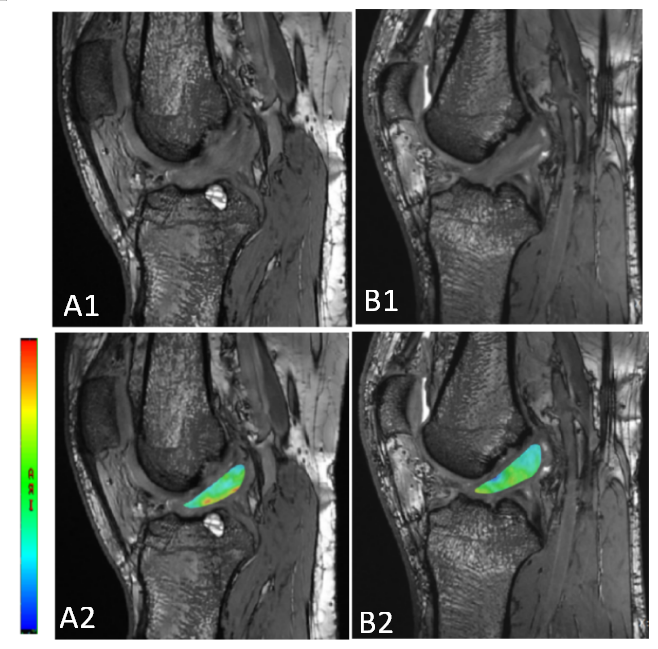
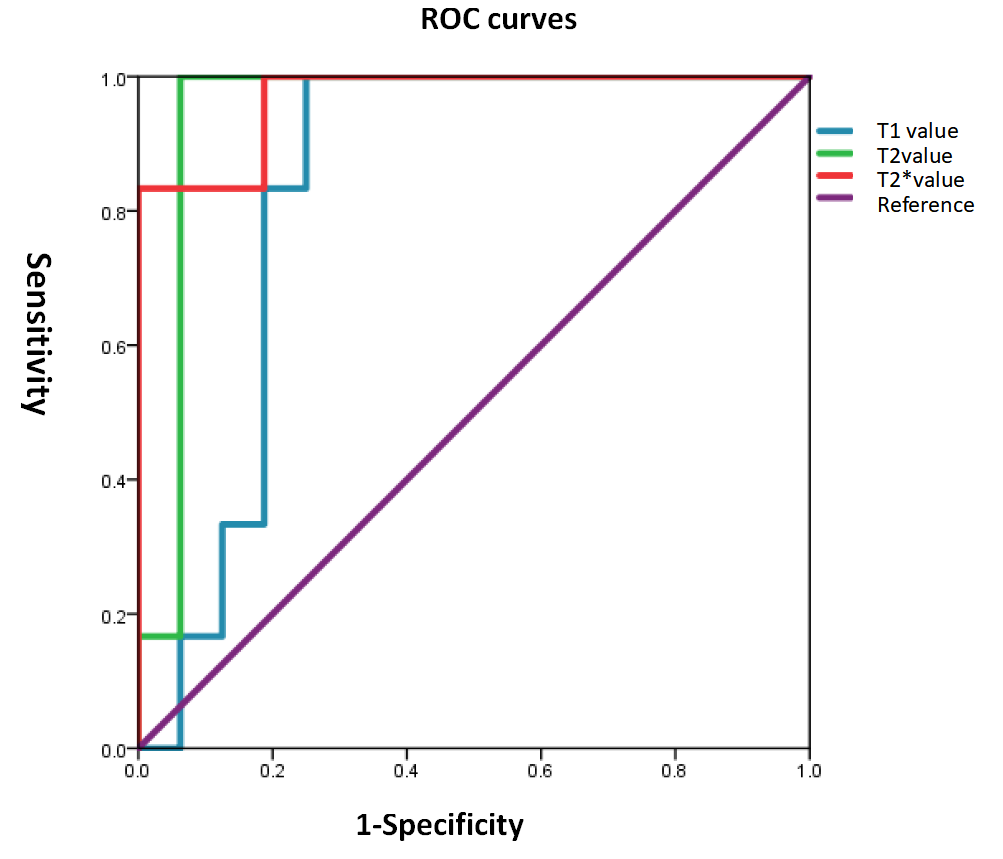
There were statistically significant differences in age, sex and height between the ACL-MD group and ACL injury group (t/x2 values were 4.9, 5.233, 0.027, all P <0.05). Comparisons of T1, T2, and T2* values between different groups are listed in Table 2.There were significant differences in T2* values between the ACL-MD and ACL injury groups(P< 0.05),and The T2* value of MD-ACL was higher than that of injured ACL(Figure 2).The T1, T2, and T2* values of ligaments in the ACL-MD ++ were (1556.1±141.4) ms, (64.2±3.6) ms, (33.97±6.7) ms, which were significantly higher than those in the ACL-MD + (1282.7±280.8) ms, (46.8±7.9) ms and (22.51±4.6)ms, and the difference was statistically significant (t values were -2.255, -5.065,-5.630, all P <0.05). Additionally, there were significant differences in T1 value between grade I and II injured ACL(P<0.05), and the same goes for T1 to evaluate grade I and III injured ACL. By drawing the ROC curve (Figure 3),T1, T2, and T2* had high sensitivity and specificity for identifying ACL-MD + and ACL-MD ++. The area under the ROC curve for the T1 values,T2 value and T2* value were 0.833,0.948and 0.969.And the best cutoff threshold of T1 value ,T2 value and T2* value were 1402.35,56.70 and 26.75. With a sensitivity of 100%, 100%, 100%, and specificity of 75.00%,93.70%,82.2%.Discussion and conclusion
ACL-MD and ACL injury are often mentioned together because of their similar findings on ordinary MRI (Figure 2). This study found that ACL-MD mainly occurred in middle-aged and elderly women, which was consistent with the results of Kim and Chas, studies [3-4], and it may be related to the decline of estrogen level after menopause.ACL injuries occur mainly in young men, which may be related to their higher frequency and intensity of exercise.At present, the recognition and severity assessment of the two disorders are mostly based on ordinary MRI. Quantitative MRI can reflect the minute changes in the chemical composition of the tissue, and quantitative values can be obtained by measuring the value [5].In this study, MRI was used to analyze the changes in the relaxation time of MD and injured ACL quantitatively and identify the grade of ACL injury and MD. The results demonstrated objective, quantifiable difference in T2* values between injury group and ACL-MD group. The mean values of T2* in ACL- MD group (26.3) was higher than injury group (22.3), which we suspected might be related to the deposition of new glycosaminoglycans[6]. Adam W. Anz et al. concluded that T2 relaxation values of ACL do not vary with age [7]and the T2* value is similar in principle to the T2 value [8]. The results demonstrated that QMRI parameters could quantitatively identify the grades of MD and injury of ACL. Additionally, the diagnostic efficiency of the T2* value for identifying MD grades preoperatively was better than T1 and T2 values. And for injury, T1 values could be used to identify the severity of ACL injuries.
Acknowledgements
No acknowledgement found.References
[1] Celikyay F, Yuksekkaya R, Bilgic E. A Retrospective Comparison of ACL Tear and Mucoid Degeneration MRI Findings and an Emphasis on Evaluating of ACL, Blumensaat, and PCL Angles[J]. J Belg Soc Radiol. 2020, 104(1):36.
[2] HasegawaA, OtsukiS, PauliC, et al. Anterior cruciate ligament changes in human joint in aging and osteoarthritis[J]. Arthritis Rheum, 2012, 64(3): 696–704.
[3] Cha JR, Lee OC, Cho SD, et al. Symptomatic mucoid degeneration of the anterior cruciate ligament [J]. Knee Surg Sports Traumatol Arthrosc,2013,21(3):658-663.
[4] Kim TH, Lee DH, Lee SH, et al. Arthroscopic treatment of mucoid hypertrophy of the anterior cruciate ligament [J]. Arthroscopy,2008, 24(6):642-649.
[5] Huang SY, Li XH, Huang L, et al. T2* Mapping to characterize intestinal fibrosis in crohn's disease [J]. J Magn Reson Imaging. 2018;10.1002/jmri.26022.
[6] HasegawaA, OtsukiS, PauliC, et al. Anterior cruciate ligament changes in human joint in aging and osteoarthritis[J]. Arthritis Rheum, 2012, 64(3): 696–704.
[7] Anz AW, Edison J, Denney TS, Branch EA, Walz CR, Brock KV, Goodlett MD. 3-T MRI mapping is a valid in vivo method of quantitatively evaluating the anterior cruciate ligament: rater reliability and comparison across age. Skeletal Radiol. 2020 Mar;49(3):443-452.
[8] Krepkin K , Bruno M , Raya, José G, et al. Quantitative assessment of the supraspinatus tendon on MRI using T2/T2* mapping and shear-wave ultrasound elastography: a pilot study[J]. Skeletal Radiology, 2017, 46(2):191-199.
Figures