3100
Acceleration of 3D Ankle Joint T2WI-SPAIR Images with Compressed SENSE to display the anterior talofibular ligament1Fuyang People's Hospital, Fuyang Anhui, China, 2Philips Healthcare, Beijing, China
Synopsis
Compressed SENSE(CS) is a new techonolgy that can be effective accelerat 3D acquisitions and reduce scan times.In this study ,we discuss the value of the compressed sensing technology’s three-dimensional MR to display the anterior talofibular ligament (ATFL), and compare the impact of different acceleration factors on imaging. We find that when the acceleration factor(AF) of CS is six, scan times was reduced by 60 percent without significant degradation of image quality.
Introduction
Magnetic resonance imaging (MRI) is the most accurate imaging method for diagnosing anterior talofibular ligament (ATFL) damage. In the meanwhile, 3D MRI can be reconstructed for multi-directional, multi-angle images displaying the precise positioning of subtle lesions for ATFL clearly. However, 3D MRI scanning time is so long that patients often cannot bear the pain keeping same position all the time. Compressed SENSE(CS) technology by changing the traditional Nyquist sampling technology, the use of digital random sparse sampling technology and iterative reconstruction, in order to ensure image quality at the same time, greatly shorten the scanning time[1]. In this paper, our aims to evaluate the value of CS technology with different acceleration factors to display ATFL by comparing CS-3D-ankle MRI with conventional ankle MRI.Method
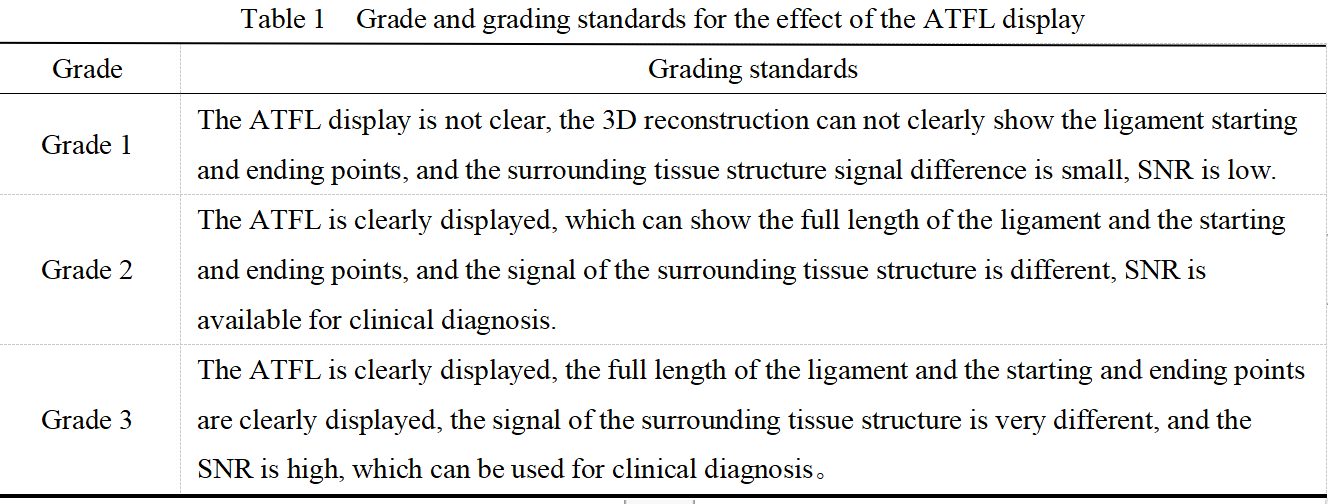
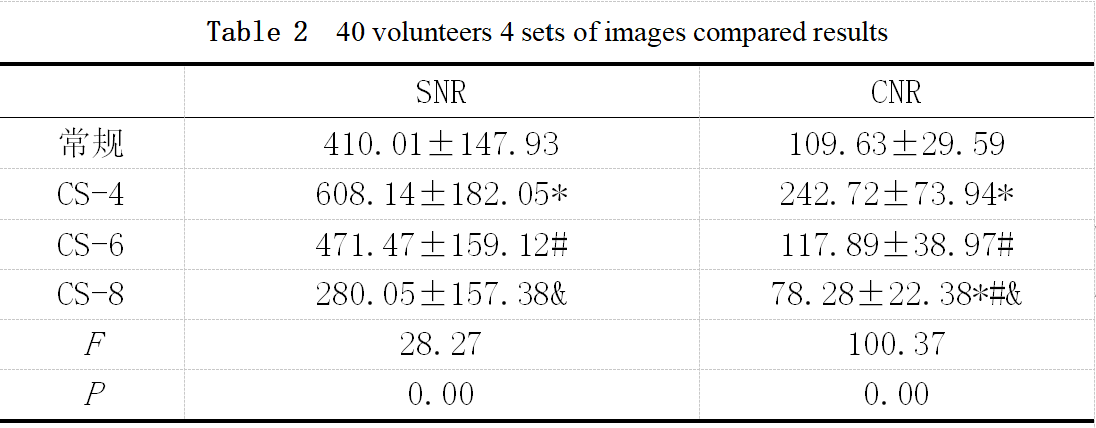
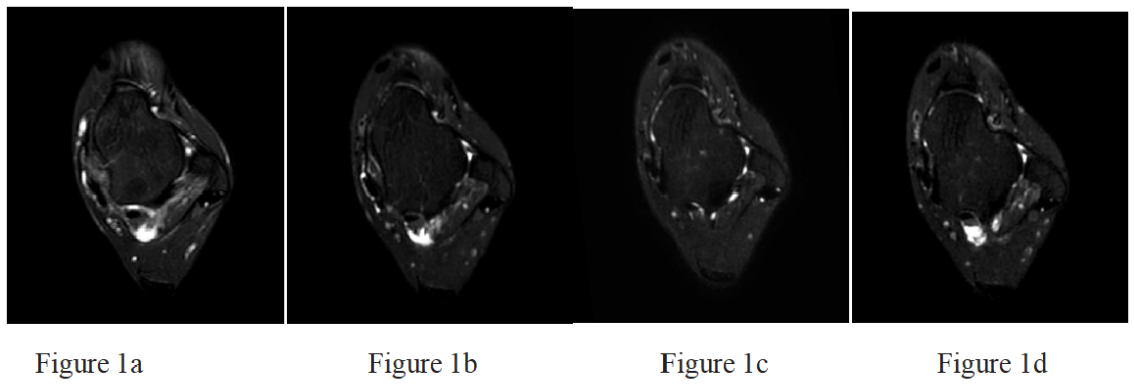
40 patients were recruited in the study. The upper ankle joints of each patient scanned by 3.0T MR(Ingenia CX; Philips Healthcare), including the conventional ankle joint scanning and different CS factors for 3D ankle joint scanning. Conventional ankle scan parameters: fsPDWI sequences of sagittal、coronal and transverse , TR 3600ms, TE 30ms, FOV 140mm× 119mm×79mm, voxel 0.6mm× 0.6mm×4mm; CS-3D-ankle scan parameters: sagittal view T2WI-SPAIR sequence, TR 1500ms, TE 231ms, FOV 160mm× 179mm×121mm, voxel 0.8mm×0.8mm × 0.8mm.According to different AF adopted by the CS technology, CS-4, CS-6 and CS-8 were chosen for study. Each patient provided four groups of images, the conventional ankle joint scanning images, CS-4, CS-6 and CS-8 scanning images respectively(the scan time is 8min14s、6min26s、4min20sand 3min14s respectively).Select the best plane from the ATFL to measure the signal-to-noise ratio(SNR) and contrast-to-noise ratio(CNR) as the objective evaluation(measure the signal strength mean SIATFL, the homography muscle signal strength mean SIM and the surrounding air mean signal strength SDN. The formula is as follows: SNR=SIATFL /SDN; CNR=(SIM-SIATFL) /SDN).The images were analyzed by two senior MR diagnosticians to assess the display effect of the ATFL as the subjective evaluation.Statistical analysis is performed using SPSS 20.0 software. The objective evaluation of the image using the one-factor variance analysis, the subjective evaluation using the Wilcoxon-signed rank sum test, and the Kappa coefficient is used to analyze the evaluation results of the reviewers consistently.The image quality was assessed by the subjective and objective analysis to evaluate the display effect of the ATFL.Results
The subjective assessment by two senior MR diagnosis doctors about the image quality showed a high consistency (k=0.91, p<0.001). Two reviewers were invited to conduct the Wilcoxon-signed rank sum test of the subjective scoring average of the CS image group and conventional image group. Results showed that the image quality assessment differences between the CS-6 group and the conventional group were not statistically significant (Z1=0.38, p=0.29), but the image quality assessment differences between the CS-8 group and the conventional group were statistically significant (Z2=5.46, p<0.01). Objective assessment results suggested the SNR of the CS-4 group was the highest (p<0.05), and that the CNR differences between the CS-6 group and the conventional group were not statistically significant.Discussion
CS combined 3D ankle MR imaging can be reconstructed for multi-directional, thin-layer reconstruction to meet diagnostic needs for. And when the AF of CS is six, scan times was reduced by 60 percent without significant degradation of image quality. As the AF increases,the scan time is further reduced and the,image quality reduction because the CS technology K space undersampling resulting in more data loss[2]. The shortcomings of this study are small sample size and this group of volunteers from the ATFL no damage,we need to further expand the sample size and to explore whether it can be applied in patients with ATFL damage,in the future.Conclusion
Compressed SENSE can be applied to scan for upper 3D ankle joint at 3.0T MRI. When the AF of CS is six, the ATFL can be clearly displayed, meanwhile, the scanning time can be effectively shortened.Acknowledgements
No Acknowledgements found.References
[1] Candès E J, Romberg J , Tao T . Stable Signal Recovery from Incomplete and Inaccurate Measurements[J]. Commun Pure Appl Math,2006,59(8):1207-1223.
[2] Sanders J W,Song H,Frank S J,et al.Parallel Imaging Compressed Sensing for Accelerated Imaging and Improved Signal-to-Noise Ratio in MRI-Based Postimplant Dosimetry of Prostate Brachytherapy.Brachytherapy[J],2018,17(5):816-824 .
Figures