3099
Monitoring changes of Achilles Tendon in amateur Marathon athletes by using component Analysis UTE-T2* technology: a preliminary study1Department of Radiology, Fifth Affiliated Hospital, SUN Yat-Sen University, Zhuhai, China, 2Department of Radiology, University of California, San Diego, CA, United States
Synopsis
Long-distance running is a common cause of Achilles tendinopathy. A fast, reliable, and non-invasive magnetic resonance imaging (MRI) technique to track the early changes in tendon is of critical importance for effective clinical intervention and evaluation that can prevent the progression of Achilles tendinopathy. This study aims to evaluate UTE-T2* in the detection of changes in the Achilles tendons of amateur marathon runners before and after long-distance running.
INTRODUCTION
The Achilles tendon demonstrates low or no signal when imaged using conventional clinical MRI sequences due to its short transverse relaxation time[1]. Consequently, Achilles tendon diseases can only be diagnosed with clinical sequences when morphological changes produce an increased signal (e.g. rupture, thickening). Quantitative assessment of the affected biochemical components in tendon could therefore be a potentially useful tool that facilitates more effective and time-sensitive interventions to combat the progression of Achilles tendinopathy. This study aims to explore the value of component Analysis UTE-T2∗ technology on detecting structure changes and dynamic quantitatively monitoring of amateur marathon athletes' Achilles tendon before and after the marathon.METHODS
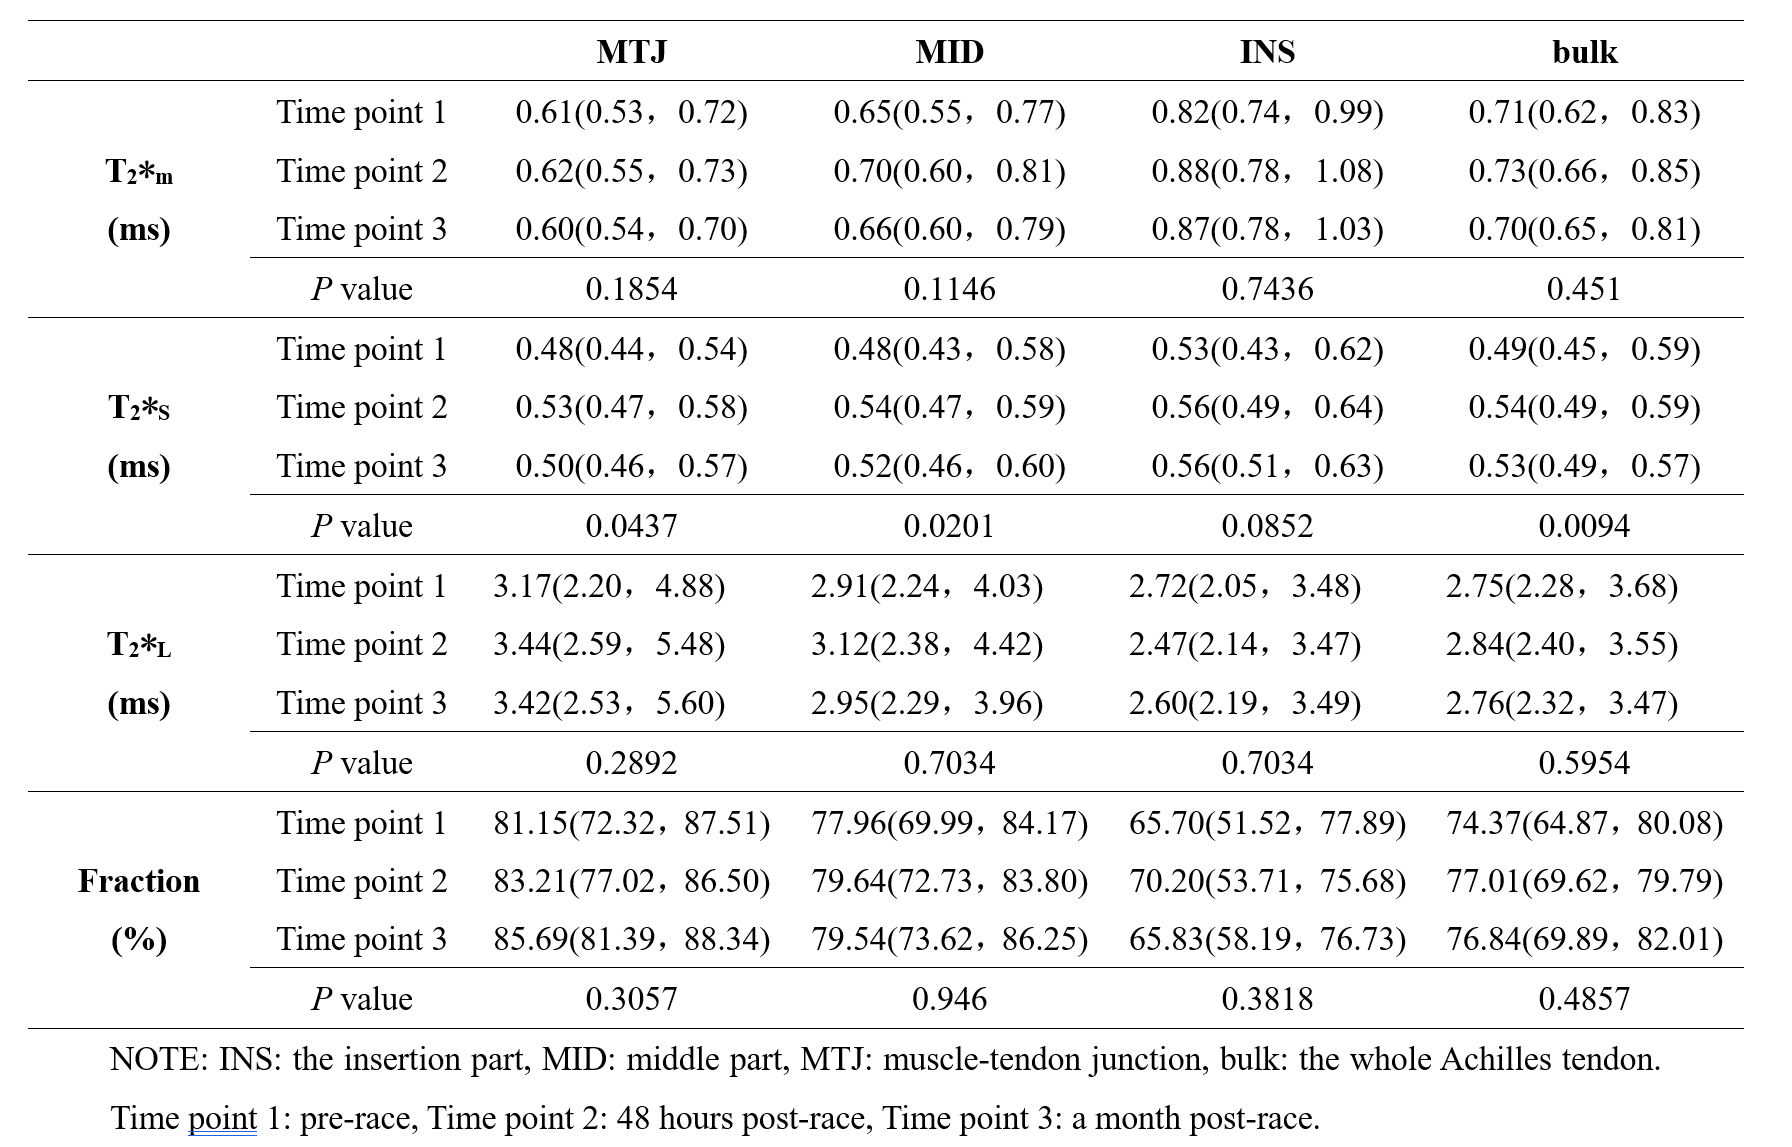
29 amateur marathon runners were prospectively recruited. The component analysis UTE-T2∗ sequence scans were performed at three different time points for each subject: (1) pre-race, (2) 48 hours post-race, and (3) a month post-race. Morphological observation of the Achilles tendon was performed in different TE sequences. Based on the sagittal position, two radiologists independently delineated the ROIs in the Achilles tendon and measured the 3 sub-segments of the Achilles tendon (muscle-tendon junction, middle, and insertion) and the entire Achilles tendon to obtain T2∗m、T2∗S, T2∗L, and Fraction values.Two-way mixed intraclass correlation coefficient (ICC) was used to assess the measurement reliability between the two raters. The UTE-T2∗m, T2∗S, T2∗L, and Fraction values of Achilles tendon at three time points were compared by Friedman M test, the values with statistical differences were compared by the corrected Bonferroni method. Wilcoxon rank-sum test was used to compare the difference before and after running with different running postures.RESULTS
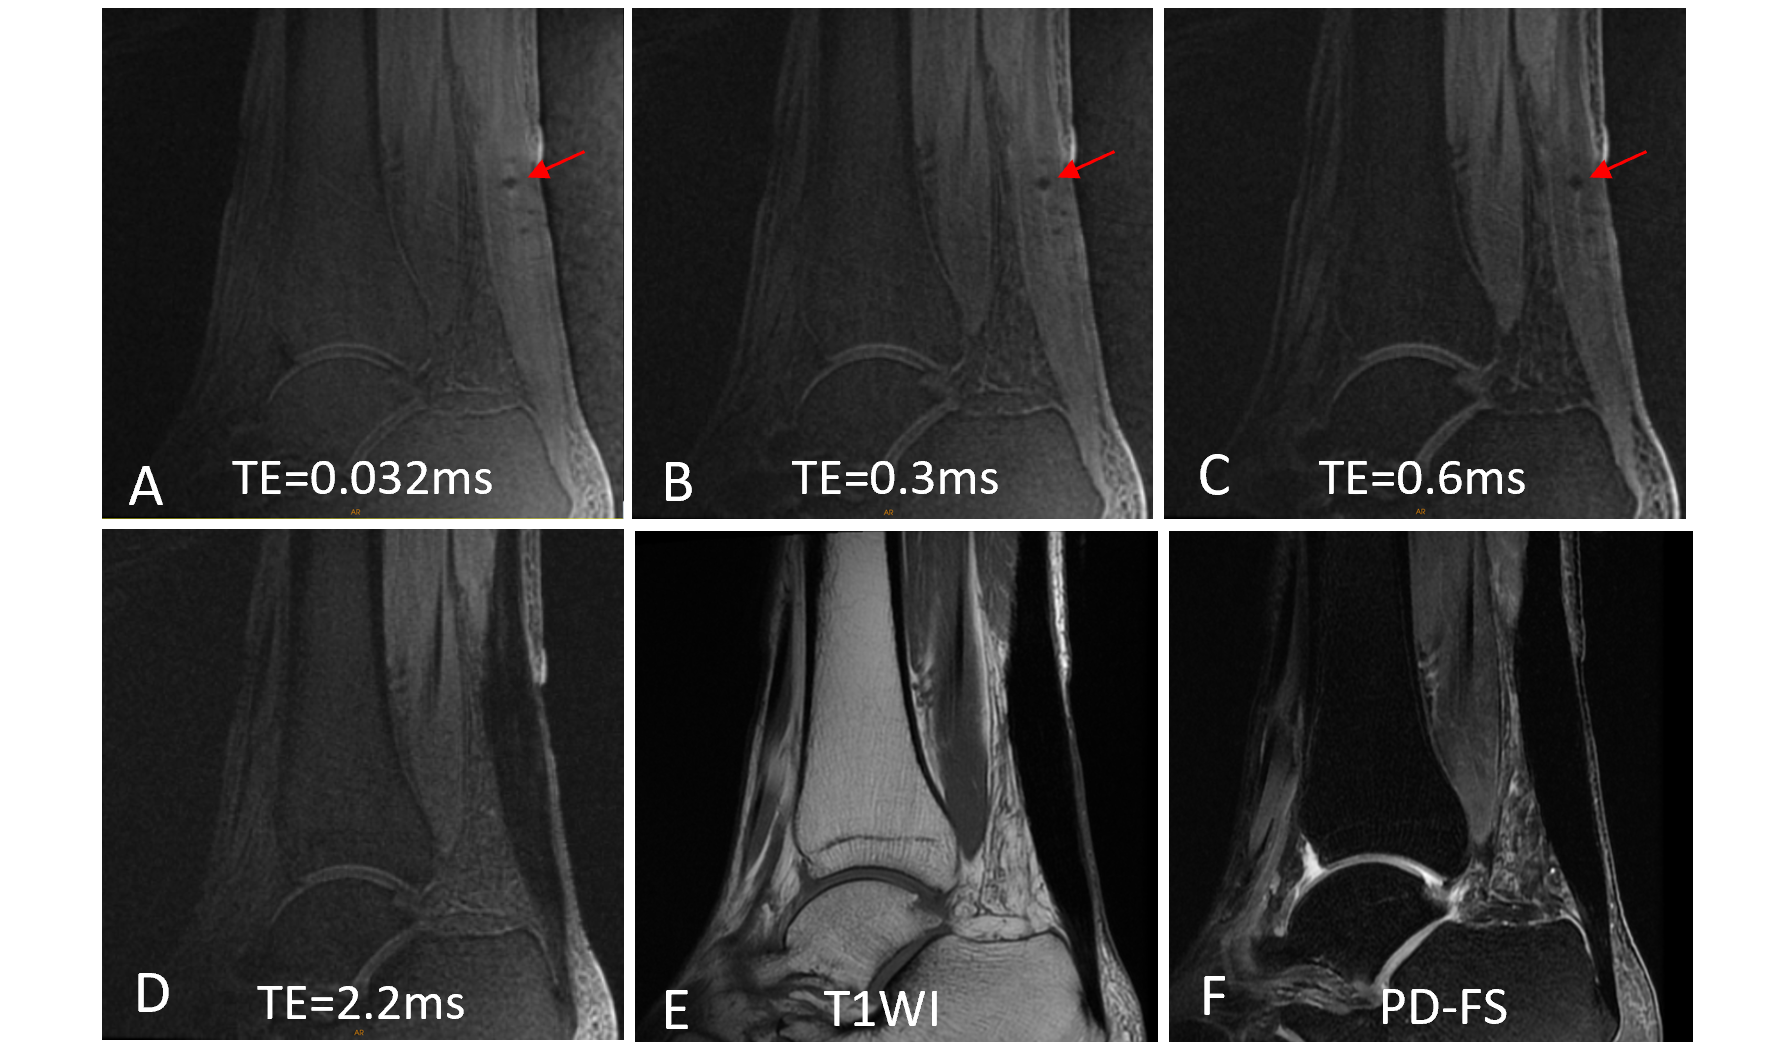
The two radiologists had good consistency in measuring the T2∗m, T2∗S, T2∗L and Fraction values of the Achilles tendon, and the ICC values were 0.957, 0.941, 0.828, and 0.937. In the sequence of short TE (TE≤0.6 ms), the diffuse high signal area appears scattered in the dotted low signal area(figure 1).The T2∗m, T2∗S and T2∗L values of all areas of the Achilles tendon increased to varying degrees at 48 hours after marathon exercise, and showed a decreasing trend after a month of exercise(figure 2&3). Where T2∗s was significantly higher in the Achilles tendon as a whole, in the muscle-tendon junction and middle segment at 48 h post-race compared to pre-race, all P < 0.05.DISCUSSION
In this study, we investigated the feasibility of using quantitative UTE- T2* imaging to assess changes in the Achilles tendon of 29 amateur marathon runners before and after long-distance running. The Achilles tendon showed high signal intensity on the TE ≤ 0.6ms sequence of UTE, which could show the scattered spot-like low signal intensity in the diseased Achilles tendon, which is superior to traditional magnetic resonance imaging. In this study, it was found that there were varying degrees of increase after marathon, and gradually returned to the pre-race state after exercise recovery for more than one month. The difference of T2*s was statistically significant, which was more sensitive to reflect the biochemical changes of Achilles tendon before and after exercise than the single-component analysis of UTE and T2 *L of two components. The early stage of Achilles tendinopathy can be characterized by the upregulation of large proteoglycans, and an increase of inbound water[3]. When the structure of collagen fiber network was destroyed, the surface area of exposed collagen fibers expanded, the short T2 water bound to collagen increased relatively, so the short components of UTE-T2 fibers reflected the changes of Achilles tendon in the early stage. The changes of tendon connection segment and middle part of Achilles tendon are more obvious than that of insertion segment of Achilles tendon. The middle part of the Achilles tendon is of special interest because this region is relatively low in blood supply. As a result, tendon diffuse swelling, edema, tenderness, or rupture are not only more likely to occur in this region, but injuries are relatively slower to repair than other areas in the tendon[4, 5].CONCLUSION
The Bi-component Analysis UTE-T2∗ technology is superior to single component analysis in monitoring the dynamic changes of Achilles tendon before and after exercise, and T2∗S is more sensitive to subtle changes in chemical composition of Achilles tendon.Acknowledgements
No acknowledgement found.References
[1] Du Jiang, Bydder Mark, Takahashi Atsushi M., et al. Two-dimensional ultrashort echo time imaging using a spiral trajectory[J]. Magnetic Resonance Imaging, 2008, 26(3): 304-312. DOI: 10.1016/j.mri.2007.08.005
[2] Wijesekera Nevin, Calder James, Lee Justin. Imaging in the assessment and management of achilles tendinopathy and paratendinitis[J]. Seminars in Musculoskeletal Radiology, 2011, 15(01): 089-100. DOI: 10.1055/s-0031-1271961
[3] Cook J. L., Purdam C. R. Is tendon pathology a continuum? A pathology model to explain the clinical presentation of load-induced tendinopathy[J]. Br J Sports Med, 2009, 43(6): 409-416. DOI: 10.1136/bjsm.2008.051193
[4] Chiodo C. P., Wilson M. G. Current concepts review: acute ruptures of the achilles tendon[J]. Foot & ankle international, 2006, 27(4): 305-313. DOI: 10.1177/107110070602700415
[5] Chen Tony M., Rozen Warren M., Pan Wei-ren, et al. The arterial anatomy of the Achilles tendon: Anatomical study and clinical implications[J]. Clinical Anatomy, 2009, 22(3): 377-385. DOI: 10.1002/ca.20758
Figures