3096
Dynamic T2 mapping of human skeletal muscles via multiple overlapping-echo detachment planar imaging1Department of Electronic Science, School of Electronic Science and Engineering, Xiamen University, Xiamen, Fujian, China, 2Center for Brain Imaging Science and Technology, College of Biomedical Engineering and Instrumental Science, Zhejiang University, Hangzhou, Zhejiang, China, 3MSC Clinical & Technical Solutions, Philips Healthcare, Shenzhen, Guangdong, China, 4Department of Imaging Science, University of Rochester, Rochester, NY, United States
Synopsis
Magnetic resonance (MR) parametric mapping and MR dynamic imaging are both valuable clinical tools. Nevertheless, quantitative imaging and high time resolution usually cannot be achieved simultaneously with conventional dynamic MR imaging methods. Herein, the multiple overlapping-echo detachment imaging (MOLED) method with short echo time (TE), dubbed MOLED-short, is proposed to fetch the dynamic variation of T2 value on in vivo extremities with high temporal resolution (about 110 ms). The robustness of MOLED-short was demonstrated. MOLED-short can capture immediate T2 changes of muscles and may provide new insights into the metabolic responses of musculatures to human activities.
Introduction
The transverse relaxation time (T2) of skeletal muscles is a robust biomarker in disease assessments, particularly in dystrophies, inflammatory myopathies, muscle edema, and fibrosis, and the dynamic process of muscle T2 provides relevant information about neuromuscular disorders and exercise effects.1-4 In this work, the single-shot T2 mapping method based on multiple overlapping-echo detachment imaging (MOLED),5 is applied for the quantitative dynamic imaging of the skeletal muscle through echo time (TE) optimization. Compared with the original method (MOLED), this method, dubbed MOLED-short, yields more accurate muscle images and refined details in phantom and in vivo experiments due to its better signal-to-noise ratio (SNR) efficiency and unsymmetrical k-space distribution.Methods
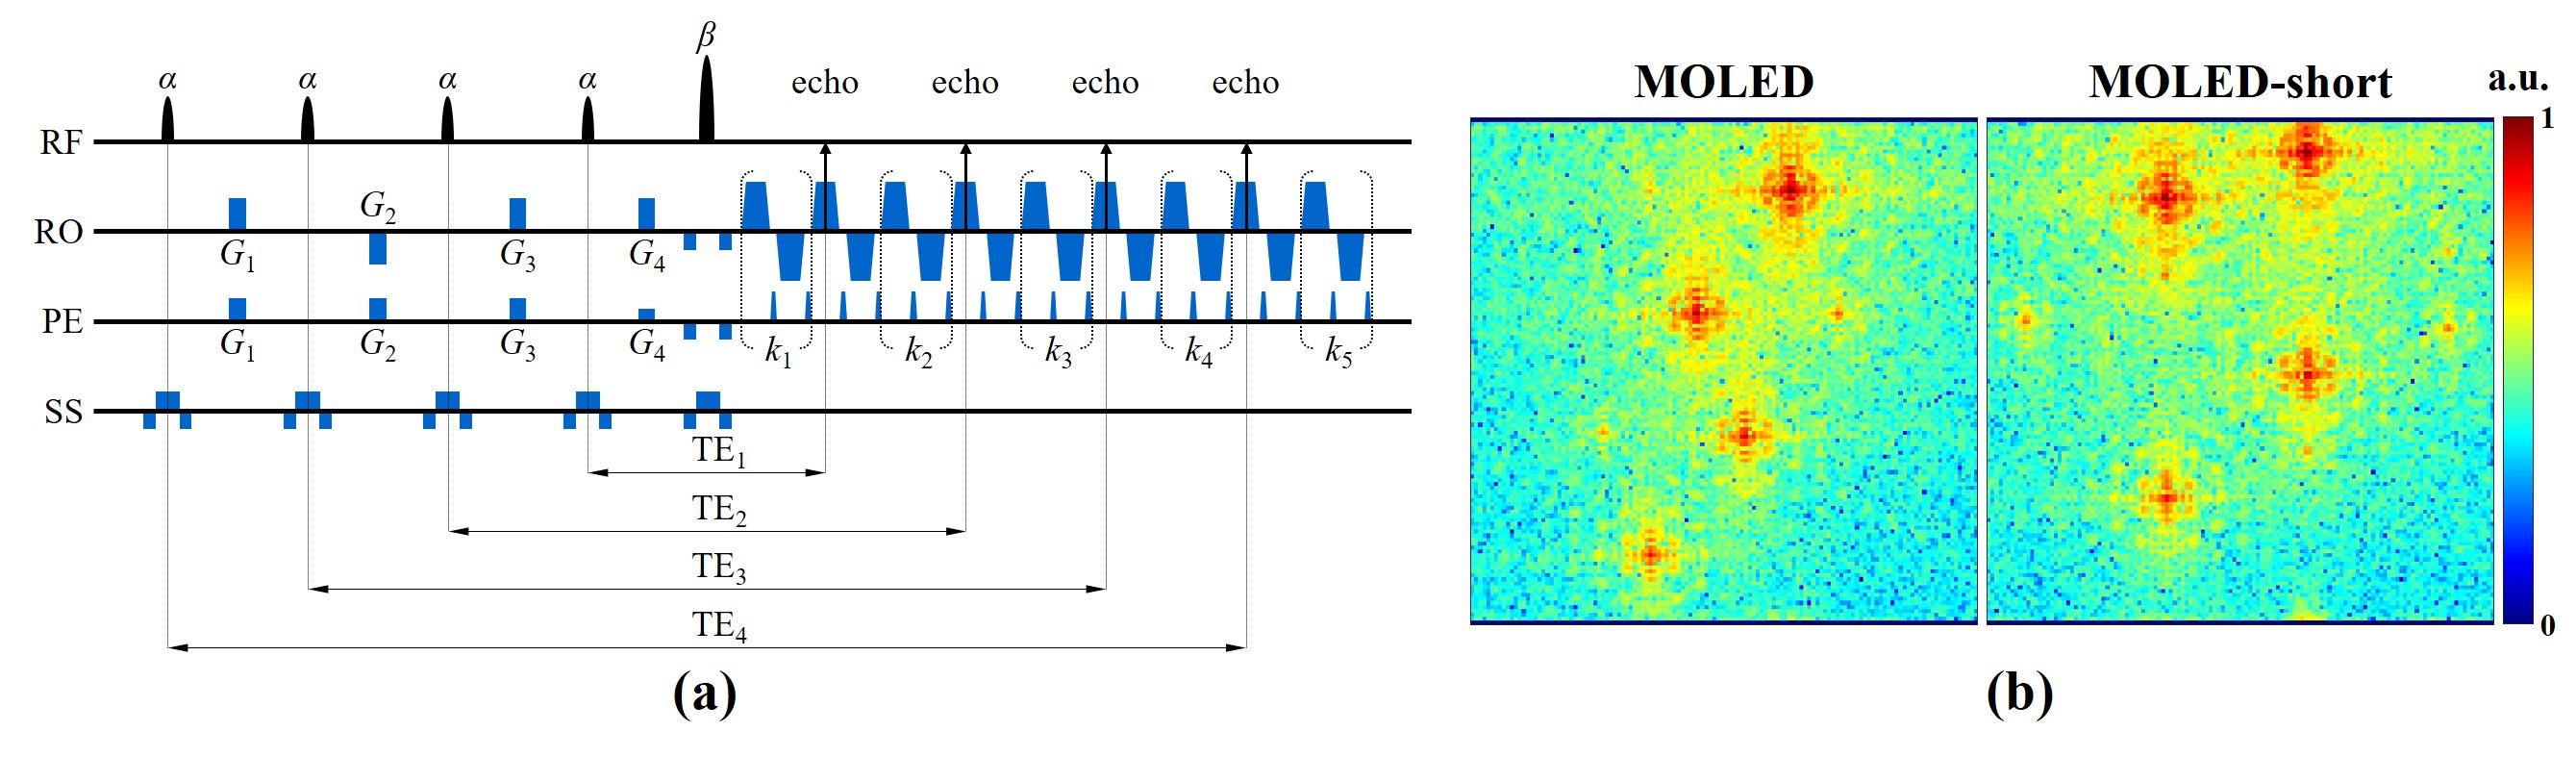
Sequences and scanner: The pulse sequence of MOLED-short is illustrated in Figure 1a, where four α-angle excitation pulses with four shifting gradients (G1, G2, G3, and G4) are followed by a β-angle refocusing pulse and an echo-train. α = 30°, β = 180°, and k1 + k2 + k3 + k4 + k5 + 8 = K, where K is the number of phase-encoding steps. The k-spaces of MOLED and MOLED-short are displayed in Figure 1b, respectively. A 3T whole-body MRI system with a head/knee coil (MAGNETOM Prisma, Siemens Healthineer, Erlangen, Germany) was engaged to acquire phantom/in vivo data.Phantom/static in vivo experiments: Experimental parameters for both were: field of view (FOV) = 22 × 22 cm2, sampling matrix = 128 × 128, slice thickness = 7.5 mm (3.0 mm for the phantom), TR = 8.0 s, and GRAPPA factor = 2. Under the acquisition bandwidth of 1302 Hz/Px, the four smallest TEs were about 14, 25, 65, and 94 ms for MOLED-short and 22, 52, 82, and 111 ms for MOLED. The scan time per slice was 110 ms for MOLED-short and 119 ms for MOLED. All reference T2 maps were obtained through spin-echo (SE) images with five TEs (15, 30, 45, 60, and 75 ms) under TR = 2.0 s, and the total scan time was 19 min. The detail of the reconstruction process can be found in our previous paper.5
Dynamic experiments: The experiment was conducted on a healthy male volunteer who was scanned immediately after vigorous squats. The experimental parameters were identical to those used in the static experiment. A long TR of 32 s allowed for tissue recovery, and the acquisition duration was 48 min. No reference maps were obtained due to the incapability of SE imaging in dynamic monitoring.
Results
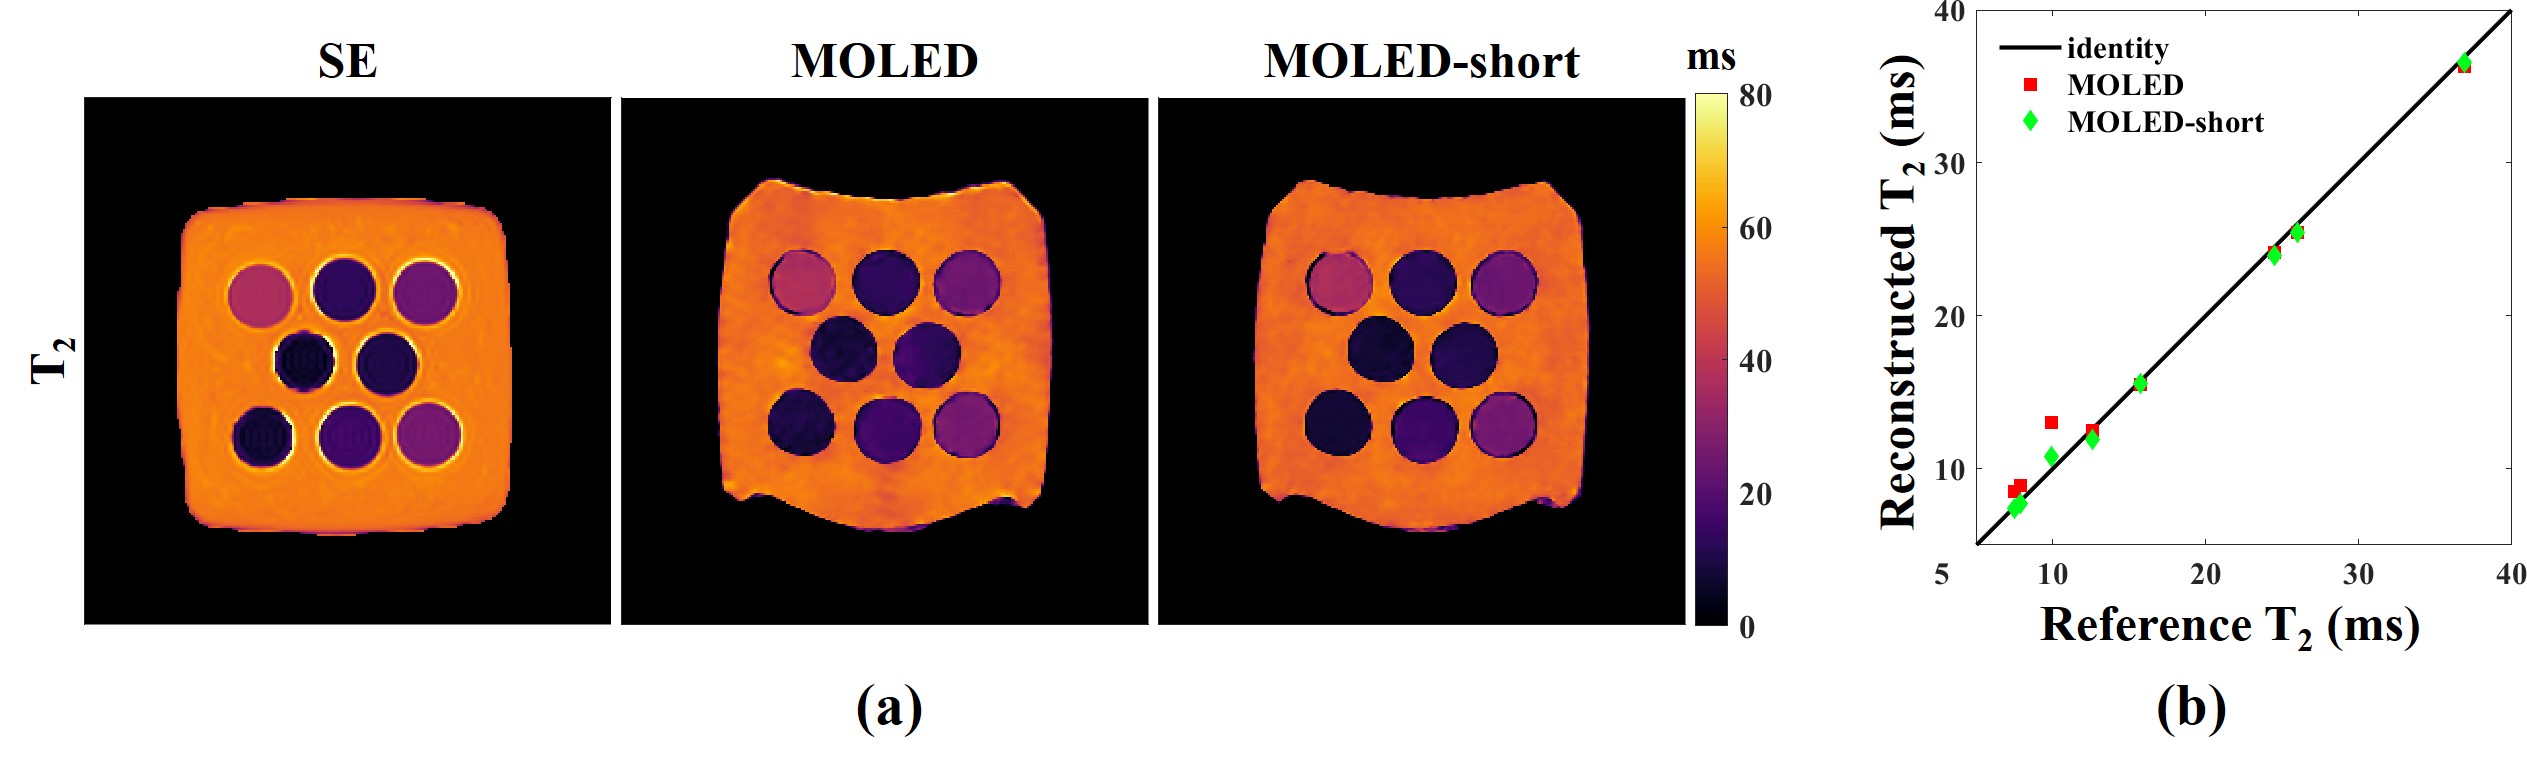
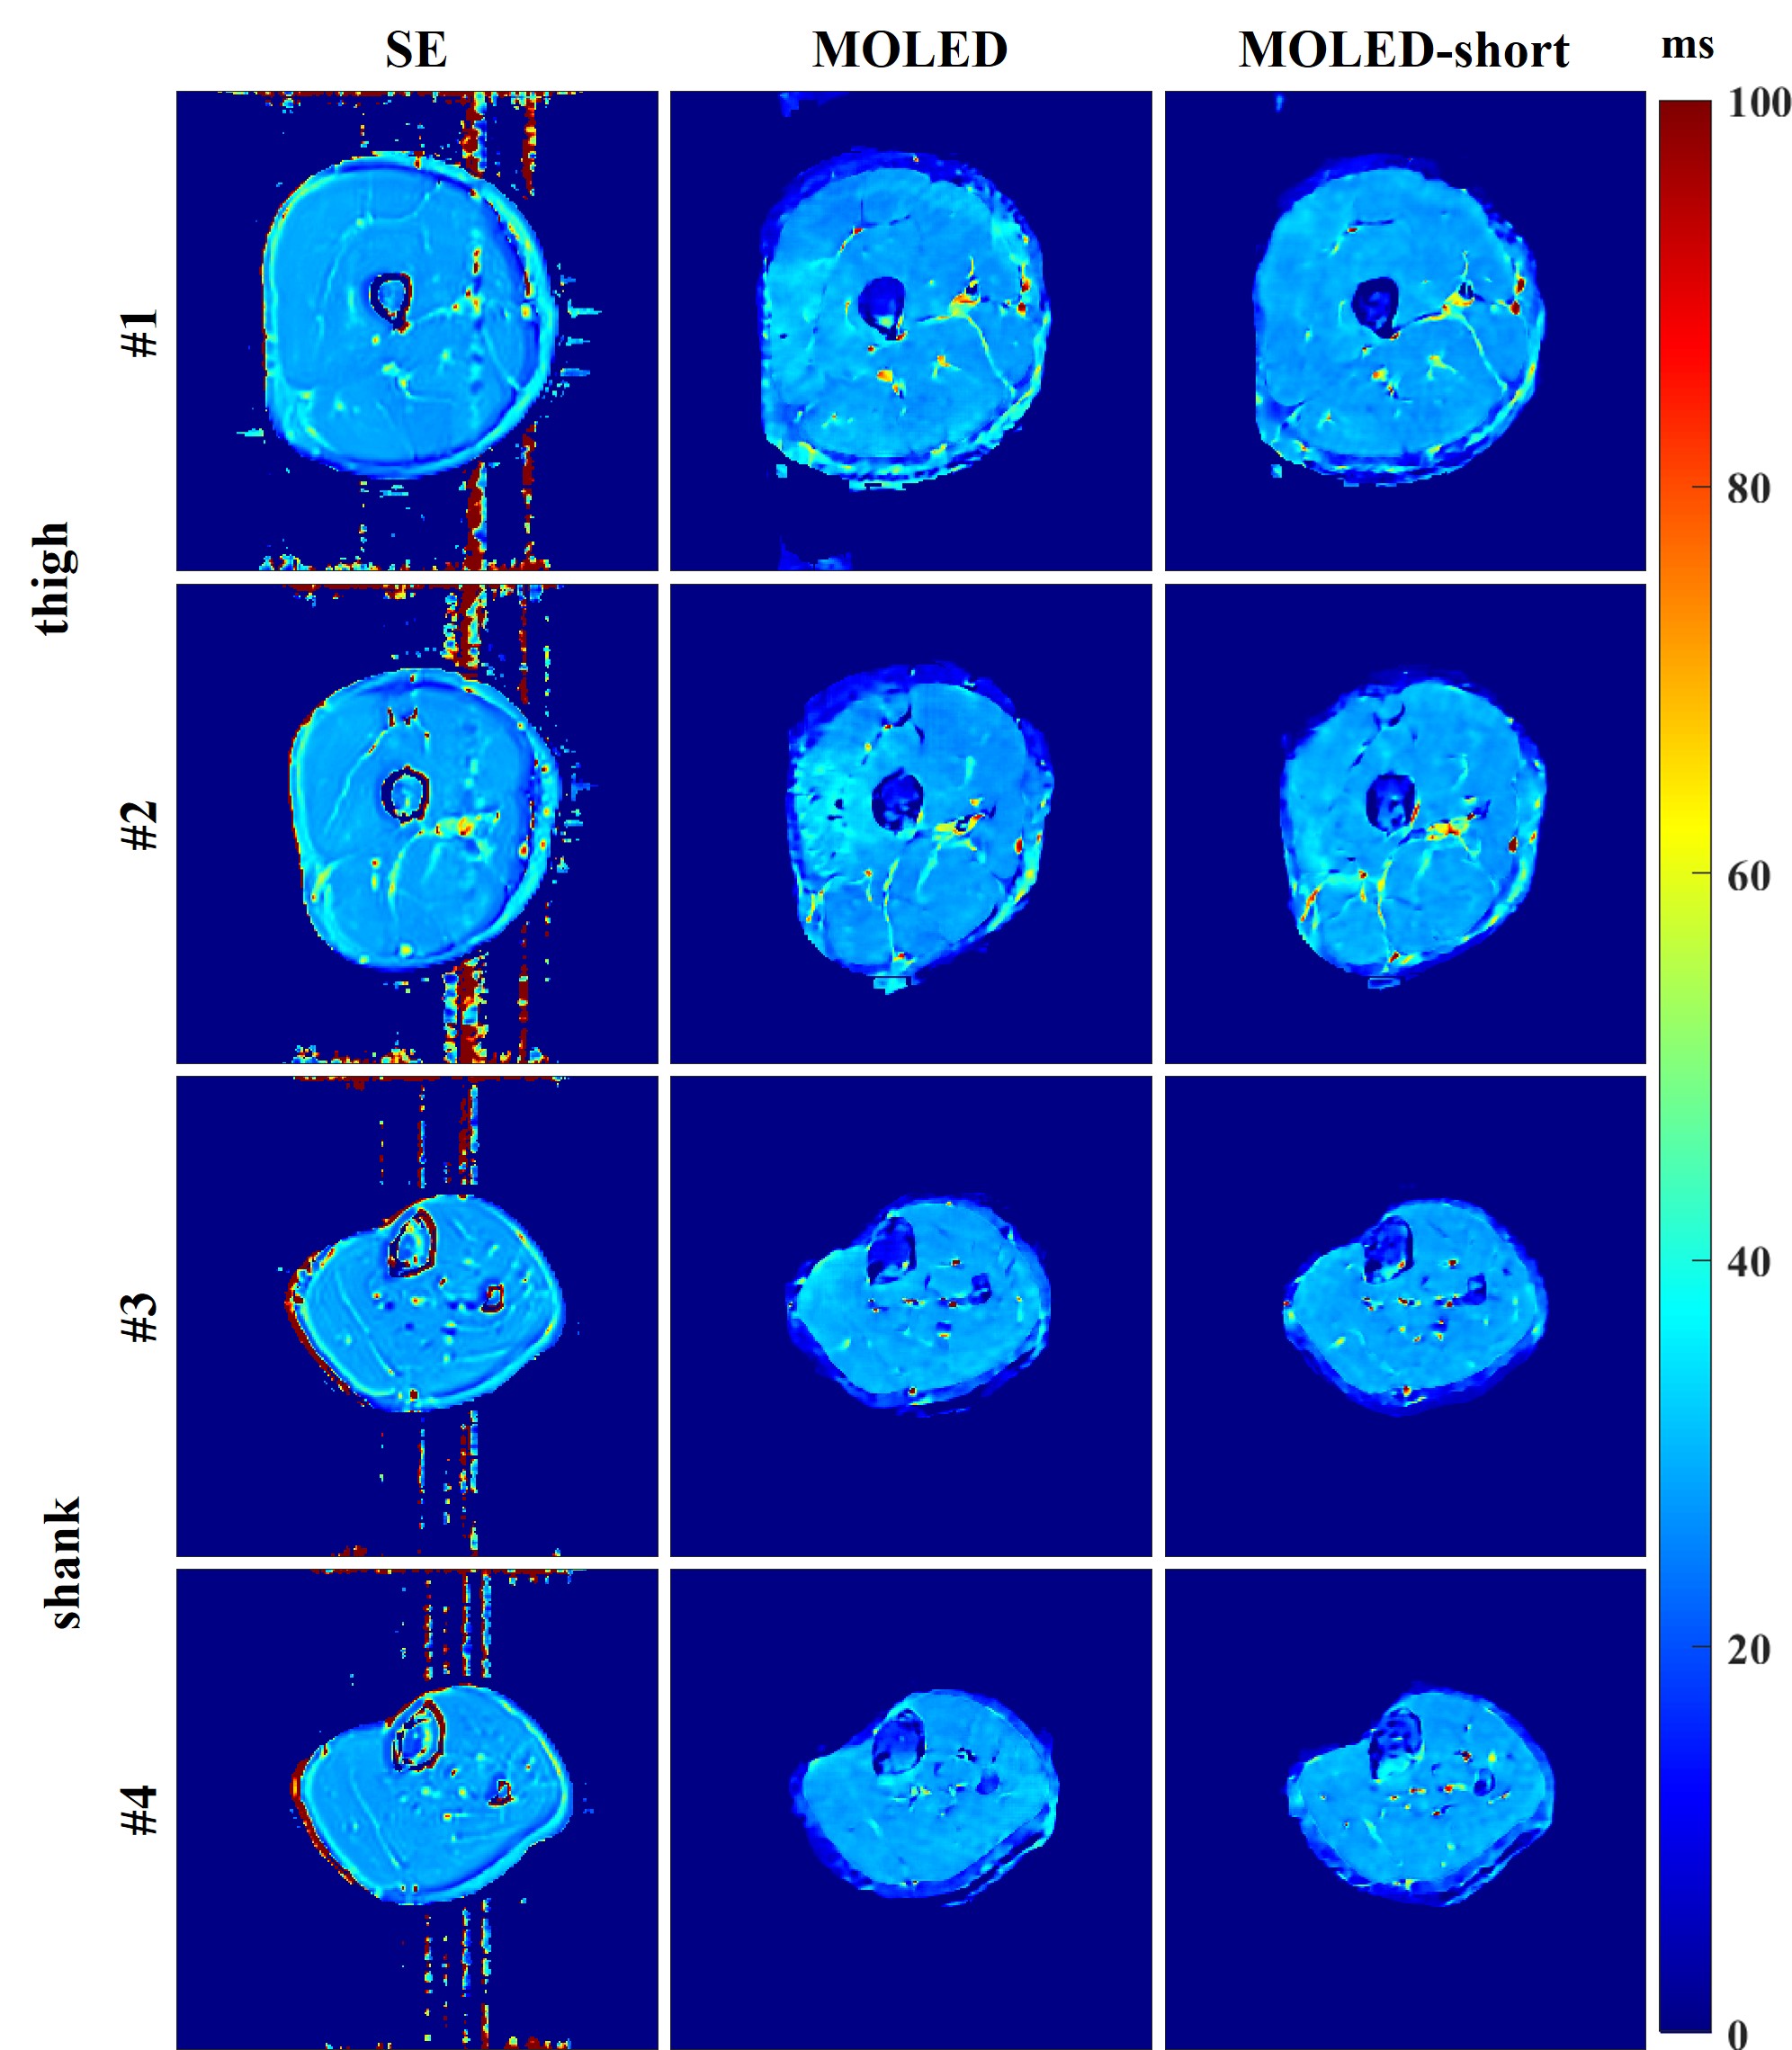
The results of the phantom experiments are displayed in Figure 2. The comparison reveals the advantage of the MOLED-short method in the measurement of small T2, which is embodied in the smoother surface (Figure 2a) and the unbiased accuracy (Figure 2b). The Pearson’s correlation coefficient of the T2 accuracy is 0.9955 for MOLED and 0.9992 for MOLED-short.Figure 3 displays the results of the static in vivo experiments. Inevitable flow artifacts, which may impede its diagnostic value, arise in the reference T2 maps due to long scan time, which is however avoided in the two single-shot methods. Compared with the MOLED, the MOLED-short yields more accurate results with refined details of skeletal muscles.
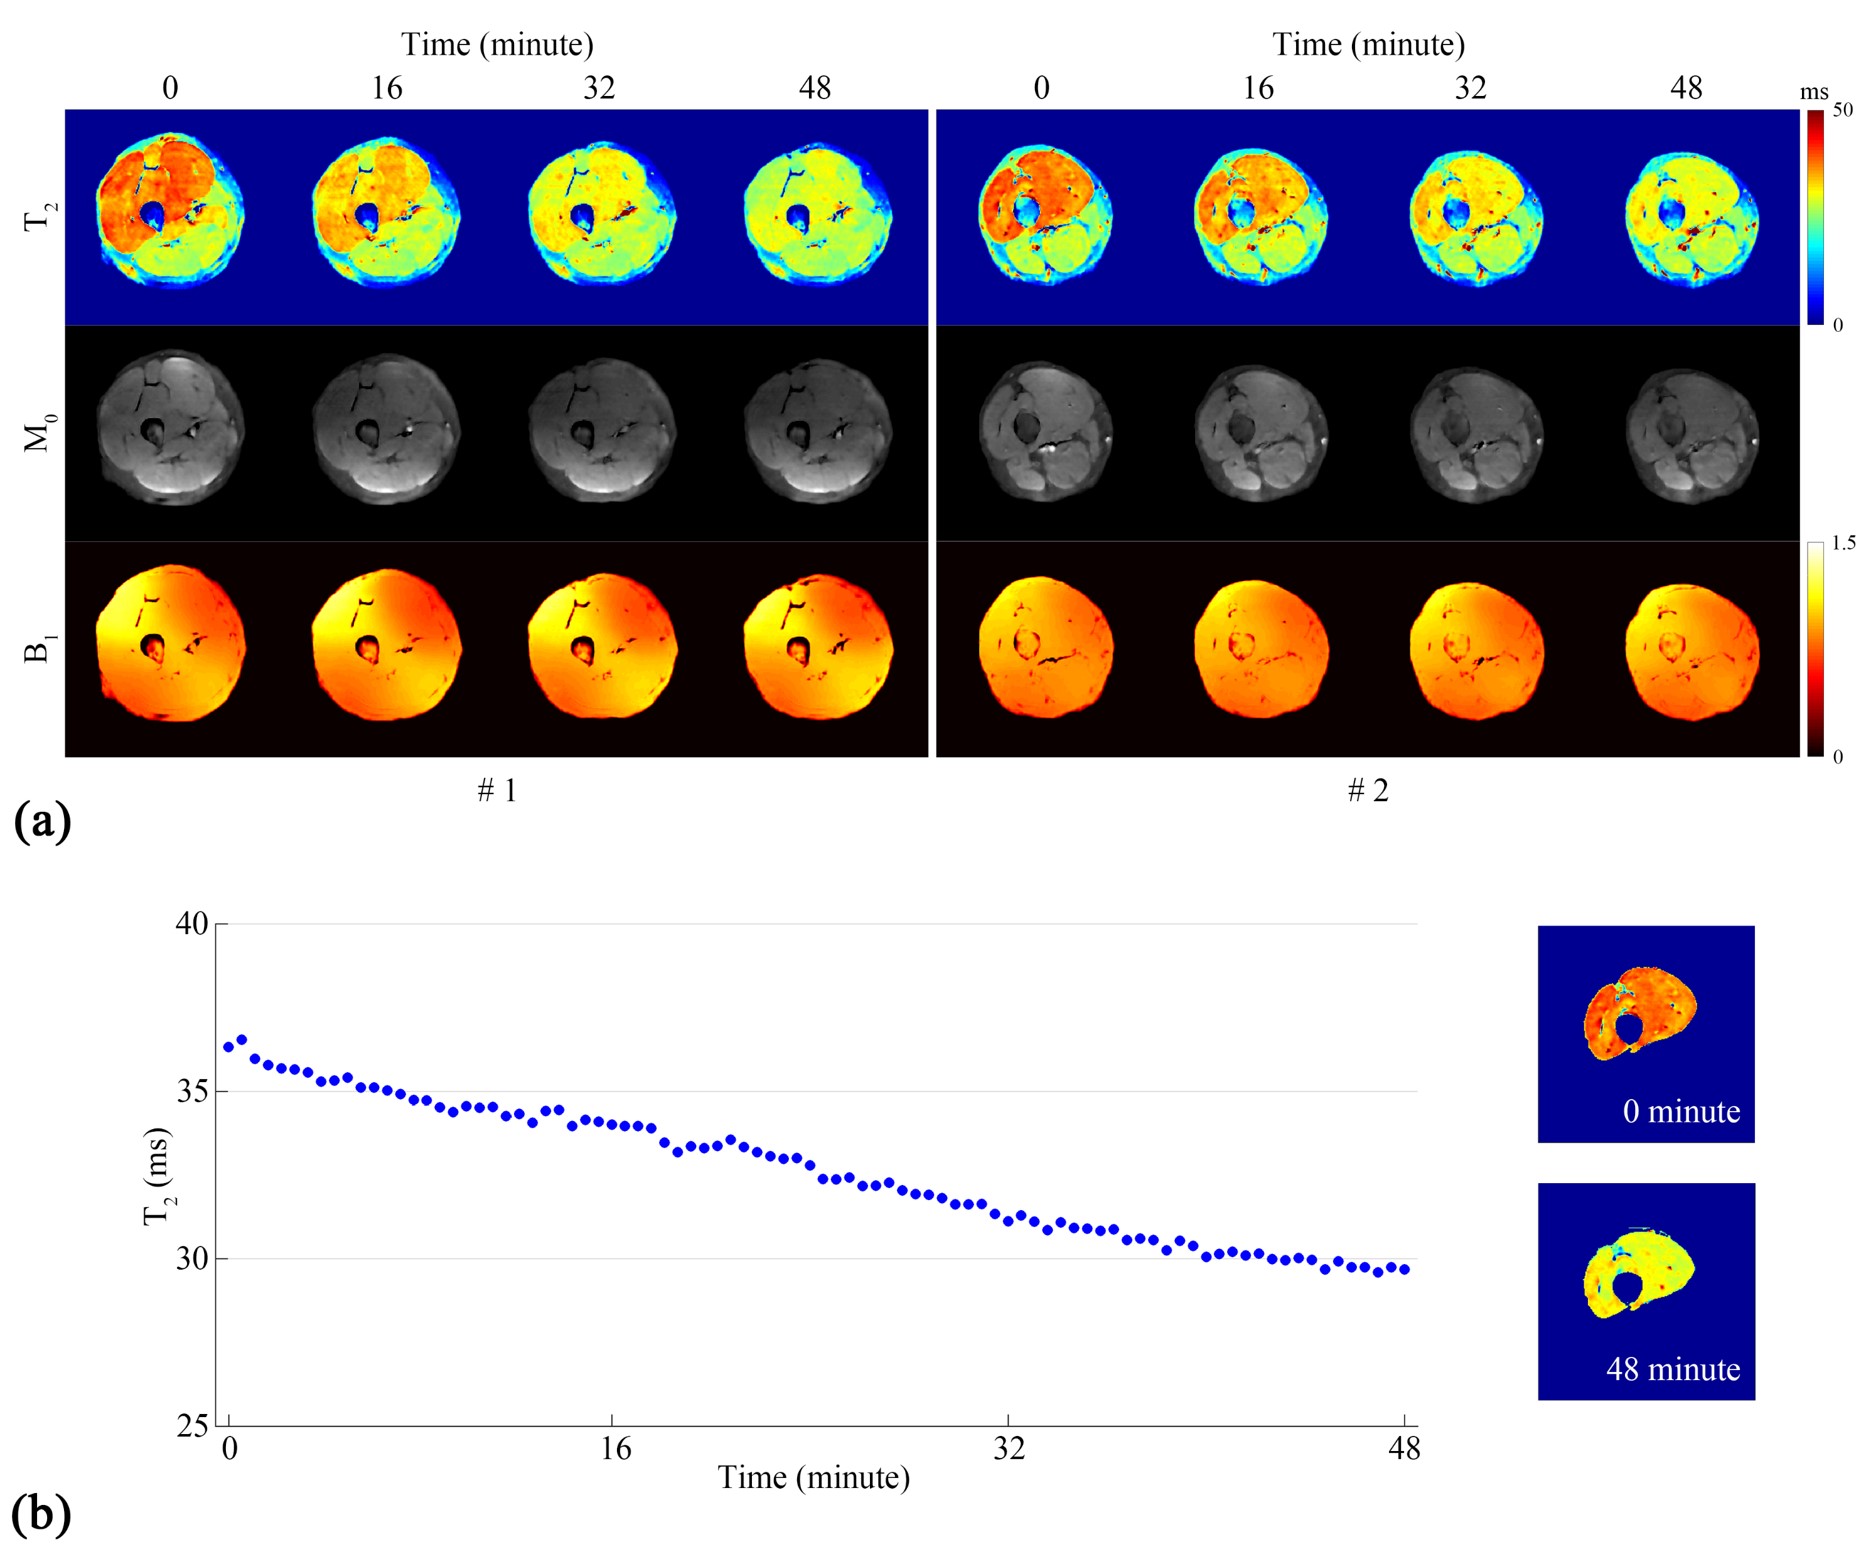
The results of the dynamic in vivo experiment are shown in Figure 4. A high signal at the top and bottom of the M0 maps shows up at the 0th minute due to B1- effects caused by muscle dilation and squeeze of thigh muscle after vigorous squats. In the T2 maps, the T2 of the quadriceps is relatively high initially and gradually decreases, disclosing that the quadriceps is the leading participant during the physiological exercise. A morphological segmentation and a voxel-wise mean T2 calculation are implemented with the #2 layer for statistical analysis. The “mean T2 versus time” curve (the left side of Figure 4b) reveals a linear T2 decay (R2: 0.987) during the quadriceps recovery with a maximum T2 variation up to 7.66 ms and a T2 decay of approximately 0.157 ms/min. The first and the last segmented T2 maps are also attached (the right side of Figure 4b).
Discussion and Conclusion
Differentiating from SE, MOLED-short yields quantitative results free of flow artifacts due to its rapidity. In contrast to MOLED, the T2 mapping results of MOLED-short in the lower extremities are more accurate and robust. Dynamic imaging shows that the MOLED-short is capable of capturing immediate changes in skeletal muscle activities. This improvement is attributed to the fact that MOLED-short captures T2W information of small T2, ensuring a credible measurement on tissues with small T2. Given its fast imaging and performance in tissues with small T2, MOLED-short can be used to monitor biomechanical changes and may provide new insights into the metabolic responses of musculatures to human activities.Acknowledgements
This work was supported in part by the National Natural Science Foundation of China under Grant 11775184 and 82071913, and Science and Technology Project of Fujian Province 2019Y0001.References
1. Carlier PG, Marty B, Scheidegger O, et al. Skeletal muscle quantitative nuclear magnetic resonance imaging and spectroscopy as an outcome measure for clinical trials. Journal of Neuromuscular Disorder. 2016; 3: 1-28.
2. Mankodi A, Azzabou N, Bulea T, et al. Skeletal muscle water T2 as a biomarker of disease status and exercise effects in patients with Duchenne muscular dystrophy. Neuromuscular Disorder. 2017; 27: 705-714.
3. Kim HK, Laor T, Horn PS, Racadio JM, Wong B, Dardzinski BJ,. T2 mapping in Duchenne muscular dystrophy: Distribution of disease activity and correlation with clinical assessments. Radiology. 2010; 255: 899-908.
4. Arpan I, Forbes SC, Lott DJ, et al. T2 mapping provides multiple approaches for the characterization of muscle involvement in neuromuscular diseases: a cross-sectional study of lower leg muscles in 5–15-year-old boys with Duchenne muscular dystrophy. NMR Biomed. 2013; 26: 320-328.
5. Zhang J, Wu J, Chen SJ, et al. Robust single-shot T2 mapping via multiple overlapping-echo acquisition and deep neural network. IEEE Transactions on Medical Imaging, 2019;38(8):1801-1811.
Figures