3094
Three-dimensional architecture and diffusion properties of the medial gastrocnemius muscle in human infants in vivo1Neuroscience Research Australia, Sydney, Australia, 2School of Medical Sciences, University of New South Wales, Sydney, Australia, 3Graduate School of Biomedical Engineering, University of New South Wales, Sydney, Australia, 4Cerebral Palsy Alliance Research Institute, The University of Sydney, Sydney, Australia, 5School of Mathematics and Statistics, University of New South Wales, Sydney, Australia, 6Evolution & Ecology Research Centre, University of New South Wales, Sydney, Australia, 7Faculty of Medicine and Health, The University of Sydney, Sydney, Australia, 8Stats Central, Mark Wainwright Analytical Centre, University of New South Wales, Sydney, Australia, 9Rehab2Kids, Sydney Children’s Hospital, Sydney, Australia
Synopsis
Diffusion tensor magnetic resonance imaging (DT-MRI) was used to investigate the three-dimensional architecture and diffusion properties of medial gastrocnemius muscles in living human infants aged 2-3 months. Mean muscle volume, physiological cross-sectional area and fascicle length in infants were 1.8%, 3.8% and 47.2% of values previously obtained in 8 adult muscles. Radial diffusivity in infant muscle was half that in adult muscle, presumably because infant muscle fibres have much smaller transverse dimensions.
Introduction
Several studies have measured skeletal muscle architecture in children 1,2, but little is known about muscle architecture in infants. This study used diffusion tensor magnetic resonance imaging (DT-MRI) to measure three-dimensional (3D) architecture and diffusion properties of the medial gastrocnemius muscles of living human infants. The data used in this study are part of an ongoing investigation into childhood muscle growth 3.Methods
Participants were five healthy infants (3 boys and 2 girls; age: 1.7-3.1 months; height: 54.2-62.5 cm; body mass: 4.2-7.9 kg; tibia length: 8.6-10.9 cm). They were firmly swaddled with the ankle in 5 ± 15 degrees plantarflexion and the knee in 48 ± 11 degrees flexion and, while sleeping, were placed supine in a 3T MRI scanner (Philips Ingenia CX). Anatomical MRI scans (T1-weighted and mDixon) and DTI scans were obtained from both lower legs of participants. Only one leg from each participant was used for analysis.The settings for the mDixon scans were: 2-point 3D T1-Fast Field Echo (T1FFE) sequence, TR = 4.2-6.2 ms, TE1 = 1.5-3.5, TE2 = 2.7-4.6 msec, acquisition voxel size = 1x1x2 mm, reconstruction voxel size = 1x1x1 mm, number of signal averages (NSA) = 1-2, number of slices = 120-220, scan duration = 40.3-108.5 sec.
The settings for the T1-weighted scans were: 2D turbo spin-echo (TSE) sequence, TR = 598-732.6 msec, TE = 14.9-15.5 msec, acquisition voxel size = 0.7x0.8x5 mm, reconstruction voxel size = 0.4x0.4x5 mm, NSA = 2-3, number of slices = 24-50, and scan duration = 51.3-205.3 sec.
The settings for the DTI scans were: DwiSE sequence, TR = 3000-7200 msec, TE = 45 msec, acquisition voxel size = 2.5x2.5x2.5 mm, reconstruction voxel size = 1.67x1.67x2.5 mm, 12 gradient directions on a hemisphere, NSA = 2-3, b = 500 s/mm2 (b0 image with b = 0 s/mm2), diffusion gradient time Δ/δ = 22.1/11.8 msec and scan duration = 231-372 sec.
The DTI data was corrected for eddy current distortions 4 and subsequently filtered with a local principal component analysis filter 5. The b0-image of the DTI data and mDixon scan were registered to the T1 image with a rigid body transformation to correct for small misalignments between the scans using Elastix 6. DTI tractography was performed using MRtrix 7 with the following settings: seed spacing = 1 mm , 5 mm ≤ fibre tract length ≤ 200 mm, step size = 1 mm, maximum turning angle = 10°. Diffusion properties were calculated per fibre tract by interpolating maps of diffusion properties at the fibre tract points and averaging along the tract. The diffusion values for each muscle were the means of all tracts in the muscle. The largest eigenvalue (λ1) quantifies diffusion along the long axis of muscle fibres and the two smaller eigenvalues (λ2 and λ3) quantify diffusion in the plane transverse to the fibre's long axis.
A 3D surface model of the MG muscle (Fig. 1), from which muscle volume was calculated, was created from manual segmentations of the T1 scan using ITK-SNAP 8. Anatomically constrained tractography 9 was used to resconstruct and quantify the 3D architecture (average fascicle length and pennation angle) of the MG (Fig. 1). Physiological cross-sectional area (PCSA; generally assumed to be proportional to force-generating capacity of a muscle) was calculated by dividing musclevolume by mean fascicle length. Tibia length was calculated from the mDixon scan as the length along the long axis (first principal component) of the manually segmented tibia.
Measurements on infants were compared to previously reported measurements on adult medial gastrocnemius muscles, obtained using similar imaging protocols and analysis methods 10.
Results
Data from the present study, as well as a previous study on adults, 10 are given in Fig. 2. The mean muscle volume, PCSA and fascicle length in infants were 1.8%, 3.8% and 47.2% of those of adults. Normalized to bodyweight, the MG muscle volume of infants was less than one-fifth that in adults.Mean fractional (diffusion) anisotropy was 0.49 in infant MG muscles and 0.27 in adult MG muscles. Diffusivity in infant muscles was smaller in all directions, but the difference was much more pronounced in the direction transverse to muscle fibres than along fibres.
Discussion
We demonstrated the feasibility of using DT-MRI for investigating macro- and microstructural features of childhood muscle growth. These methods can be applied to the study of muscle growth and could potentially be used for early detection of muscle growth disorders.Large differences in fractional anisotropy between infant and adult muscles are explained by substantially smaller tranverse diffusion rates in infants. This finding might be exploited to measure muscle fibre cross-sectional areas or diameters non-invasively.
Conclusion
DT-MRI can be used to investigate skeletal muscle structure in living human infants. Infant MG muscles are much smaller than in adults, even after scaling by body weight. Transverse diffusion rates are musch smaller in infants than adults, suggesting DT-MRI might be used to measure muscle fibre size non-invasively.Acknowledgements
The study was supported by NHMRC grants APP1156394 and APP1117192. The authors acknowledge assistance from NeuRA Imaging, a National Imaging Facility node. BC is supported by a UNSW Scientia scholarship. None of the authors have a conflict of interest.
References
1. Bradshaw LR, M. BE, Stott NS, Agur AMR, Mirjalili A. The architecture of the 6-month-old gastrocnemius: a 3D volumetric study. Eur J Anat. 2020;24:491-499.
2. Williams SA, Bell M, Kim HK, et al. The reliability and validity of triceps surae muscle volume assessment using freehand three-dimensional ultrasound in typically developing infants. J Anat. 2021.
3. Herbert R, Bolsterlee B, Chow B, et al. Muscle Growth in the Lower Extremity: the MUGgLE study. 2019; https://osf.io/scfxj.
4. Andersson JLR, Sotiropoulos SN. An integrated approach to correction for off-resonance effects and subject movement in diffusion MR imaging. Neuroimage. 2016;125:1063-1078.
5. Manjon JV, Coupe P, Concha L, Buades A, Collins DL, Robles M. Diffusion weighted image denoising using overcomplete local PCA. PLoS One. 2013;8(9):e73021.
6. Klein S, Staring M, Murphy K, Viergever MA, Pluim J. elastix: A Toolbox for Intensity-Based Medical Image Registration. IEEE Transactions on Medical Imaging. 2010;29(1):196-205.
7. Tournier JD, Smith R, Raffelt D, et al. MRtrix3: A fast, flexible and open software framework for medical image processing and visualisation. NeuroImage. 2019;202:116137.
8. Yushkevich PA, Piven J, Hazlett HC, et al. User-guided 3D active contour segmentation of anatomical structures: significantly improved efficiency and reliability. NeuroImage. 2006;31(3):1116-1128.
9. Bolsterlee B, D'Souza A, Herbert RD. Reliability and robustness of muscle architecture measurements obtained using diffusion tensor imaging with anatomically constrained tractography. J Biomech. 2019;86:71-78.
10. Bolsterlee B, D'Souza A, Gandevia SC, Herbert RD. How does passive lengthening change the architecture of the human medial gastrocnemius muscle? J Appl Physiol (1985). 2017;122(4):727-738.
Figures
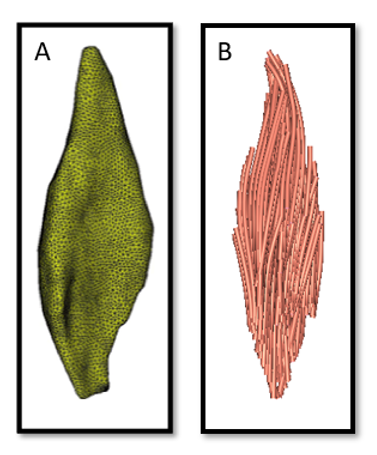
Fig. 1: (A) 3D surface reconstruction and (B) fascicle reconstruction of the MG muscle.
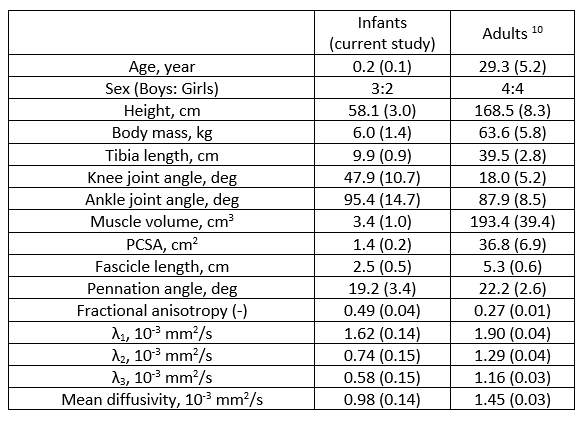
Fig. 2: Anthropometry, leg joint position, muscle volume, 3D architecture and diffusion properties of medial gastrocnemius muscle from this study and a previous study on adults. Ankle joint angle is the angle between the tibia and the sole of the foot. Knee joint angle is the angle between the femur and the tibia, where 0 deg means the knee is fully extended. Values are means (SDs).