3092
Evaluation of Multimodal MRI in RA Efficacy Based on Quantitative Bone Marrow Edema
Wenzhao Yuan1, Yi Dai2, Yiwu Lei3, Fang Qin4, Huiting Zhang5, Zisan Zeng3, and Liling Long1
1The First Affiliated Hospital of Guangxi Medical University, Nanning, China, 2Radiology, The Second Affiliated Hospital of Guangxi Medical University, Nanning, China, 3Radiology, The First Affiliated Hospital of Guangxi Medical University, Nanning, China, 4Rheumatology, The First Affiliated Hospital of Guangxi Medical University, Nanning, China, 5Siemens Healthcare Ltd., Wuhan, China
1The First Affiliated Hospital of Guangxi Medical University, Nanning, China, 2Radiology, The Second Affiliated Hospital of Guangxi Medical University, Nanning, China, 3Radiology, The First Affiliated Hospital of Guangxi Medical University, Nanning, China, 4Rheumatology, The First Affiliated Hospital of Guangxi Medical University, Nanning, China, 5Siemens Healthcare Ltd., Wuhan, China
Synopsis
This study evaluated the efficacy of MRI bone marrow edema imaging for rheumatoid arthritis (RA). Wrist joints of RA patients were examined at baseline and follow-up with T1 mapping, T2 mapping and IVIM, and their clinical indicator DAS28-ESR was also collected. Results showed that the changes of both T1 and D values had statistically positive correlations with DAS28-ESR. And the results showed that T1 and D values of bone marrow edema area in lunate bone, triangle bone and capitate bone can significantly reflect the curative effect of RA, and the change rate of T1 can predict the curative effect.
Introduction
Rheumatoid arthritis (RA) can cause joint damage and disability1, and requires long-term medication to achieve optimal control or even relieve inflammation and improve quality of life2. Due to the negative effect of antirheumatic agents, the curative effect should be timely monitored and evaluated in the treatment process, and the most appropriate dose should be used to control the condition to minimize the side effects of the drug. In recent years, joint bone marrow edema detected by MRI is considered to be a powerful independent predictor and an important prognostic indicator3 of imaging progression of RA. It has been confirmed that RA bone marrow edema is caused by the infiltration of inflammatory cells in the bone marrow, resulting in increased water content4. The current assessment method for RA bone marrow edema is a semi-quantitative method called rheumatoid arthritis magnetic resonance image scoring system (RAMRIS)5, which is cumbersome and time-consuming, and cannot determine the severity of bone marrow edema, and is not sensitive to the judgment of initial therapeutic effect6. This study attempted to quantitatively analyze RA bone marrow edema by using MRI quantitative technology, and explored its feasibility in the evaluation of clinical efficacy.Methods and materials
A Siemens 3.0T MR scanner (MAGNETOM Prisma, Siemens Healthcare, Erlangen, Germany) was used to carry out the baseline and follow-up review of the wrist of patients with RA. The scanning sequence included FS-TSE-T2WI, T1mapping, T2mapping and intro-voxel incoherent movement (IVIM). Forty-eight patients (10 males and 38 females) with a median age of 50 years (20-70 years) were included in the follow-up review, with 30 cases of right wrist and 18 cases of left wrist. Among them, 38 cases were reviewed twice, 27 cases were reviewed three times, and 18 cases were reviewed four times. Data were collected on 8 target bones (scaphoid,lunate,traquetral,capitate, hamate,distal radius and base of the 2nd and 3rd metacarpal bones) and 3 target bones (lunate, traquetral and capitate bone). DAS28-ESR scores were also collected from baseline to each review. The correlation between DAS28-ESR value, T1, T2, diffusion coefficient (D), pseudo-diffusion coefficient (D*), fraction of D* in D (fp) and RAMRIS in the follow-up process was analyzed, and the difference in change rate of MRI quantitative value at the end of the first course of treatment in different efficacy was compared. Preason correlation analysis and t-test were used to assess the relationship and difference. P<0.05 was considered statistically significant.Results
Both T1 and D values had significantly positive correlations with DAS28-ESR values at the end of each course of treatment (P < 0.05), while T2, fp and D* had no correlations with DAS28-ESR values (P > 0.05)(Table 1). At the end of the first course of treatment, 31 patients had therapeutic effect and 17 patients had no therapeutic effect. The rate of change of T1 value at the end of the first course of treatment was significantly different between patients with and without treatment effect (P < 0.05) (Table 2), and the measurement values in the lunate bone, triangular bone and cephaloid bone as the target range had the highest reliability, which the AUC of ROC curve was 0.763, the sensitivity of the best cut-off value was 0.871, and the specificity was 0.588(Figure 1). RAMRIS score did not change significantly during follow-up and was not associated with changes in DAS28-ESR.Discussion and Conclusion
This preliminary study quantitatively measured the T1, T2 and the parameters from IVIM for bone marrow edema in response to the efficacy of RA. Results showed that when clinical DAS28-ESR score decreases, the disease progresses to remission and inflammatory activity decreases. Meanwhile, T1 and D values also decreased, indicating that water content was decreasing, which was just consistent with the reduction of inflammatory activity shown clinically. Lunate bone, trigonal bone and capitate bone are the most common bones with bone marrow edema in wrist joint. When the treatment is improved, the inflammatory absorption of these three bones may be the most significant, so the water content reduction of them is more obvious than that of the other eight bones. However, the reduction of water content in the area of bone marrow edema was not enough to cause significant changes at the early stage of treatment, therefore, the RAMRIS score was not enough to reflect the treatment effect at the early stage of treatment. This study showed that T1mapping and IVIM imaging can effectively and quantitatively evaluate the initial efficacy of RA patients. As the decline of clinical scores, T1 and D values also decreased. The significance of T2 mapping bone marrow imaging in RA efficacy monitoring is not obvious, and its clinical application remains to be explored. The change rate of T1 value of wrist bone marrow edema at the end of the first course of treatment can be helpful to judge the efficacy of RA. Lunate bone, triangular bone and cephalic bone can be used as new observation points to evaluate the clinical efficacy of RA.Acknowledgements
We sincerely thank the participants in this study.References
1. CROSS M, SMITH E, HOY D, et al. The global burden of rheumatoid arthritis: estimates from the global burden of disease 2010 study [J]. Ann Rheum Dis, 2014, 73(7): 1316-22. 2. ALETAHA D, SMOLEN J S. Diagnosis and Management of Rheumatoid Arthritis: A Review [J]. Jama, 2018, 320(13): 1360-72. 3. Colebatch AN, Edwards CJ, Østergaard M, et al. EULAR recommendations for the use of imaging of the joints in the clinical management of rheumatoid arthritis[J]. Ann Rheum Dis, 2013, 72(6): 804-814. 4. Jimenez-Boj E, Nöbauer-Huhmann I, Hanslik-Schnabel B, et al. Bone erosions and bone marrow edema as defined by magnetic resonance imaging reflect true bone marrow inflammation in rheumatoid arthritis[J]. Arthritis Rheum, 2007, 56(4): 1118-1124. 5. Østergaard M, Peterfy CG, Bird P, et al. The OMERACT Rheumatoid Arthritis Magnetic Resonance Imaging (MRI) Scoring System: Updated Recommendations by the OMERACT MRI in Arthritis Working Group[J]. J Rheumatol, 2017, 44(11): 1706-1712. 6. Conaghan PG, Durez P, Alten RE, et al. Impact of intravenous abatacept on synovitis, osteitis and structural damage in patients with rheumatoid arthritis and an inadequate response to methotrexate: the ASSET randomised controlled trial[J]. Ann Rheum Dis, 2013, 72(8): 1287-1294.Figures
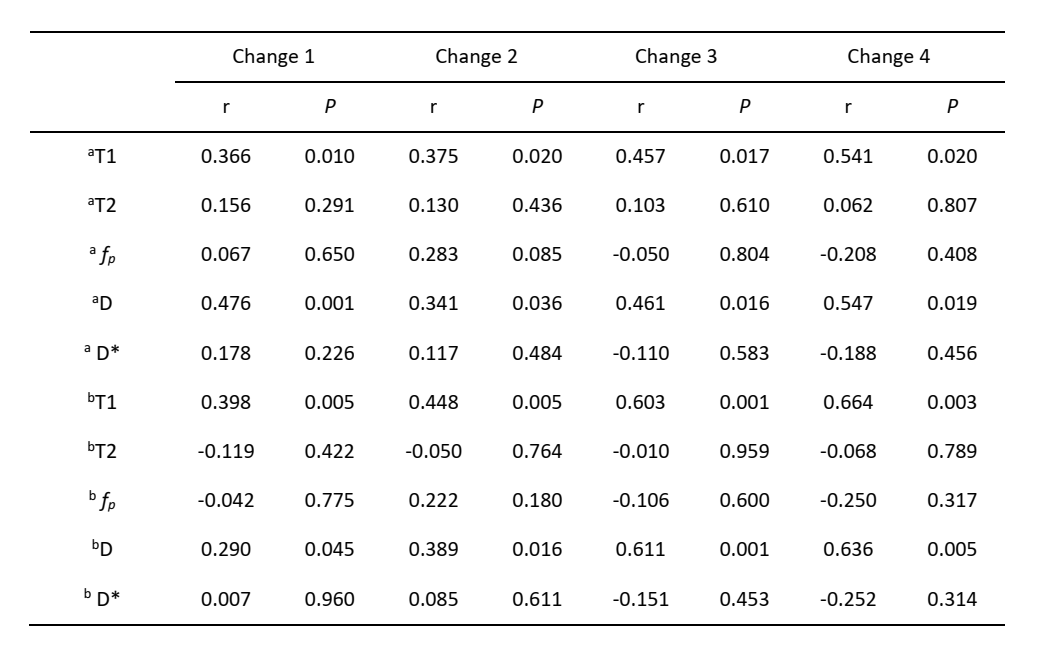
Table 1. Correlation analysis between MRI quantitative
changes and DAS28-ESR changes. a:8 target bones (scaphoid,lunate,traquetral,capitate, hamate,distal radius and base of the 2nd and 3rd
metacarpal bones) . b:3 target bones
(lunate, traquetral and capitate bone). Change 1= the value at the 1st treatment course minus the baseline
value; change 2=the value at the 2nd treatment course
minus the baseline value; change 3=the value at the 3rd treatment course minus the baseline
value; change 4=the value at the 4th treatment course
minus the baseline value.
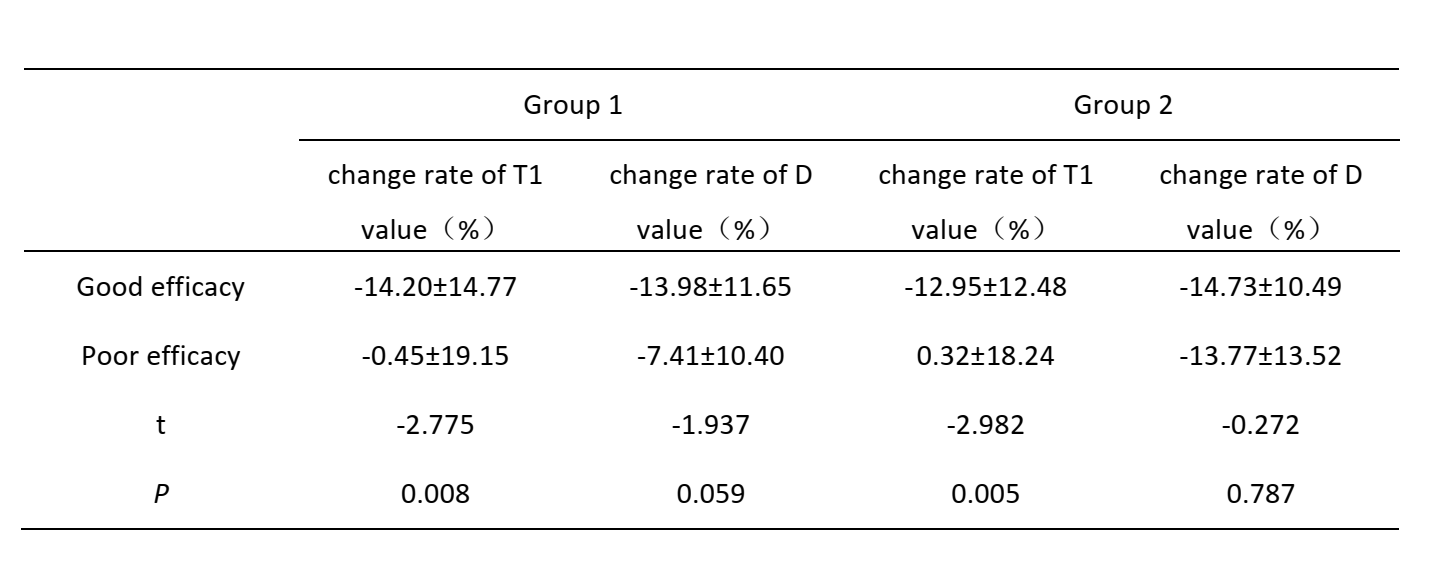
Table 2. Comparison of the change rate of T1 and D values
at the end of the first course of treatment among different curative effects. Group 1: 8 target bones (scaphoid,lunate,traquetral,capitate, hamate,distal radius and base of the 2nd and 3rd
metacarpal bones). Group 2: 3 target bones (lunate, traquetral and capitate
bone).
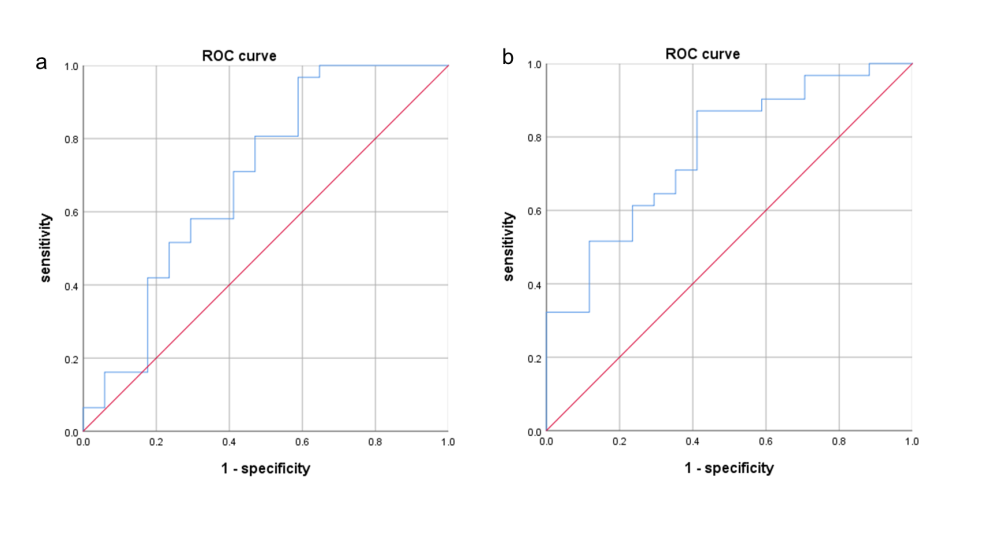
Fig 1. ROC curve of change rate of T1
value at the end of the first course of treatment and efficacy. a: Graph shows
the AUC(0.693) for 8 target bones (scaphoid,lunate,traquetral,capitate, hamate,distal radius and base of the 2nd and 3rd
metacarpal bones), and the sensitivity ,
specificity was 0.968, 0.410, respectively;b: Graph shows the AUC (0.763) for 3 target
bones (lunate, traquetral and capitate bone), and the sensitivity, specificity
was 0.871, 0.588, respectively.
DOI: https://doi.org/10.58530/2022/3092