3090
Intravoxel Incoherent Motion-Diffusion Weighted Imaging derived parameters for survival prediction of multiple myeloma1Peking university people's hospital, Beijing, China
Synopsis
The prognostic biomarkers for multiple myeloma (MM) was urgently needed, and this study was the first to confirm the value of Intravoxel Incoherent Motion-Diffusion Weighted Imaging (IVIM-DWI) for predicting progression-free survival in patients with MM.Purpose: To evaluate the prognostic ability of Intravoxel Incoherent Motion-Diffusion Weighted Imaging (IVIM-DWI) derived parameters in newly diagnosed multiple myeloma (MM).
Purpose
To evaluate the prognostic ability of Intravoxel Incoherent Motion-Diffusion Weighted Imaging (IVIM-DWI) derived parameters in newly diagnosed multiple myeloma (MM).Material and methods
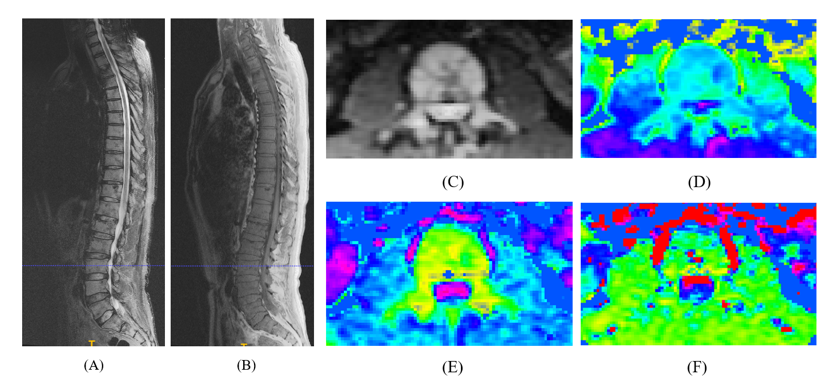
A total of 42 newly diagnosed MM patients were enrolled, and all the patients were treated with bortezomib-based therapy. The 3T MRI examination included the whole spine T1WI and T2WI, and the IVIM-DWI that targeted at L3-L5 of the lumbar spine. The median of follow-up period was 20 months (CI, 15.2–32.5 months). The IVIM-DWI parameters (diffusion coefficient, D; pseudoperfusion fraction, f; and pseudodiffusion coefficient, D*) were all calculated for further analysis. Participant clinical characteristics and progression-free survival (PFS) were collected. Univariate and multivariate analyses were performed using the Cox proportional hazards model to investigate prognostic significance of possible indicators. The X-tile was used to identify the threshold of significant indicator for MM PFS.Results
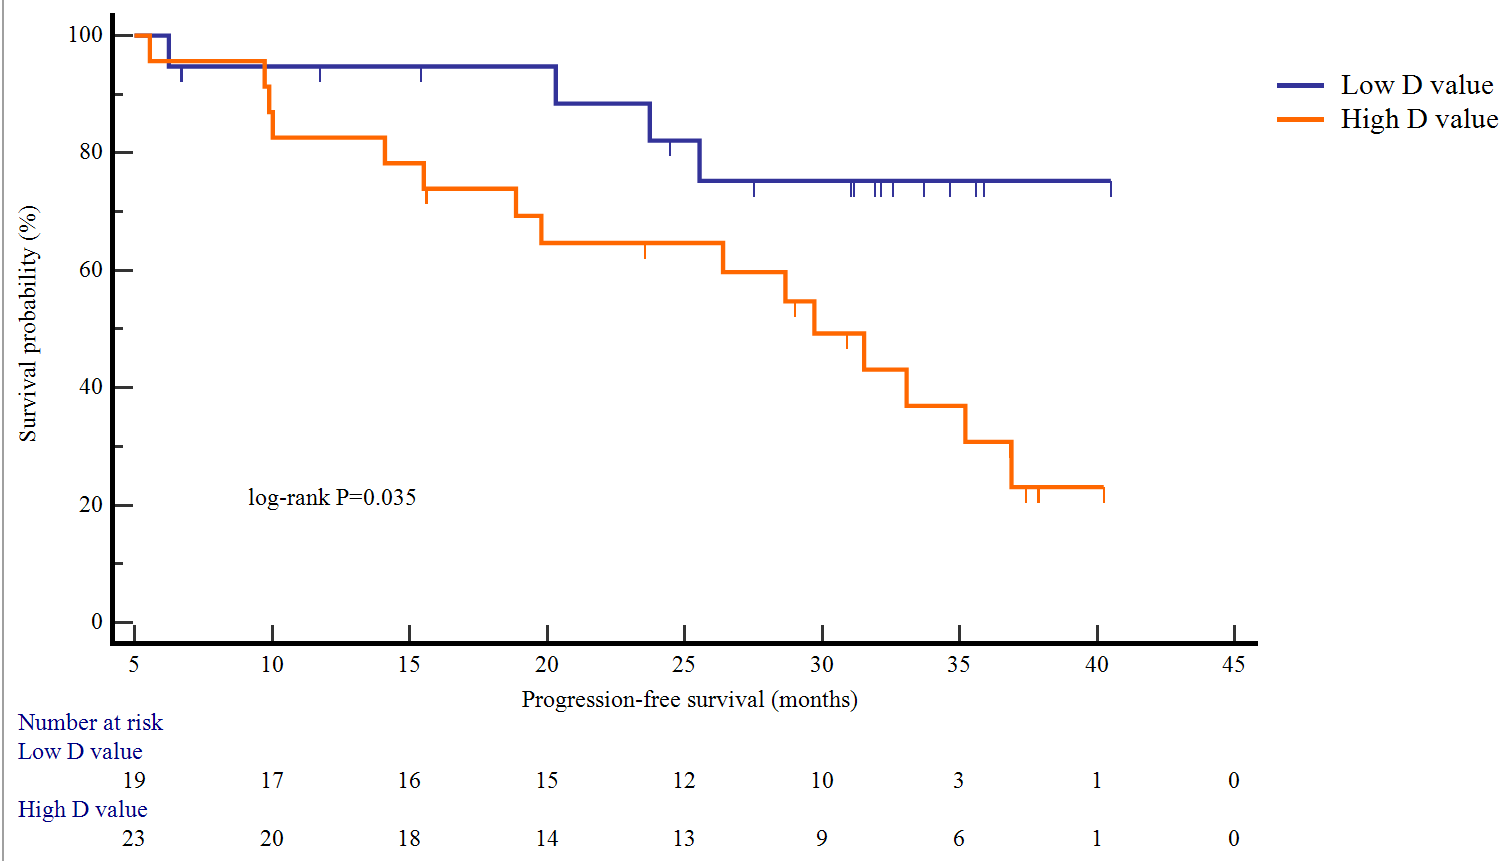
By the univariable analysis, the β2-MG≥5.5 mg/L was identified as PFS related factor. For the IVIM-DWI parameters, the D value was the risk factor (P=0.038). However, D* value (P=0.433), f value (P=0.213) was not associated with MM PFS. By using the cutoff value 0.22, the high D value (≥0.22) and low D value (<0.22) showed obvious split of Kaplan-Meier curve (Log-rank P=0.011). However, the D value was not independent (P=0.069) of clinical confounder (β2-MG≥5.5 mg/L).Conclusion
Diffusion coefficient from IVIM-DWI may be a valuable prognosis predictor of newly diagnosed MM. The apparent diffusion coefficient with marginal significance may also play a role.Acknowledgements
This work was supported by the National Natural Science Foundation of China (No.81971575).References
[1] Matsue K, Kobayashi H, Matsue Y, et al. Prognostic significance of bone marrow abnormalities in the appendicular skeleton of patients with multiple myeloma[J]. Blood Adv,2018,2(9):1032-1039.
[2] Smith D, Yong K. Advances in understanding prognosis in myeloma[J]. Br J Haematol,2016,175(3):367-380.
[3] Dimopoulos M A, Hillengass J, Usmani S, et al. Role of magnetic resonance imaging in the management of patients with multiple myeloma: a consensus statement[J]. J Clin Oncol,2015,33(6):657-664.
[4] Merz M, Ritsch J, Kunz C, et al. Dynamic contrast-enhanced magnetic resonance imaging for assessment of antiangiogenic treatment effects in multiple myeloma[J]. Clin Cancer Res,2015,21(1):106-112.
[5] Zhang L, Wang Q, Wu X, et al. Baseline bone marrow ADC value of diffusion-weighted MRI: a potential independent predictor for progression and death in patients with newly diagnosed multiple myeloma[J]. Eur Radiol,2021,31(4):1843-1852.
[6] Barlogie B, Bolejack V, Schell M, et al. Prognostic factor analyses of myeloma survival with intergroup trial S9321 (INT 0141): examining whether different variables govern different time segments of survival[J]. Ann Hematol,2011,90(4):423-428.
Figures