3088
Three-dimensional ultrashort echo time MRI to evaluate sacroiliac joint in patients with ankylosing spondylitis1Radiology, Peking University Third Hospital, Beijing, China, 2MR Collaborations, Siemens Healthineers Ltd., Shanghai, China, 3Siemens Healthcare, Zurich, Switzerland, 4Swiss Center for Musculoskeletal Imaging (SCMI), Balgrist Campus, Zurich, Switzerland, 5Advanced Clinical Imaging Technology (ACIT), Siemens Healthcare AG, Lausanne, Switzerland
Synopsis
To assess the diagnostic performance of three-dimensional ultrashort echo time sequence (3D-UTE) in bone erosion detection of the sacroiliac joint (SIJ) in patients with clinically confirmed ankylosing spondylitis (AS) and to test whether SIJ cartilage T2* values might help in identification of patients with AS.
Introduction
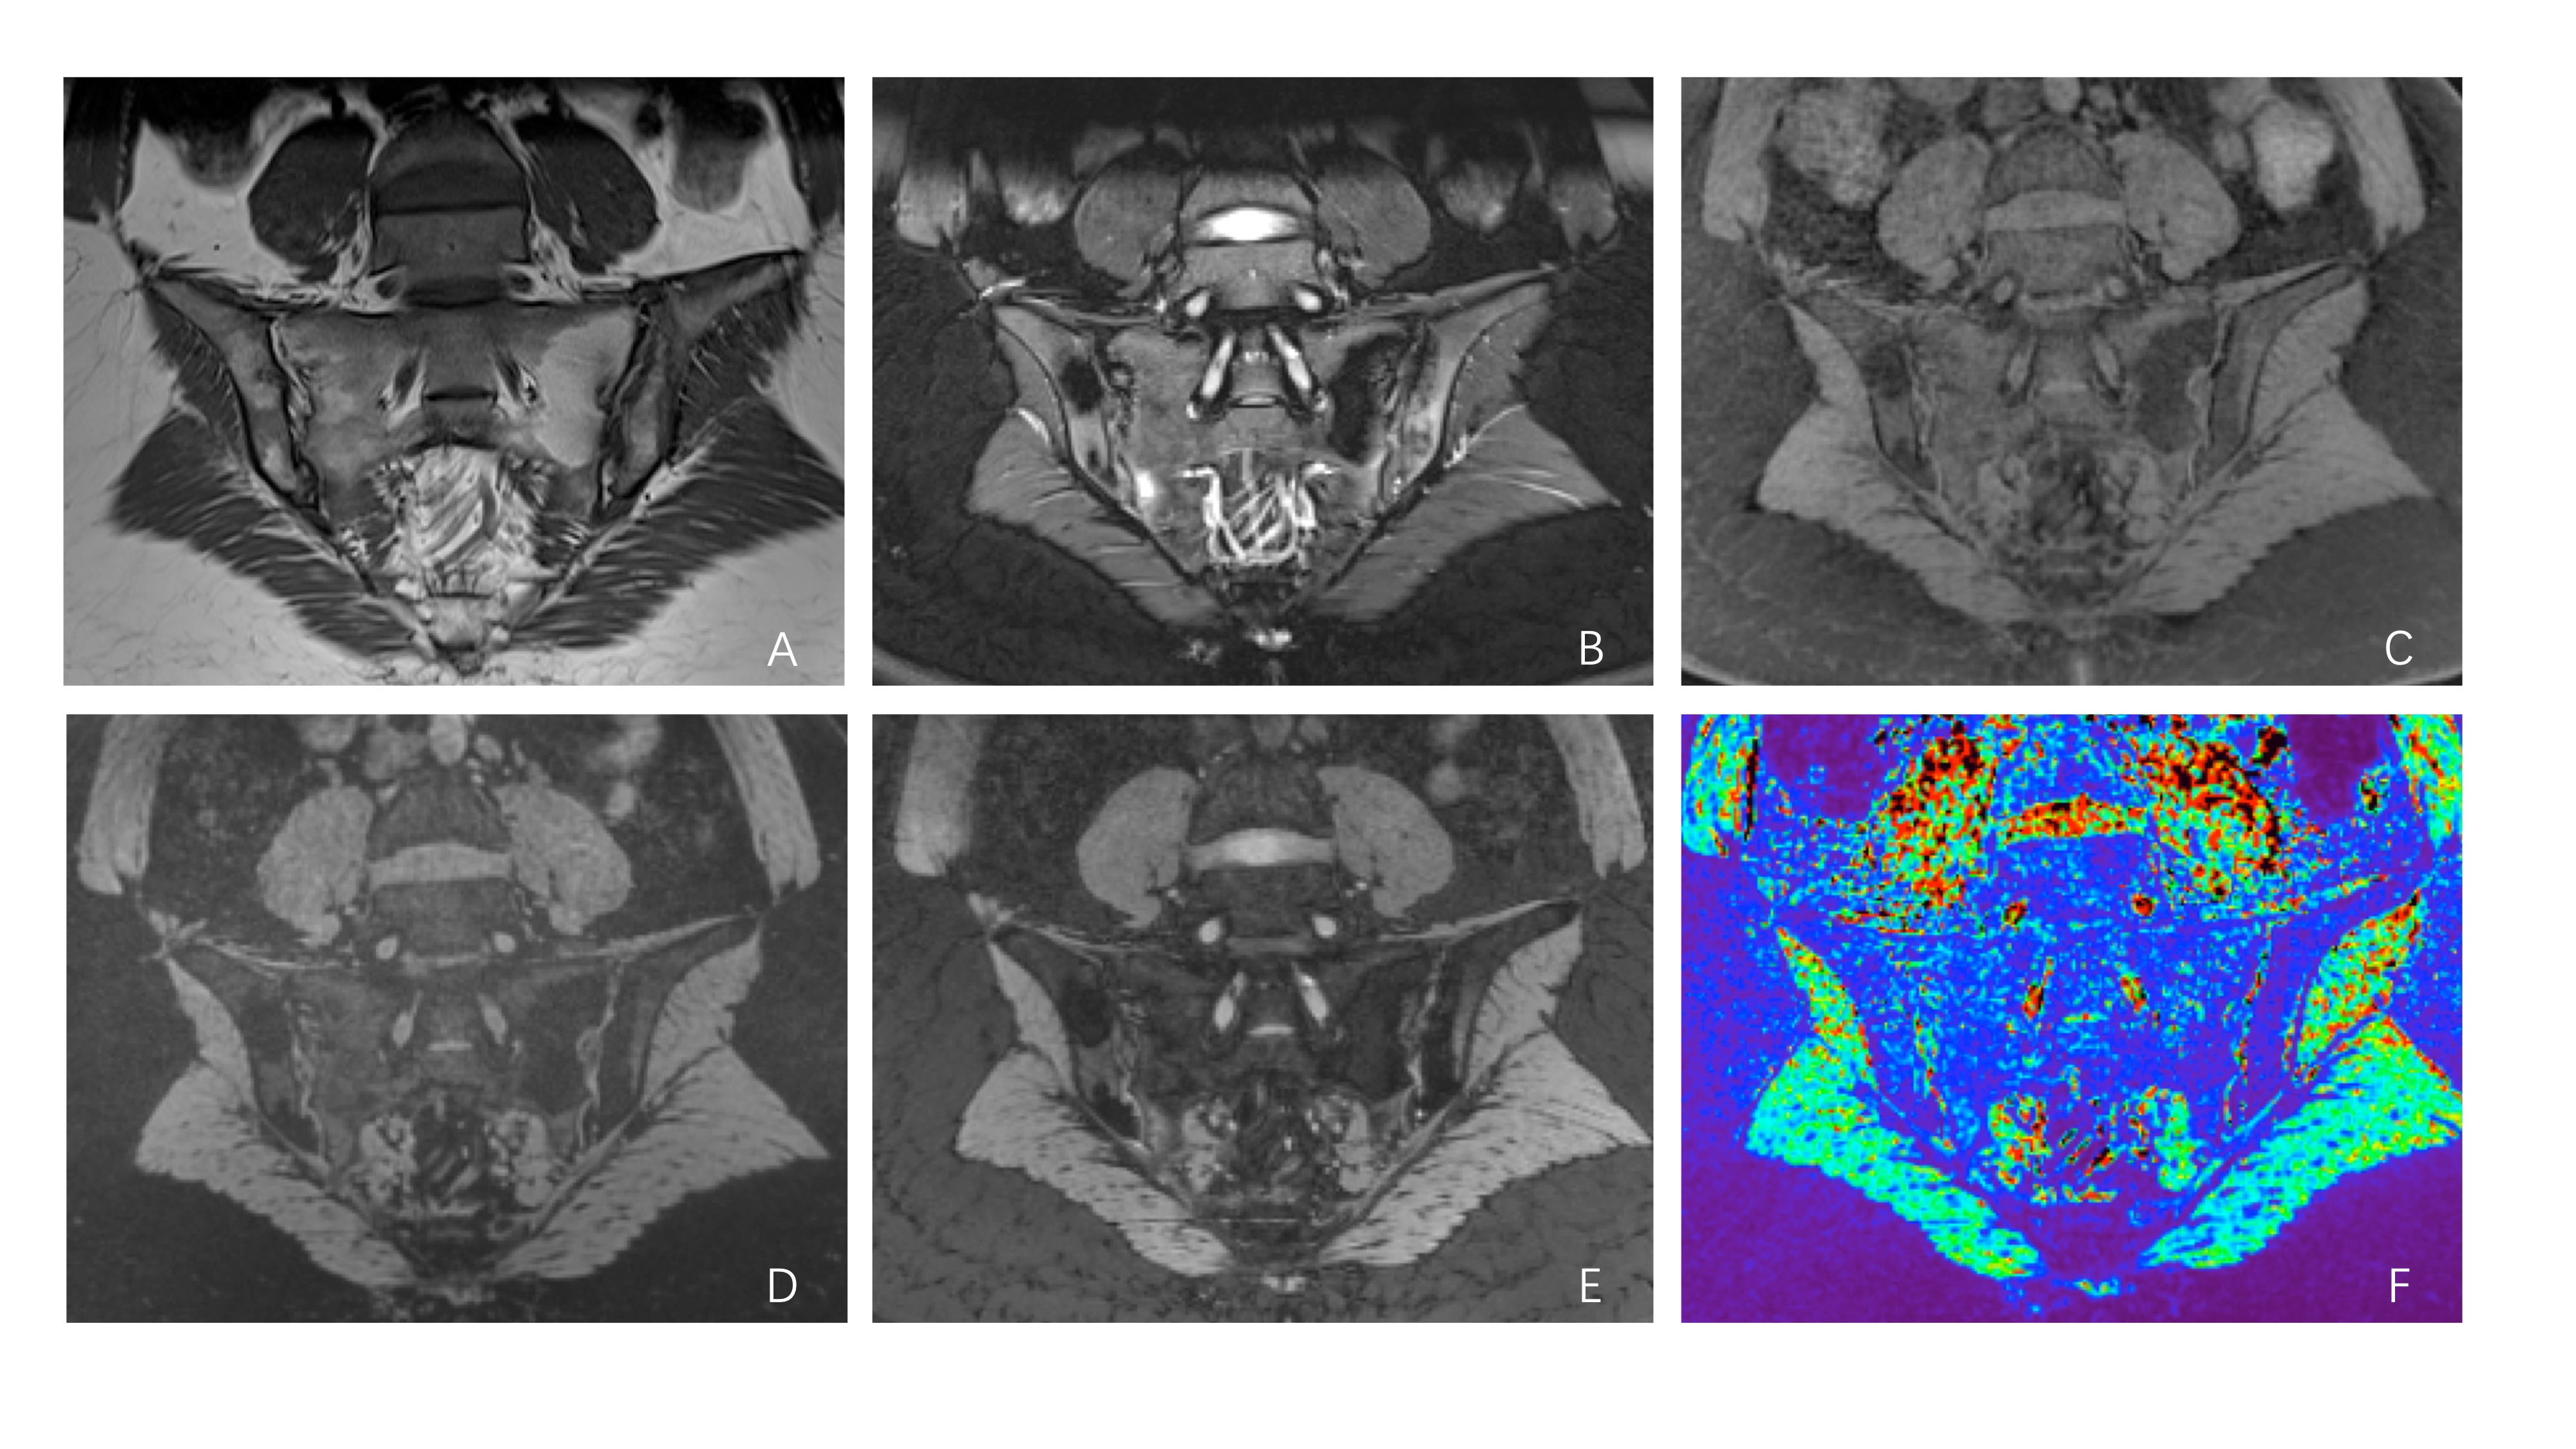
The presence of erosions of the sacroiliac joint (SIJ) is highly specific for ankylosing spondylitis (AS) and may enhance confidence in classification of axial spondyloarthritides (axSpA) [1]. CT remains the gold standard for detection of erosions in sacroiliitis. However, ionizing radiation exposure from CT scans of SIJs may increase risk of pelvic malignancies [2-3]. The three-dimensional ultrashort echo time (3D-UTE) prototype sequence is capable of identifying cartilaginous and subchondral bone erosions, and can serve as a quantitative method by measuring the T2* value of cartilage for early detection of cartilage abnormalities.Methods
Following informed consent, 32 patients diagnosed with AS (24 males, 8 females; mean age 28.44 years; range 19 to 67 years) and 32 healthy volunteers (19 males, 13 females; mean age 28.22 years; range 22 to 44 years) were imaged on a 3T MR system (MAGNETOM Prisma, Siemens Healthcare, Erlangen, Germany). The MR protocol consisted of two conventional sequences (T1WI, FS-T2WI) followed by the prototype 3D-UTE sequence. Acquisition parameters for 3D-UTE imaging were: FA = 5°, TR = 142ms (containing segmented fat saturation module, 1 fat saturation per 15 radial spokes, inter-spoke TR: 8.6ms), total radial spokes = 49980; TE (three echo times) = 0.05/2.5/5 ms, FOV = 300×300 mm2, slice thickness = 1 mm, resolution = 1 ×1 × 1 mm3. Two radiologists separately interpreted bone erosion of each SIJ on 3D-UTE sequence in random order blinded to other data. SIJ cartilage T2* values were measured in both groups and average values were compared.Results
Diagnostic sensitivity, specificity, accuracy, positive predictive value (PPV), negative predictive value (NPV), and area under the curve (AUC) in erosion detection on 3D-UTE sequence of two reviewers were 94.7%, 97.5%,96.7,95.9%,96.2%,0.961; 92.9%,96.5%,95.4, 94.6, 95.0, and 0.947, respectively (Table1). For presence or absence of erosions, the inter-reader agreement was good on 3D-UTE sequence, inter-reader κ value was 0.949, p<0.0001. The T2* values of cartilage in patients with AS on 3D-UTE sequence measured by two reviewers (Reader 1: 25.92±1.85ms, Reader 2: 25.49±2.30ms) were significantly higher than those of healthy volunteers (Reader 1: 22.01±2.27ms, Reader 2: 21.06±1.75ms), p<0.0001(Fig.1).Table 1. Diagnostic performance for erosion detection on 3D-UTE sequence
| Reader | Sensitivity (%) | Specificity (%) | PPV (%) | NPV (%) | Accuracy | AUC |
| Reader 1 | 94.7(319/337)[91.7-96.7] | 97.5(420/431)[95.4-98.6] | 96.7(319/330)[94.1-98.2] | 95.9(420/438)[93.6-97.4] | 96.2(739/768)[94.6-97.4] | 0.961(0.944-0.977) |
| Reader 2 | 92.9(313/337)[89.6-95.2] | 96.5(416/431)[94.3-97.9] | 95.4(313/328)[92.5-97.2] | 94.6(416/440)[92.0-96.3] | 95.0(729/768)[93.1-96.3] | 0.947(0.928-0.966) |
3D-UTE, three-dimensional ultrashort echo time; AUC, area under the curve; NPV, negative predictive value; PPV, positive predictive value.
Discussion and conclusion
Here we evaluated the use of a prototype 3D-UTE sequence for bone erosion detection of SIJs in patients with AS and also measured cartilage T2* values. 3D sequences can produce relatively thin image slices with a high in-plane resolution, which contributes to detection of small bone erosions and increased diagnostic specificity. This study demonstrated that 3D-UTE sequence is sufficient for erosion detection of SIJ with high diagnostic accuracy and inter-reader agreement using CT as a reference standard. Higher T2* values were observed in the AS group compared with controls. To our knowledge, this is the first study to report quantitative T2* mapping of SIJ cartilage in patients with AS. Because T2* values are influenced by water content, they may demonstrate a bi-phasic pattern in various grades of osteoarthropathy (OA). This reflects the tendency toward increased cartilage water content in the early stages of OA, before the cartilage content decreases, which can contribute to further collagen network degradation and proteoglycan depletion [4]. The most portions of sacroiliac cartilage are hyaline cartilage, similar to that in the peripheral joints [5]. Therefore, the increase of T2* values in SIJs of early AS patients may be related to the change of water combined with proteoglycan and collagen fibers into free water. Our results show that the prototype 3D-UTE sequence provides quantitative T2* values that can be used to diagnose AS.Acknowledgements
No acknowledgement found.References
1. Seven S, Østergaard M, Morsel-Carlsen L, et al. The utility of magnetic resonance imaging lesion combinations in the sacroiliac joints for diagnosing patients with axial spondyloarthritis. A prospective study of 204 participants including post-partum women, patients with disc herniation, cleaning staff, runners and healthy persons. Rheumatology (Oxford, England),2020; 59(11), 3237–3249.
2. Smith-Bindman R, Lipson J, Marcus R, et al. Radiation dose associated with common computed tomography examinations and the associated lifetime attributable risk of cancer. Arch Intern Med. 2009;169(22):2078-2086. https:// doi:10.1001/archinternmed.2009.427.
3. Zondervan RL, Hahn PF, Sadow CA, et al. Body CT scanning in young adults: examination indications, patient outcomes, and risk of radiation-induced cancer. Radiology. 2013;267(2):460-469.
4. Hesper T, Hosalkar HS, Bittersohl D, et al. T2* mapping for articular cartilage assessment: principles, current applications, and future prospects. Skeletal Radiol. 2014 ;43(10):1429-1445.
5. Foley BS, Buschbacher RM. Sacroiliac joint pain: anatomy, biomechanics, diagnosis, and treatment. Am J Phys Med Rehabil. 2006;85(12):997-1006.
Figures