3087
CSE-MRI Detects the Changes in Bone Marrow Fat after Weight Loss Induced by Healthy Low-carbohydrate Diet1Zhujiang Hospital, Guangzhou, China, 2Philips Healthcare, Guangzhou, China
Synopsis
Obesity is a global health condition that leads to many kinds of diseases. Bone marrow fat (BMF) is considered as the third largest fat depot in human body. It has been proved that BMF is closely related with energy storage, bone metabolism, endocrine function and hematologic diseases. To understand the relation between BMF and weight loss is crucial within obesity related diseases scenario. Few studies have been published focusing on BMF variation so far. In this study, chemical shift encoding-based water-fat MRI (CSE-MRI) was employed to demonstrate the positive correlation between BMF and parts of the weight loss indicators.
Introduction
Obesity has been a global health problem for a long time, which leads to a variety of diseases including cardiovascular and musculoskeletal diseases, type II diabetes, cancer andhaematological diseases1-3. Healthy low-carbohydrate (HLC) diet has been proved effective on weight loss4. Bone marrow fat (BMF), after subcutaneous adipose tissue (SAT) and visceral adipose tissue (VAT), is the third largest fat depot of the body5. Recent studies have shown that BMF is closely related with energy storage, bone metabolism, the endocrine function and hematologic diseases5, 6. Therefore, it is significant to understand the relation between BMF and weight loss. However, there are very few studies focused on changes in BMF after weight loss, especially those achieved through HLC7, 8. In this study, we used chemical shift encoding-based water-fat MRI (CSE-MRI) to investigate the correlation between changes in BMF and weight loss indicators, including weight, BMI, SAT, VAT and abdominal adipose tissue (AAT). The study was performed on the obese male youth who lost weight through HLC.Method
The study was approved by the local institutional review board and informed consent was obtained.Subject: 4 obese male youth without other metabolic diseases participated in the study (mean age±standard deviation: 30±1 year; mean body mass index (BMI)±standard deviation: 31.08±0.92 kg/m2). They got a 12-week HLC intervention developed by a professional dietitian.
Scanner: All subjects were scanned before and after the intervention using a 3.0 T MR scanner (Ingenia, Philips Healthcare, the Netherlands).
Sequences: All the quantitative images were acquired by mDixon Quant, a 3D CSE-MRI sequence with 6 echoes and with T2* correction. Axial images covered lumbar vertebral of the whole abdominal area (TR/TE, 6.3/1.07 ms; voxel size, 1.94×2.12 mm; slice thickness, 5 mm). Sagittal images of the vertebral body ranged from thoracic vertebral body T9 to L5 (TR/TE, 6.5/1.09 ms; voxel size, 1.89×1.50 mm; slice thickness, 4 mm).
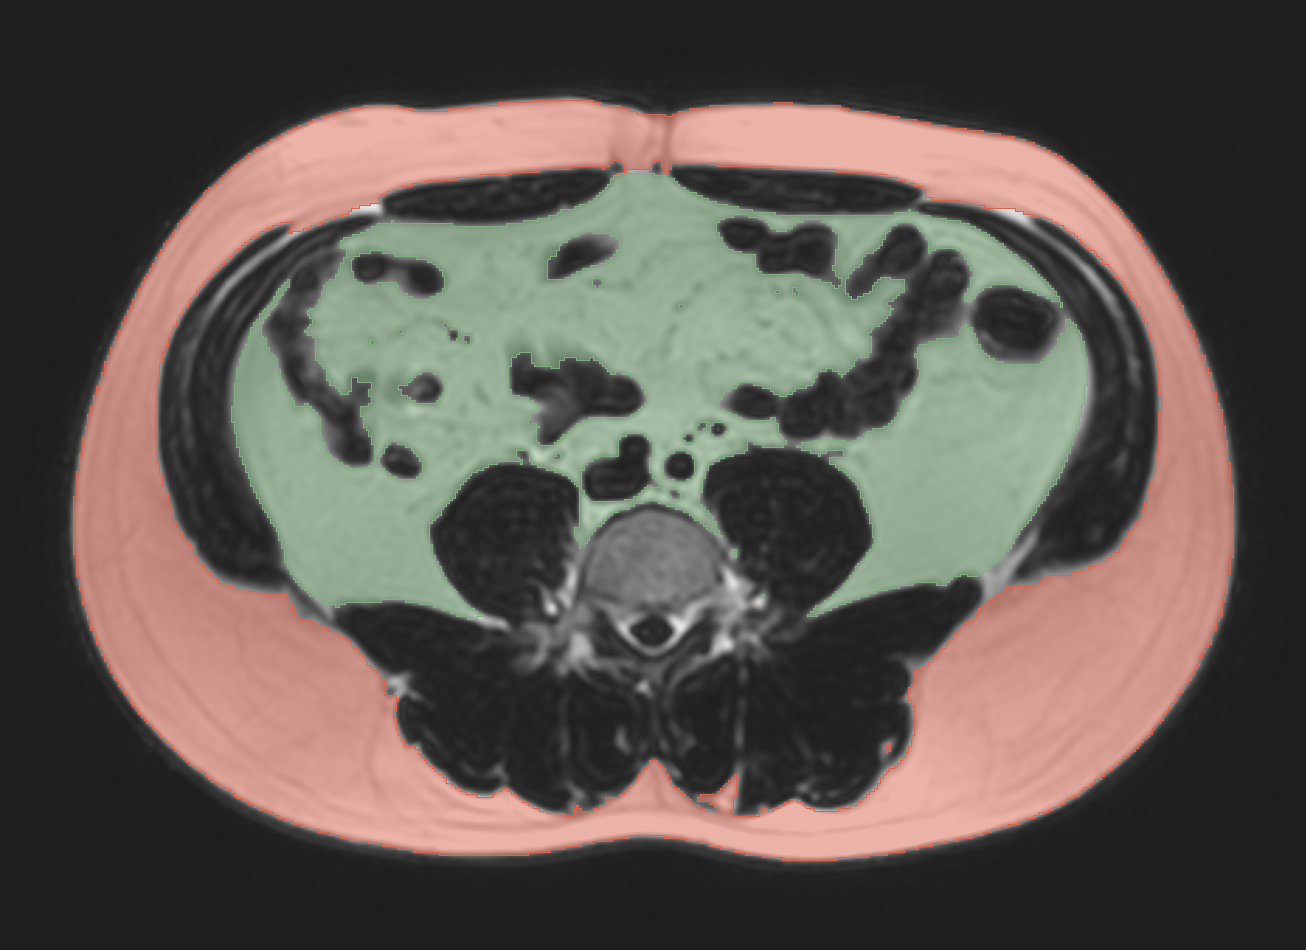
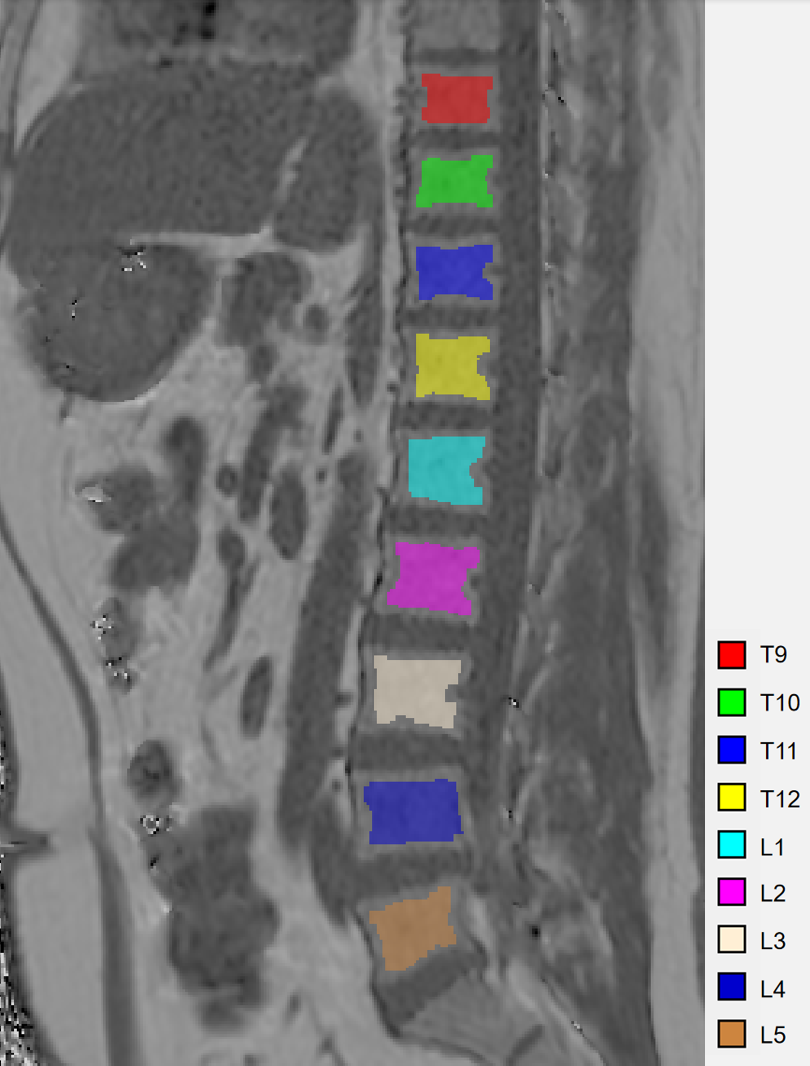
Image evaluation: VAT and SAT were semi-automatically segmented by a post-processing software (3D Slicer; see Figure 1). Encompassing the largest area of the cancellous bone of vertebral bodies, one ROI was placed in each vertebra to evaluate the fat fraction (FF) by a post-processing software (ITK-SNAP; see Figure 2).
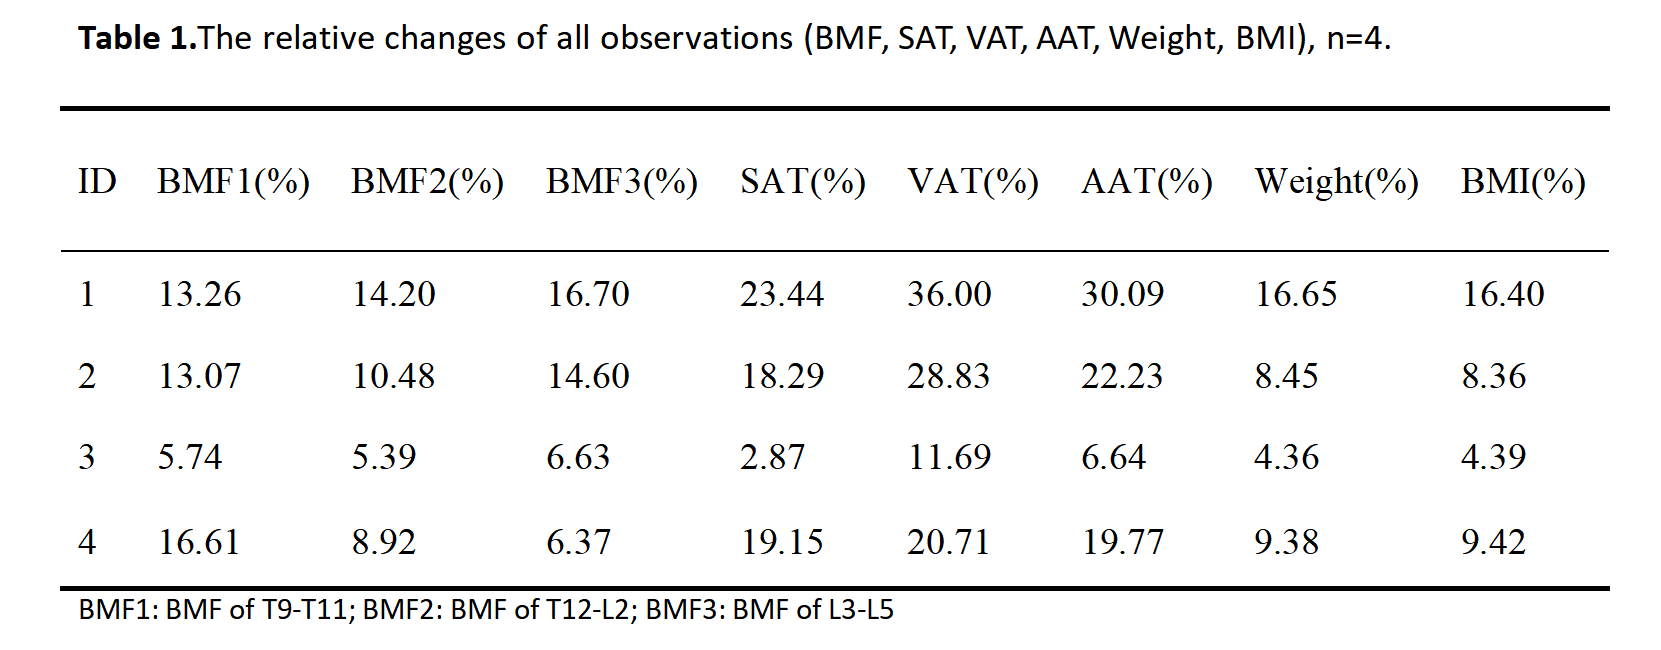
Statistics: AAT is defined as the summation of VAT and SAT. The vertebral bodies were separated into three parts (T9-T11, T12-L2, L3-L5). The FF of each part is the average FF of the three vertebrae. The relative changes of all variables were obtained. Pearson’s coefficients were used to evaluate the correlation between relative changes in BMF and weight loss indicators.
Result and discussion
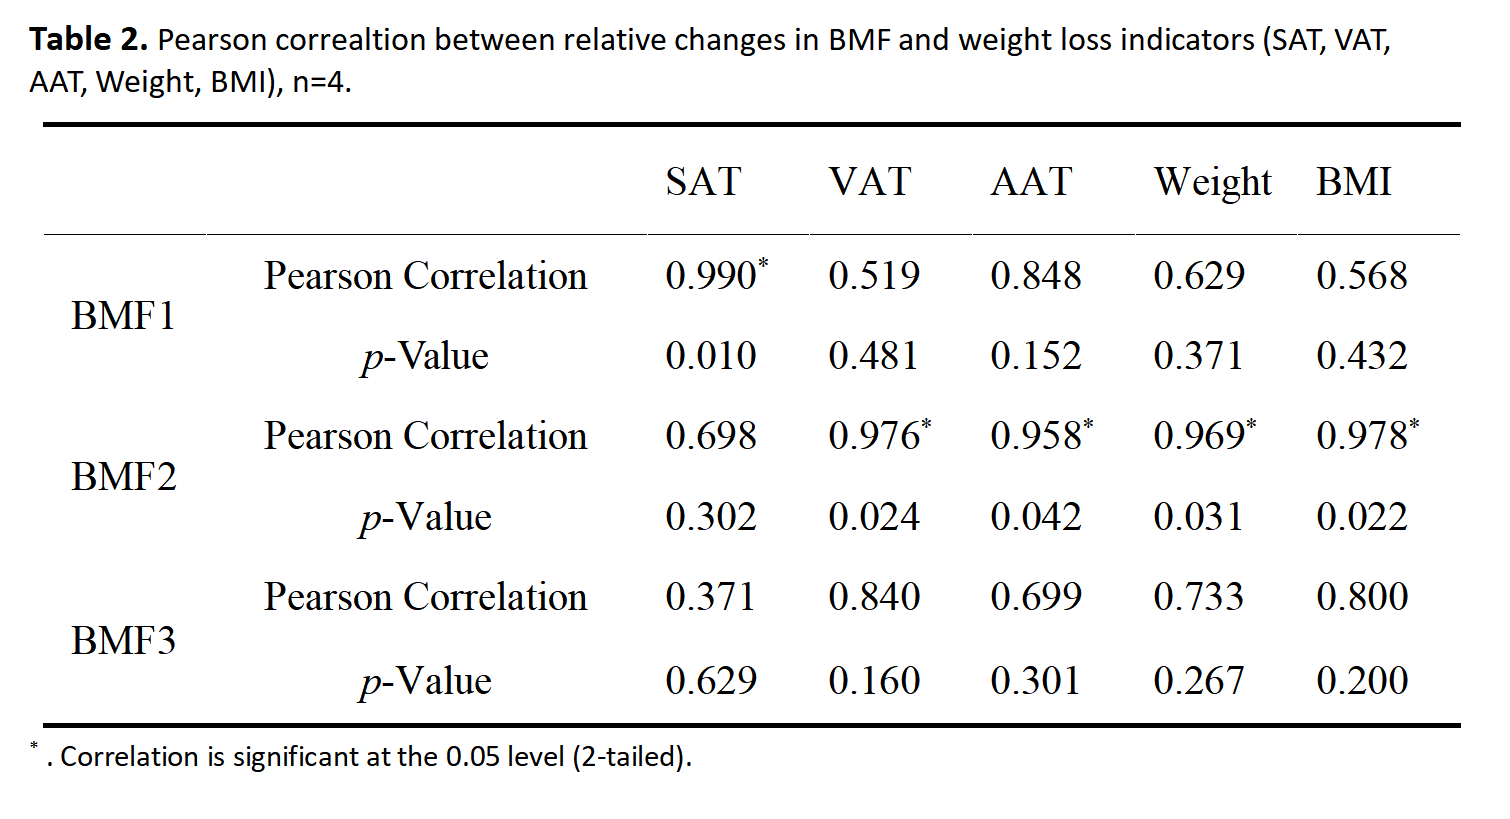
There is a strong correlation between relative changes in BMF1 (BMF of T9-T11) and SAT (Pearson Correlation=0.990, p=0.010). Relative changes in BMF2 (BMF of T12-L2) have strong correlations with Relative changes in VAT (Pearson Correlation=0.976, p=0.024) and AAT (Pearson Correlation=0.958, p=0.042). In addition, strong correlations can be seen between relative changes in BMF2 and weight (Pearson Correlation=0.969, p=0.031) as well as BMI (Pearson Correlation=0.978, p=0.022). It suggests that as SAT decreases after HLC, BMF of T9-T11 decreased correspondingly. The decrease of VAT, AAT, weight, and BMI is closely related to the decrease of T12-L2 BMF.Conclusion
This study demonstrated that the decrease of BMF was associated with reduction of some weight loss indicators (SAT, VAT, AAT, Weight, BMI) after HLC among the population of obese male youth. It is meaningful for multi-dimensional evaluation of weight loss efficacy and exploration of BMF change mechanism. A larger sample size is needed to further confirm our observations.Acknowledgements
No acknowledgement found.References
1. Lauby-Secretan B, Scoccianti C, Loomis D, Grosse Y, Bianchini F, Straif K. Body Fatness and Cancer--Viewpoint of the IARC Working Group. N Engl J Med 2016;375:794-798.
2. Ng M, Fleming T, Robinson M, et al. Global, regional, and national prevalence of overweight and obesity in children and adults during 1980-2013: a systematic analysis for the Global Burden of Disease Study 2013. Lancet 2014;384:766-781.
3. Alberti KG, Zimmet P, Shaw J. The metabolic syndrome--a new worldwide definition. Lancet 2005;366:1059-1062.
4. Gardner CD, Trepanowski JF, Del GL, et al. Effect of Low-Fat vs Low-Carbohydrate Diet on 12-Month Weight Loss in Overweight Adults and the Association With Genotype Pattern or Insulin Secretion: The DIETFITS Randomized Clinical Trial. JAMA 2018;319:667-679.
5. Wang H, Leng Y, Gong Y. Bone Marrow Fat and Hematopoiesis. Front Endocrinol (Lausanne) 2018;9:694.
6. Morris EV, Edwards CM. The role of bone marrow adipocytes in bone metastasis. J Bone Oncol 2016;5:121-123.
7. Cordes C, Dieckmeyer M, Ott B, et al. MR-detected changes in liver fat, abdominal fat, and vertebral bone marrow fat after a four-week calorie restriction in obese women. J Magn Reson Imaging 2015;42:1272-1280.
8. Kim TY, Schwartz AV, Li X, et al. Bone Marrow Fat Changes After Gastric Bypass Surgery Are Associated With Loss of Bone Mass. J Bone Miner Res 2017;32:2239-2247.
Figures