3086
Feasibility Study of T2* Mapping, R2* Mapping and T1 Mapping Technology in the Quantitative Evaluation for Primary Osteoporosis of Lumbar Spine1The First People's Hospital of Shizuishan, Shizuishan, China, 2Philips Healthcare, Beijing, China
Synopsis
The aim of this study was to investigate the feasibility of T2* mapping, R2* mapping and T1 mapping techniques for quantitative assessment of primary osteoporosis of the lumbar spine.The differences and correlation between T2* mapping, R2* mapping and T1 mapping values of patients with osteoporosis group and the normal population were analyzed. The statistical results of our data showed that the T2 values in the osteoporotic group of L3 and L5 vertebrae were greater than the normal group, and the R2* values and T1 values were less than the normal group.
Introduction
Osteoporosis (OP) is a chronic systemic skeletal disease caused by loss of bone mass and damage to bone microarchitecture. It will lead to loss of bone strength and fracture susceptibility, which is common to elderly women. Since patients with osteoporosis are more prone to "fragility fractures", it is important to early and accurate assessment of osteoporosis and appropriate treatment reducing the risk of fracture and improving patients' quality of life. Currently, osteoporosis is diagnosed by quantitative computed tomography(QCT) measuring the bone density, but CT has ionizing radiation and limited ability to diagnose microfractures. MRI can reflect the characteristics of the vertebral body quantitatively which has highly reproducible. The aim of this study was to investigate the feasibility of quantitative assessment of primary osteoporosis of the lumbar spine based on T2* mapping, R2* mapping and T1 mapping techniques.Methods
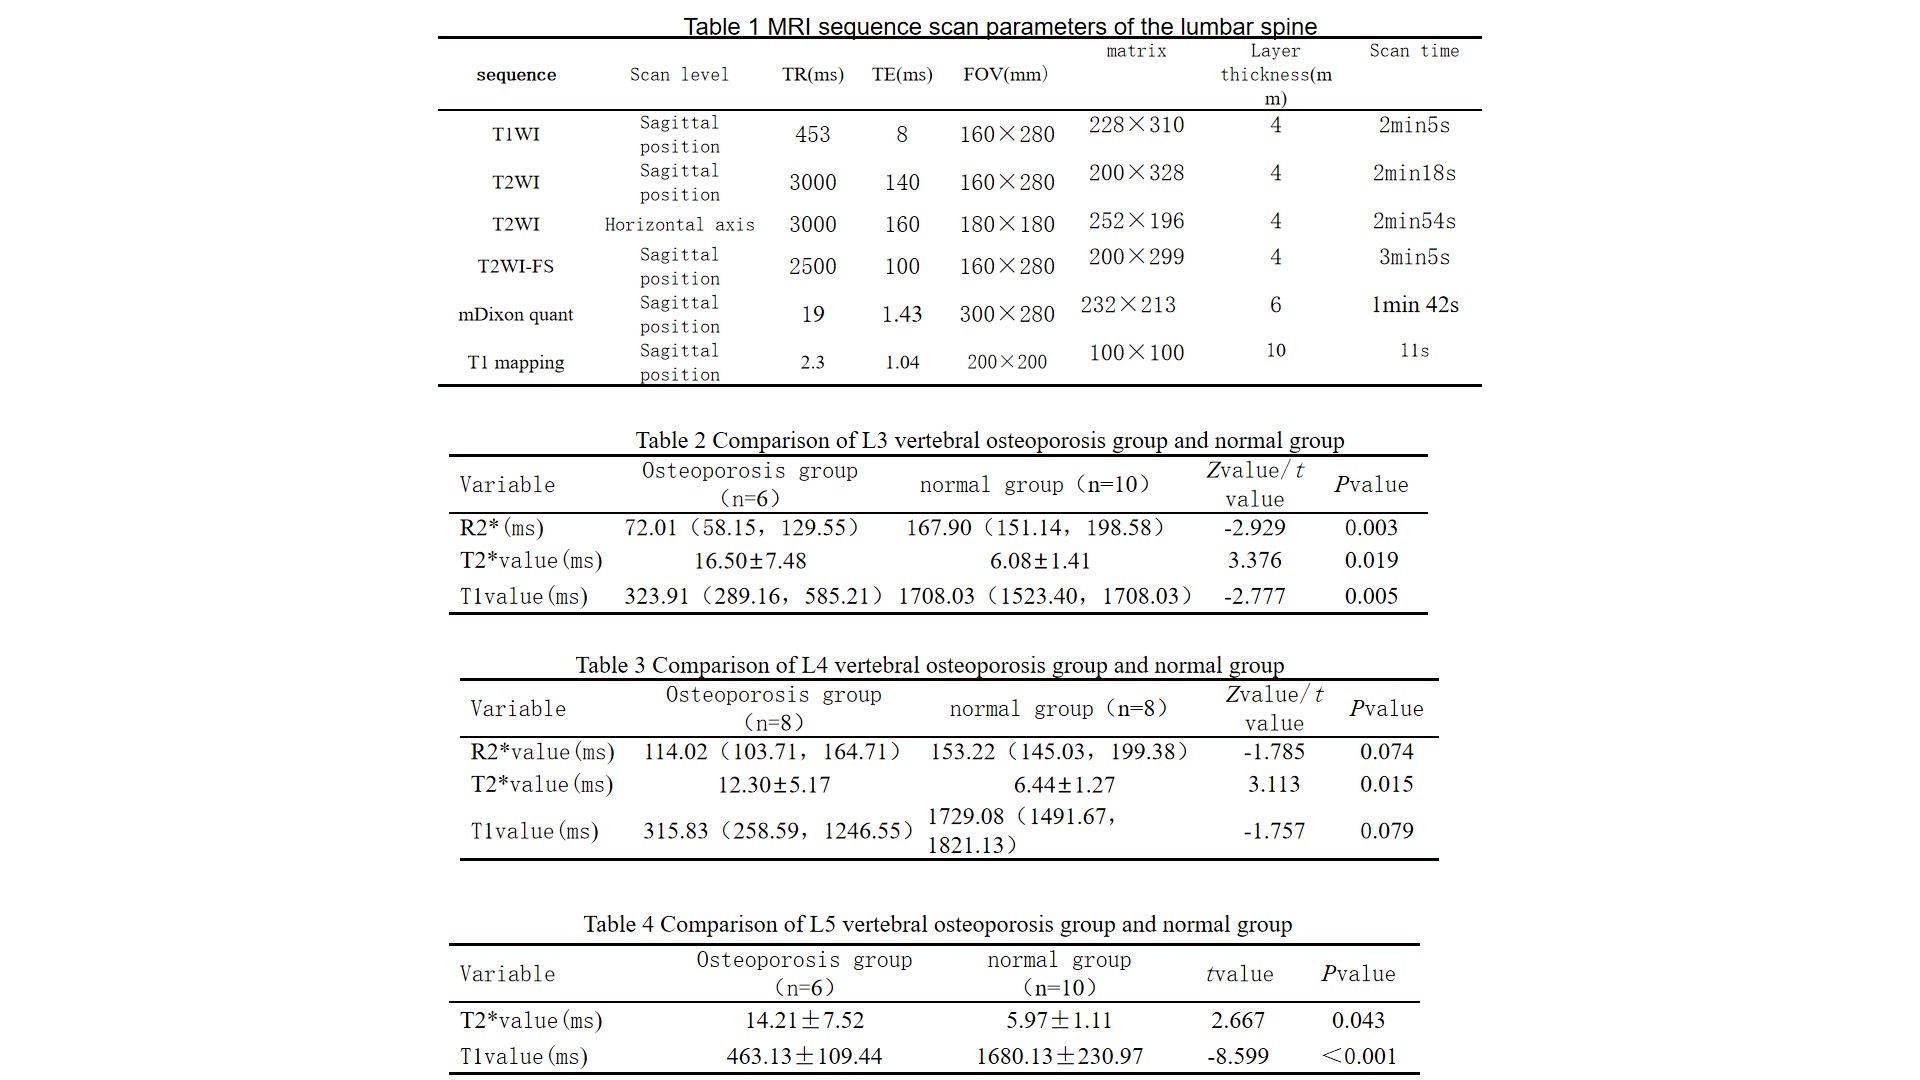
Sixteen patients (age range from 23 to 80 years, 52.56±17.50, 7 males and 9 females) underwent MRI of the lumbar spine for low back pain were prospectively collected from October 2021 to November 2021. All MRI were scanned on a 3.0T MRI (Ingenia, Philips Healthcare) with a 16-channel abdominal coil. The patients were scanned with conventional lumbar MRI sequences and mDixon quant sequences and T1 mapping scans, respectively. mDixon-Quant sequences were performed in sagittal position and were used to reconstruct T2*mapping, R2*mapping, and fat fraction (FF%) images. Look-Locker sequence was used for T1 mapping in median sagittal position. All sequences included L1-L5 vertebrae, and the specific parameters are shown in Table 1. The image is uploaded to the Philips IntelliSpace Portal V9.0 workstation. The FF, R2*, T2* and T1 values of the L3~L5 vertebrae of all patients were measured. Avoid vertebral veins, cortical bones, and bone islands during the measurement, and finally take the average of three measurements. According to the previous literature [1], this group of data defines the vertebral body fat fraction (FF%) ≥ 60.9% as the osteoporosis group, and the vertebral body FF% <60.9% as the normal group. SPSS22.0 was used to analyze whether there were differences in the T1mapping value, R2* value and T2* value of the lumbar vertebrae between the osteoporosis group and the normal group. For continuous variables, the normality of their distribution is tested by the Shapiro-Wilk test. Data obey normal distribution, described by x±S, using independent sample t test; data do not obey normal distribution, described by median (interquartile range), and compare the difference between the two groups using Mann-Whitney U test. All tests used two-sided tests, and P<0.05 was considered statistically significant.Result
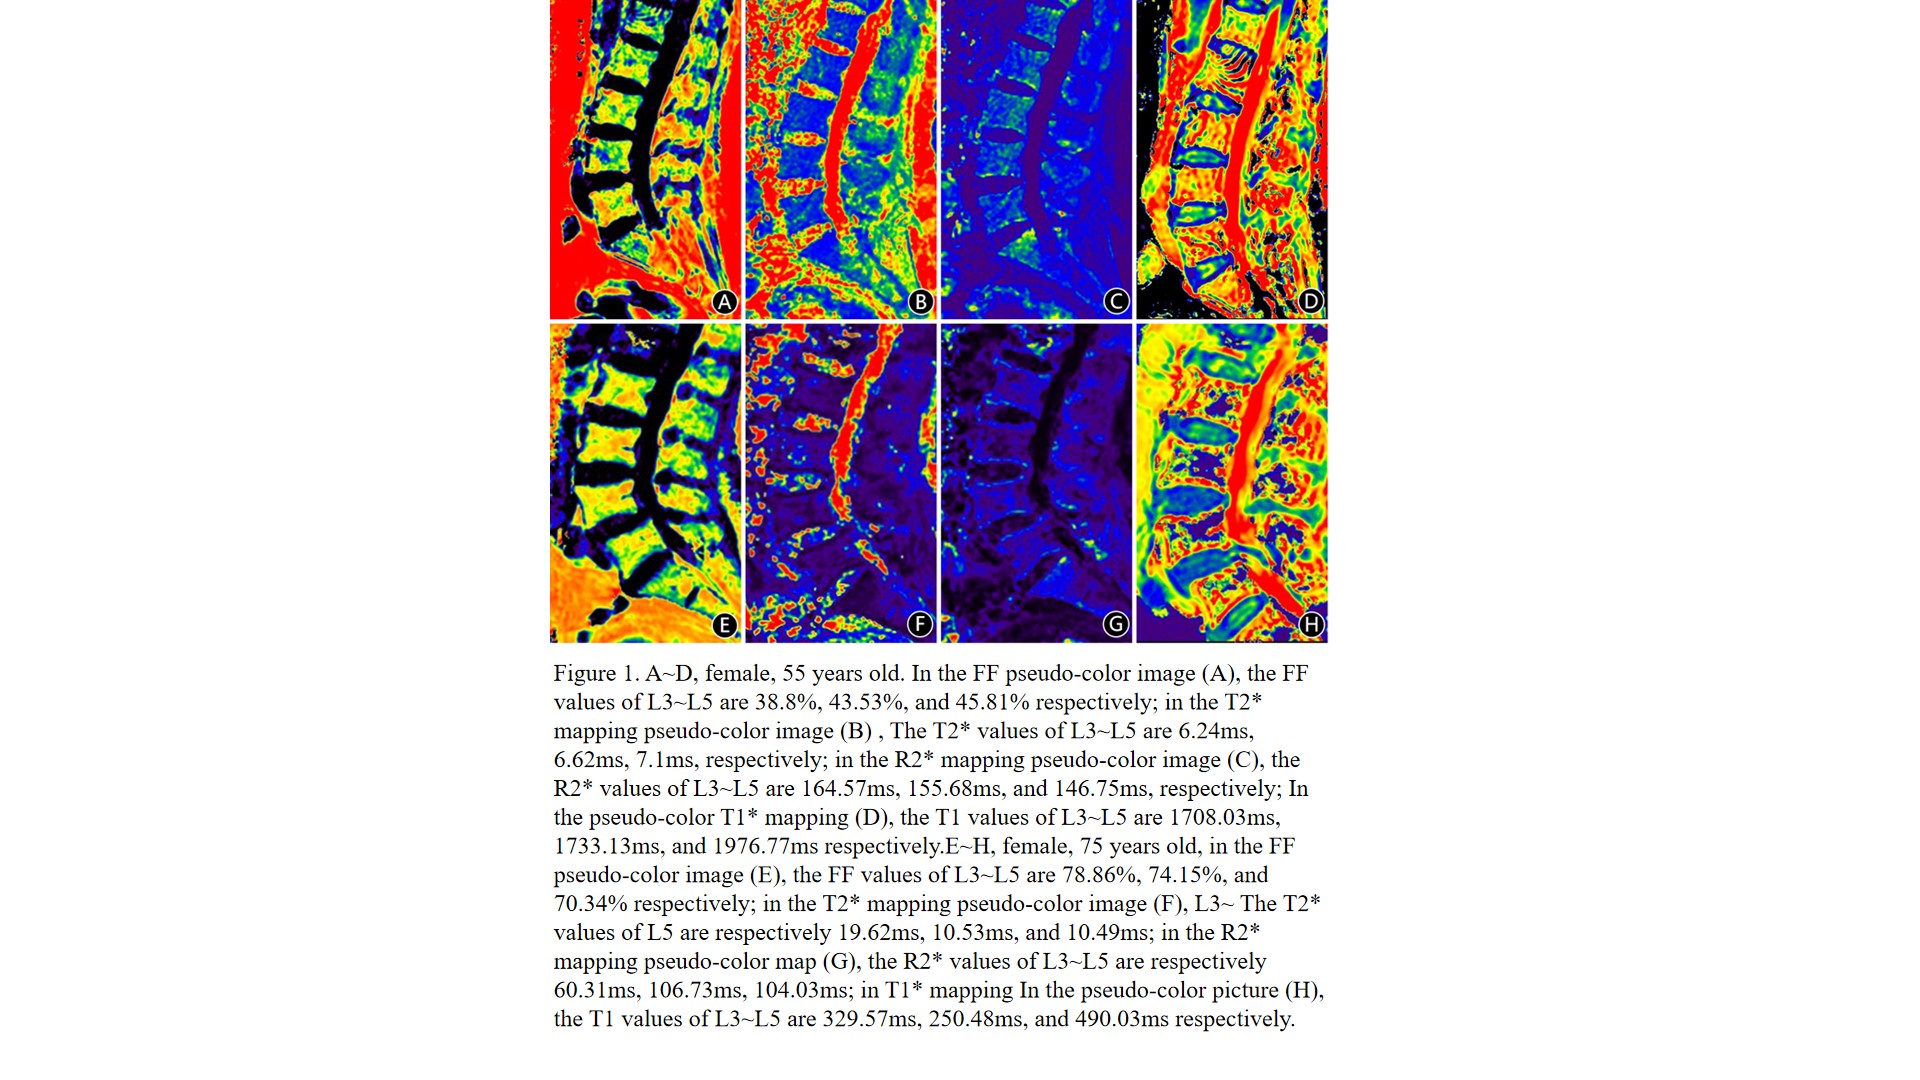
A total of 48 vertebral bodies from 16 patients were included in this group, 20 vertebral bodies from the osteoporosis group and 28 vertebral bodies from the non-osteoporotic group. The R2* and T1 values of the L3 and L5 vertebral osteoporosis group were lower than the normal group, and the T2* value was greater than the normal group. The difference between the two groups was statistically significant (P<0.05, Table 2, Table 4, Figure 1) The T2* value of the L4 vertebral osteoporosis group was greater than that of the normal group, and the difference between the two groups was statistically significant (P<0.05, Table 3).Discusstion
The pure water has a high signal on T2WI and a low signal on T1WI. In this study, mDixon-Quant was used to obtain T2*mapping, R2*mapping, FF maps and Look-locker is used for T1 mapping. The main components of vertebral bone tissue are calcium hydroxyphosphate, yellow bone marrow and red bone marrow. Red and yellow bone marrow can be converted with age. Red bone marrow is composed of about 40% fat, 40% water and 20% protein, while yellow bone marrow is composed of about 80% fat, 15% water and 5% protein [2-3]. Osteoporosis is often accompanied by sparse bone trabeculae. In previous studies, T2* mapping was used to measure the water content of tissues, which reflects the mineral content of bone marrow to a certain extent. The number of trabeculae in the vertebral body is closely related to the spatial geometry[1,4]. This study assess the clinical value of T1 value in osteoporosis.Conclusion
T2* value of the vertebral osteoporosis group was higher than that of the normal group, and the R2* value and T1 value of the osteoporosis group were lower than the normal group. T2* mapping, R2* mapping and T1 mapping technologies are feasible for quantitative assessment of lumbar primary osteoporosis.Acknowledgements
NoneReferences
1. Cuirubi Zhou, Gen Hu, Haixiong Chen, et al. The possibility of MR Dixon, T2 mapping, T2* mapping technology for lumbar osteoporosis[J]. Chinese Journal of CT and MRI,2021,19(09):157-160+179.DOI: 10.3969/j.issn.1672-5131.2021.09.050.
2. Wu HZ,Zhang XF,Han SM et al. Correlation of bone mineral density with MRI T2* values in quantitative analysis of lumbar osteoporosis[J].Arch Osteoporos, 2020, 15(1): 18.DOI: 10.1007/s11657-020-0682-2.
3. Bermeo S, Gu naratnam K, Duque G. Fat and bone interactions[J]. Curr Osteoporos Rep,2014, 12:235 -242. DOI:10.1007/s11914 - 014-0199-y.
4. Guillerman RP. Marrow: red, yellow and bad [J]. Pediatr Radiol, 2013, 43 Suppl 1:S181-S192. DOI:10.1007/s00247-012-2582-0.
Figures