3085
The diagnostic value of dynamic contrast enhancement (DCE-MR) and ZOOmitDWI quantitative parameters for the activity of sacroiliac arthritis1department of radiology, Zhejiang University School of Medicine Sir Run Run Shaw Hospital, Hangzhou, China, 2MR scientific Marketing, Diagnostic Imaging, Siemens Healthineers Ltd, Shanghai, China
Synopsis
The purpose of this study was to evaluate the relationship between magnetic resonance dynamic contrast-enhanced imaging and quantitative parameters of the ZOOMit-DWI technique and the activity of sacroiliac arthritis. Dynamic enhanced MRI microvascular permeability parameters can visually reflect the microcirculatory perfusion status of the subchondral bone marrow region of the sacroiliac joint, and its diagnostic efficacy is better than DWI-ADC. Sacral Ktrans values and sacral iAUC values are highly correlated with ASDAS-CRP scores, which can be used as important quantitative indicators for assessing the inflammatory activity of the sacroiliac joint.
Background
Arthritis is a chronic inflammatory rheumatoid system disease, accompanied by or not accompanied by spinal strain, but also accompanied by peripheral inflammation, the progression of the disease significantly affects the health and quality of life of patients. Clinically there is no gold standard to assess the activity of inflammation of the joints, and pathological biopsy is difficult to obtain. The current assessment of the disease is mainly based on clinical disease activity scores (DAS), including BASDAI, ASDAS-ESR and ASDAS-CRP. MRI plays an important role in the diagnosis and monitoring of patients with arthritis.Purpose
In order to evaluate the detection efficacy of DCE semi-quantitative and quantitative parameters and ADC from ZOOMit - DWI in inflammation during joint activity.Material and methods
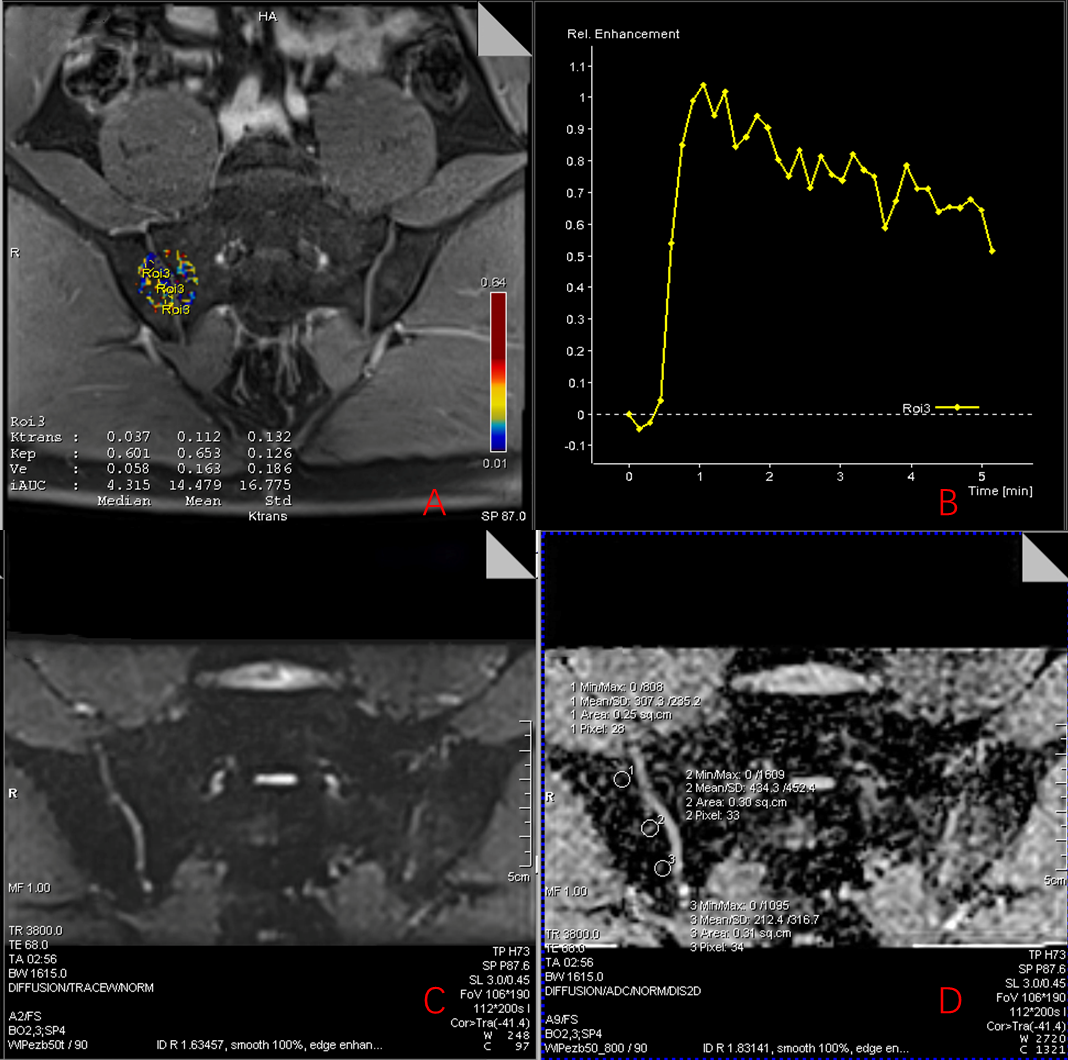
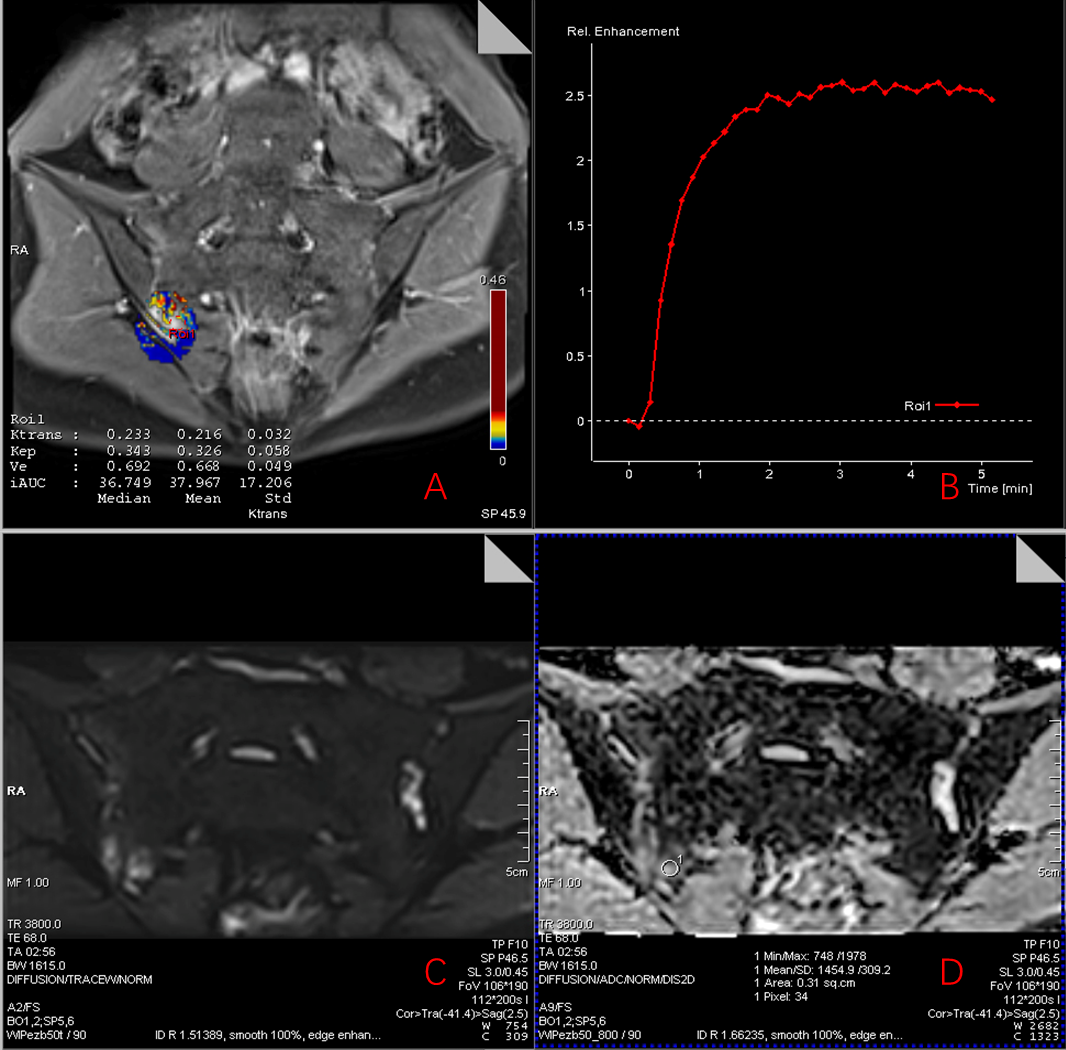
71 patients with Sacroiliac arthritis(age:36.5±9.7, male:46, female:25)and 8 health volunteers(age: 30±10, male:7, female:1)were collected in this study. All patients were rated ASDAS-CRP and patients were divided into the disease activity group (ASDA-CRP ≥ 2.1, 36 cases, age: 37.78≥±9.957) and the stable disease group (ASDA-CRP ≤2.1, 35 cases, 37.54< ±11.083). All patients underwent magnetic resonance imaging (MRI) studies including rFOV DWI and DCE sequences at 3T (MAGNETOM Skyra, Siemens Healthcare, Erlangen, Germany) with a 18 channel body coil. The parameters of those two sequences were as follows: rFOV(TR:3800 ms, TE:68ms, FOV:200×112cm, Resoluation:120×120, Slice thickness: 3mm, b value:50, 800 s/mm2, TA:2min56s); DCE(TR:4.5ms, TE:1.95ms, FOV:192×192cm, Resoluation:284×258, Slice thickness:3mm, FA:9°,TA: 5min20s). The apparent diffusion coefficient (ADC) values, Semi-quantitative parameters (TTP, SImax, SI0) and Pharmacokany dynamics parameters (Ktrans, Kep, Ve, iAUC) were derived and the mean, standard deviation (SD) was calculated. All images were post-processed via Siemens Syngovia workstation (VE40B; Siemens AG, Berlin and München, Germany).The perfusion time-signal intensity curve (TIC) was plotted by Syngo MeanCurve, and Fenh and Senh were calculated. Fenh(%)=(SImax-SIo)×100/ SIo Senh(%/min)=( SImax-SIo)×100/ (SIo×Tmax) SImax is the maximum signal strength after enhancement, SIo is the signal strength before enhancement, and Tmax is the time required to reach SImax.Results:
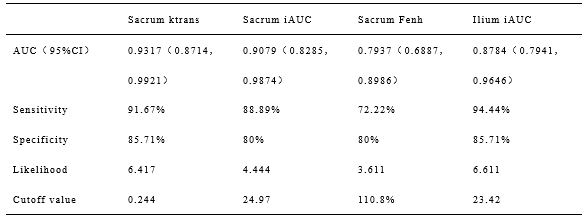
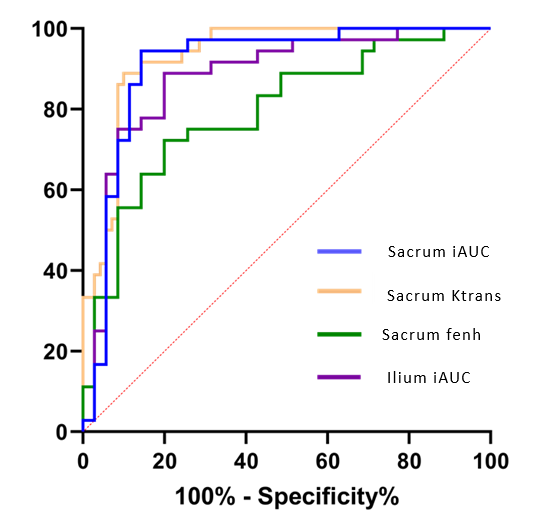
The results of this study showed that the area under the ROC curve for sacral Ktrans, iAUC and Fenh and iliac iAUC were 0.9317, 0.9079, 0.7937 and 0.8784, respectively, with cutoff values of 0.244, 24.97, 110.8% and 23.42, respectively.Conclusion
DCE-MRI parameters as biomarkers of inflammatory activity in the sacroiliac joint may provide a potentially valuable method for the accurate diagnosis and assessment of sacroiliac arthritis and may assist in the development of treatment plans.Acknowledgements
NoneReferences
[1] Siebert S. Frequency and characteristics of disease flares in ankylosing spondylitis[J]. RHEUMATOLOGY, 2010, 49(5): 929-932.
[2] Stone M A, Pomeroy E, Keat A, et al. Assessment of the impact of flares in ankylosing spondylitis disease activity using the Flare Illustration[J]. RHEUMATOLOGY, 2008.
[3] Roxanne C, Sinead B, Michael D, et al. Severe flare as a predictor of poor outcome in ankylosing spondylitis: a cohort study using questionnaire and routine data linkage[J]. RHEUMATOLOGY, 2015,(9): 1563.
[4] Song J, Zhou L, Chen L, et al. Comparison of ASDAS,RAPID3 and BASDAI in assessing disease activitiy of patients with ankylosing spondylitis[J]. Academic Journal of Second Military Medical University, 2015, 36(8): 909-913.
[5] Braun J, Baraliakos X. Imaging of axial spondyloarthritis including ankylosing spondylitis[J]. ANNALS OF THE RHEUMATIC DISEASES, 2011, 70 Suppl 1: i97-i103.
Figures