3082
Quantification of bone marrow component change using chemical shift-encoded MRI in Ankylosing Spondylitis patients in different stages1Department of Radiology, Huazhong University of Science and Technology Union Shenzhen Hospital, Shenzhen, China, 2MR Research, GE Healthcare, Bejing, China, 3Department of Emergency, Huazhong University of Science and Technology Union Shenzhen Hospital, Shenzhen, China
Synopsis
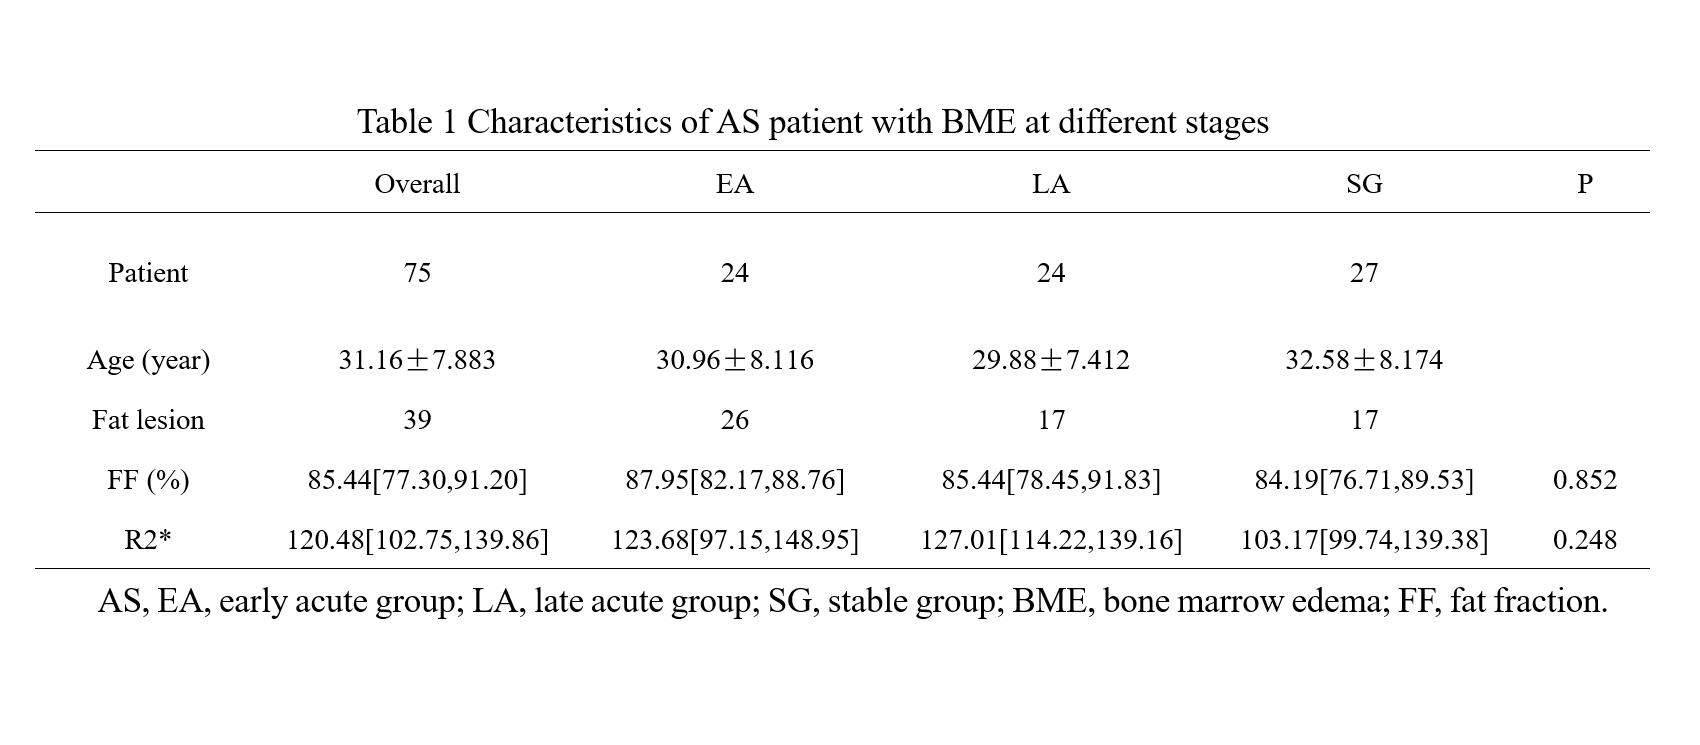
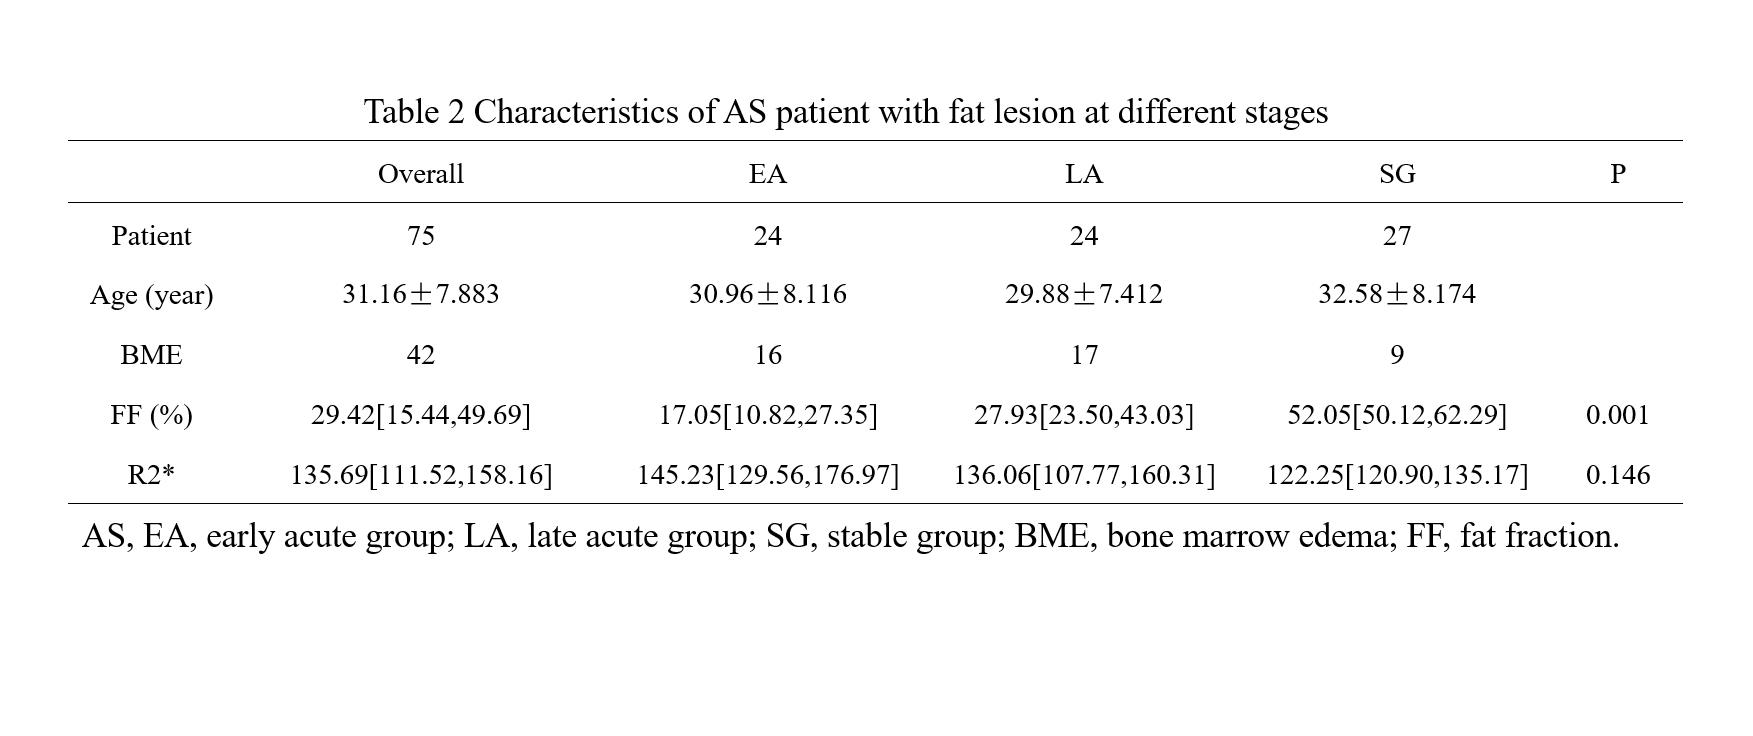
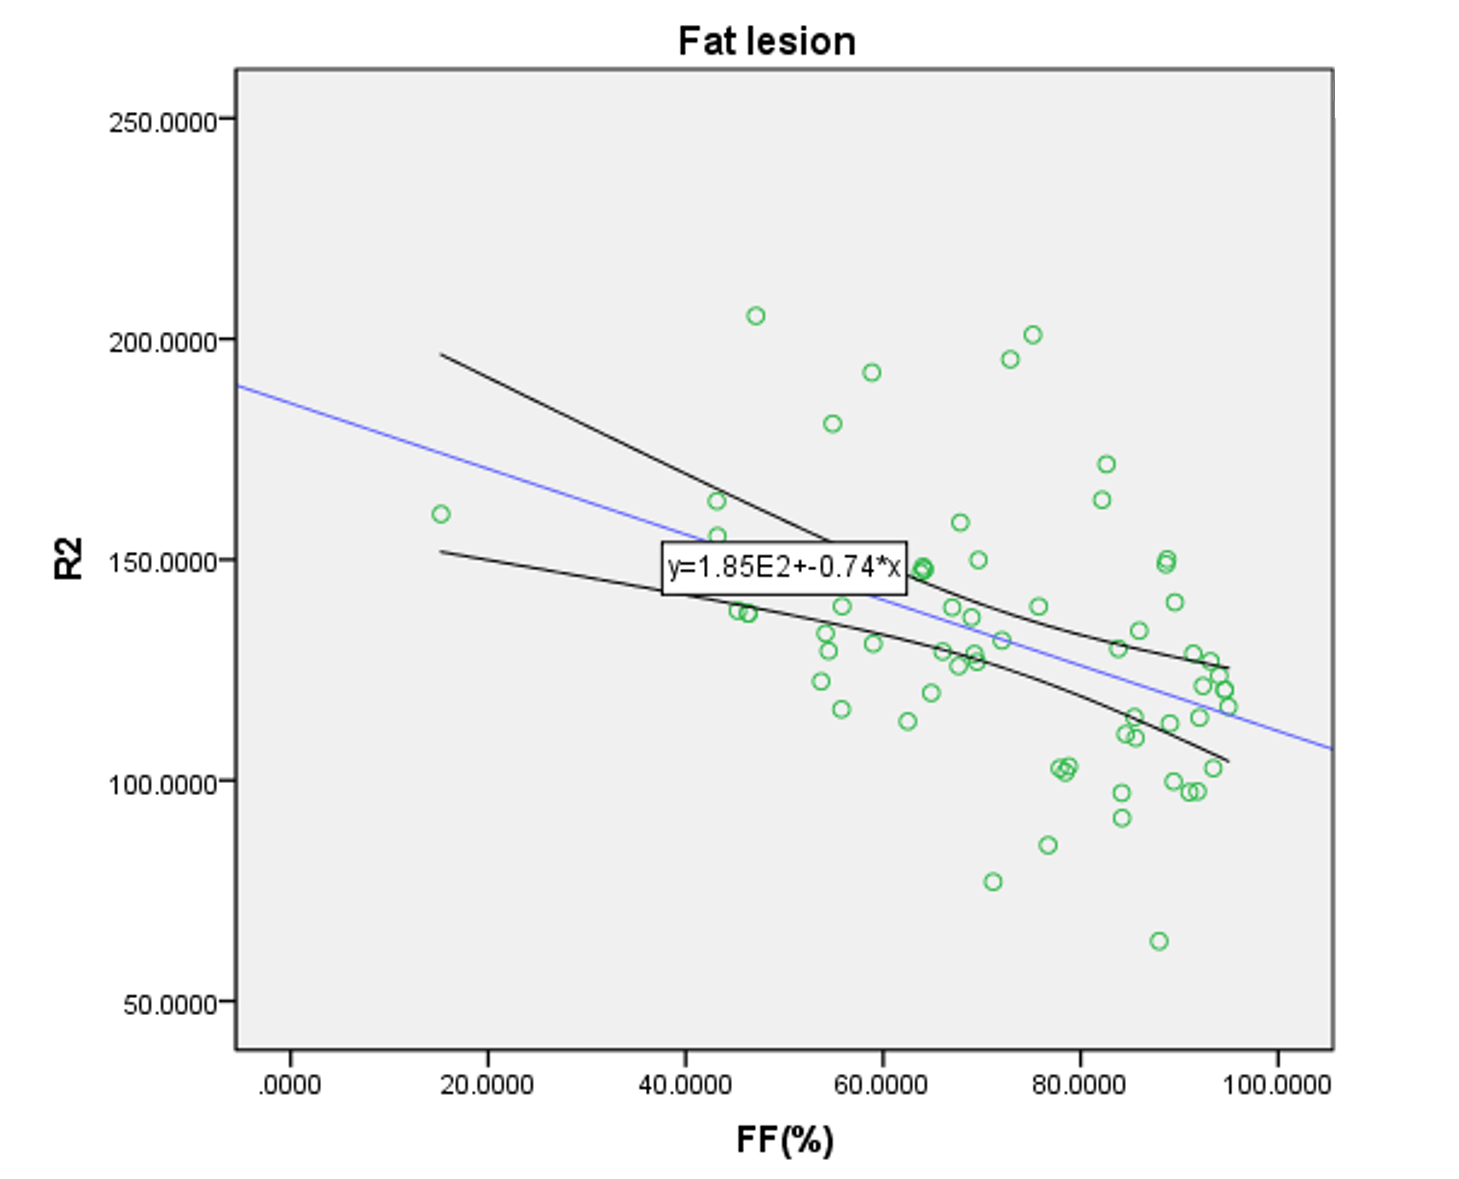
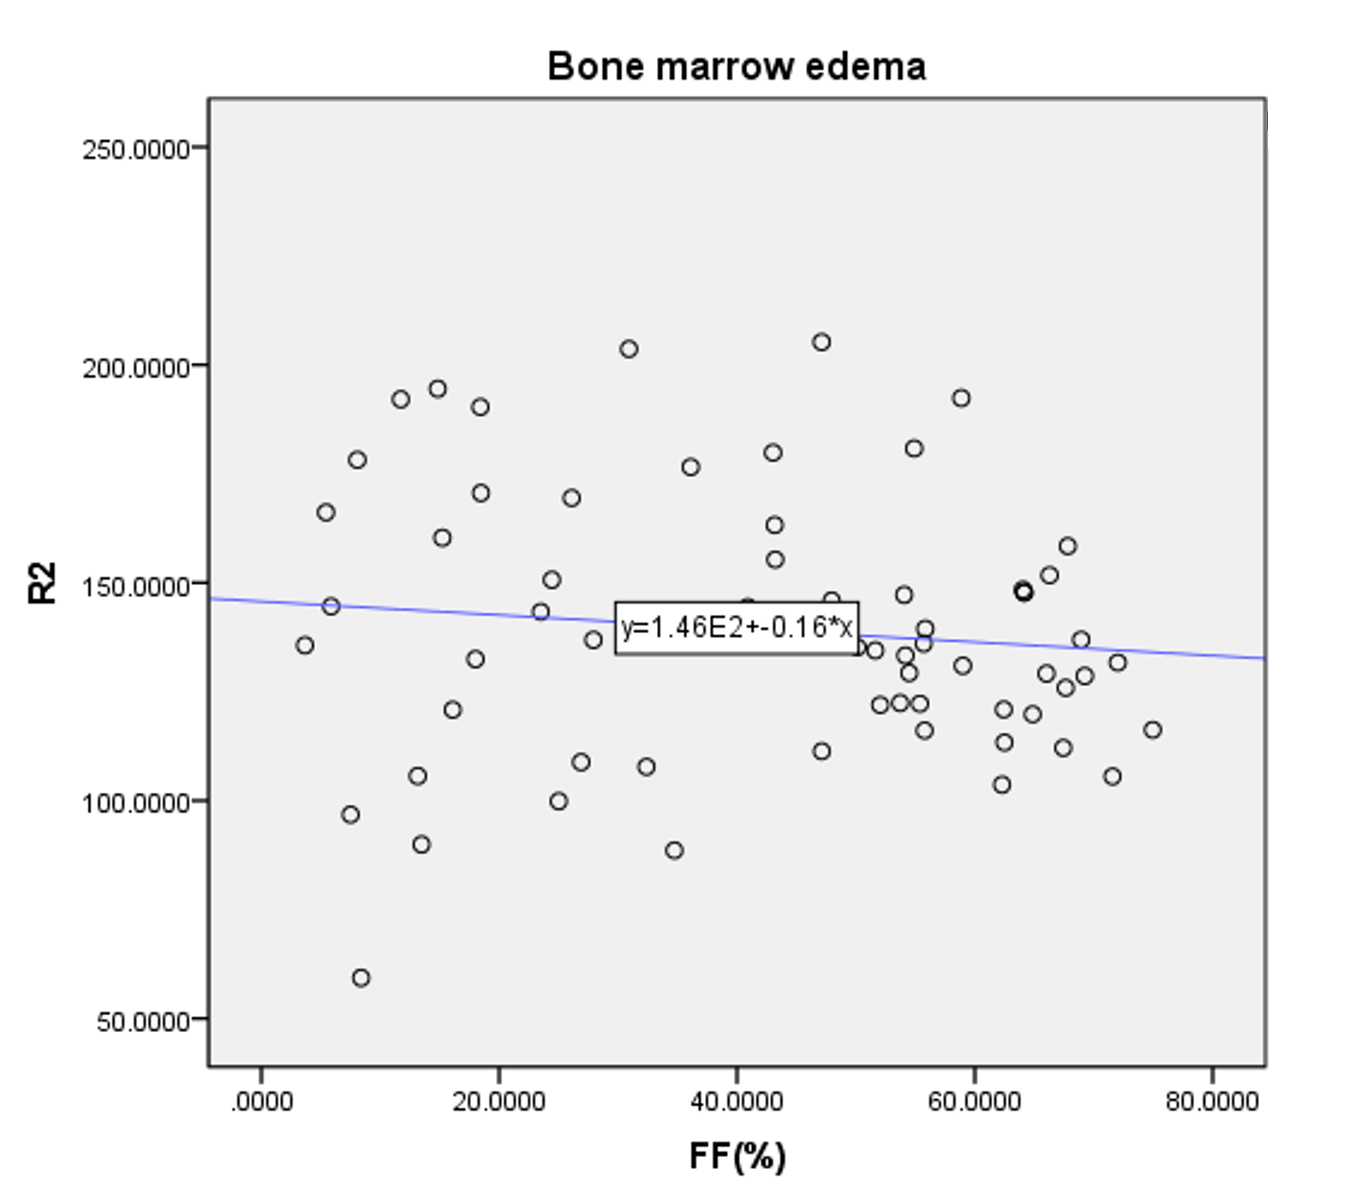
Quantification of fat fraction (FF) and R2* in areas of bone marrow edema (BME) and fat metaplasia in different stages Ankylosing Spondylitis (AS). 75 AS in 3 different stage (early acute group, late acute group, stable group), 42 BME and 39 fat metaplasia were detected. Difference of FF, R2* in BME and fat metaplasia in different stages were compared and relationship between FF and R2* were analyzed. Result showed R2* in fat metaplasia, but not in BME, is significantly negative with FF. FF and R2* measurements can quantitatively analyze bone marrow component change in AS.
Introduction
Sacroiliac joint inflammation-sacroiliitis is the final irreversible outcome of Ankylosing Spondylitis (AS) with an insidious progression posing major quantitative evaluative challenges. As an autoimmune disease, the bone marrow component of trabecular bone, fat changed gradually over the progression. Admittedly, both new bone formation and bone destruction are key features of AS[1] . On the contrary, AS patients are at great risk of fractures due to the presence of adipocytes and bone loss, moreover, metaplasia is assumed to be a key intermediary step between inflammation and formation of new bone[2]. Yet bone metabolic changes in AS remain unclear. Taking advantage of significant MR technical advances in reliable quantification of marrow composition. Recent osteoporosis and fat‐water‐bone phantom modeling researches[3, 4] have focused on the relationship between bone marrow density (BMD) and fat component, but not yet widely used in AS. Our aim is to evaluate the feasibility of quantification of FF, R2*as makers of bone marrow composition changes in the AS in different stages and explore the correlation between FF and R2*.Methods
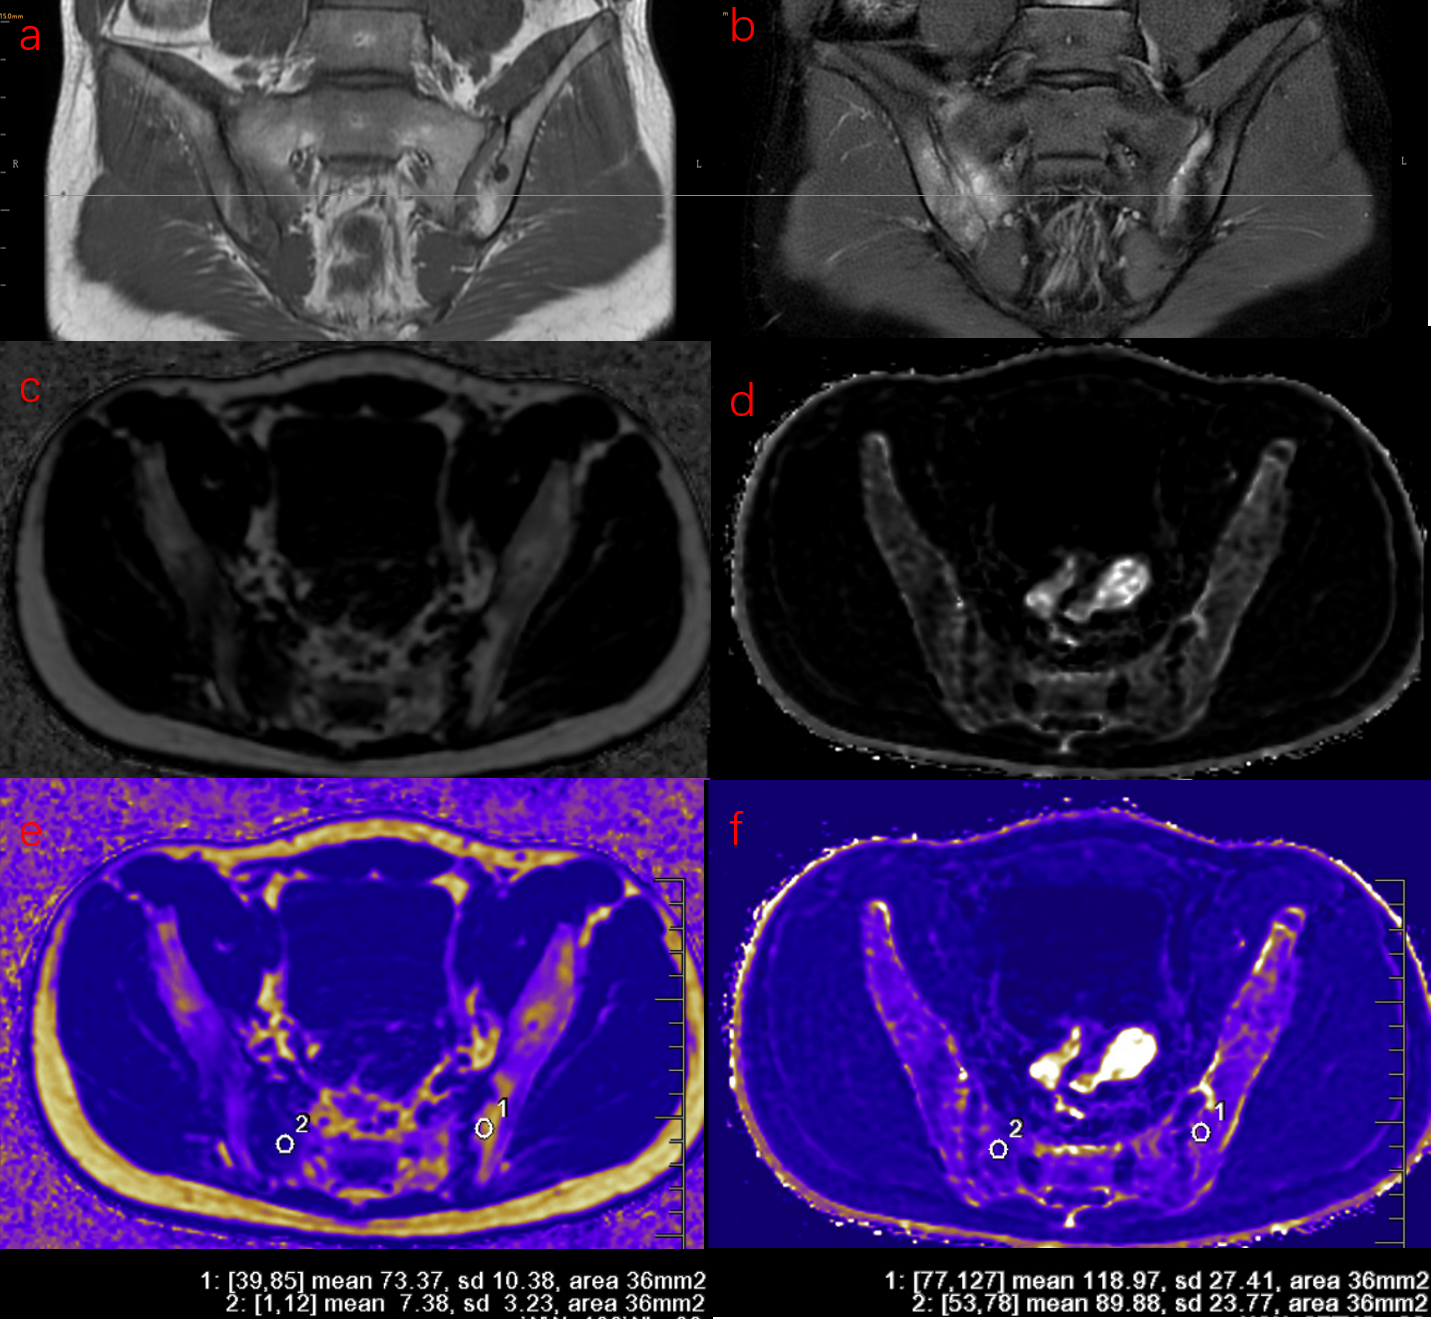
75 AS patients (30 males and 45 females, with mean age 31.1y) underwent IDEAl-IQ of the sacroiliac joints at 3T GE MRI. AS patients were classified into acute group (AG) (25 males and 24 females, with mean age 30.4y) and stable group (SG) (13 males and 14 females, with mean age 32.6y) according to Bath ankylosing spondylitis disease activity index (BASDAI) score with C-reactive protein (CRP). Of these acute cohort, the first diagnosed acute patients without radiographic damage nor intervention therapy were defined as the early acute group (EA) (9 males and 15 females, with mean age 30.0y), while others as the late acute group (LA) (9 males and 15 females, with mean age 32.6y). Patients without BME, fat metaplasia nor lack of BASDAI scores, CRP were excluded. Finally, 42 patients with bone marrow edema (BME) (16 from EA, 17 from LA, 9 from SG) and 39 patients with fat metaplasia (9 from EA, 17 from LA, 13 from SG) were included. Difference of FF, R2* in BME and fat metaplasia among groups were compared and relationship between FF and R2* were analyzed. Data statistics were analyzed using Kruskal-Wallis test and Spearman correlation test.Results
Only FF in BME was significantly different among patient groups (p=0.001), with median (interquartile range (IQR)) FF values were 17.05% (10.82%–27.35%), 27.93% (23.50%–43.03%), 52.05% (50.12%–62.29%) in EA, LA and SG respectively. In fat metaplasia, there was no significantly different parameter among patient groups, with median FF value of overall fat metaplasia was 85.44% (77.30%–91.20%), FF of fat metaplasia significant negative correlation with R2*(p=0.00, r=-0.488).Discussion
BME always treated as hallmark of acute stage[1], but we detected subchondral mild hyperintensity lesion on T2WI sequences with FS as uncomplete resolved edema in SG, the reason for that was we classified groups totally according to BASDAI and CRP. FF of BME in EA was significantly lower than that in LA and SG. Previous study[5] investigated quantification of FF in in normal bone marrow, bone marrow edema, and fat metaplasia in AS and suggested FF can help to determine radiologic progression. In our study of FF in BME in different active inflammation stages showed the proportion of fat deposition was increased as the BME resolution progressed. It supported the hypothesis that fat metaplasia is usually assumed to be an inherent characteristic of the tissue response following resolution of inflammation[1]. For fat metaplasia, we also detected fat metaplasia either in the adjacent subchondral bone marrow or around edema or erosion in EA, though fat metaplasia was treated as established feature of AS in the later period. But there was no significant deference in FF of fat metaplasia among groups, however, we observed more extensive fat metaplasia in patients at late acute stage and stable stage. FF in fat metaplasia was negative related to R2*. Fat metaplasia is presumably an intermediate stage between active inflammation and new bone formation[6]. Recently new immunological discoveries revealed adipocytes as a secretory and metabolically active organ contributing to bone metabolism[7]. Fat metaplasia correspond to presence of adipocytes, resulting to change of cellular homeostasis towards diminution of osteoclasts in the bone marrow of patients with AS, because marrow adipocytes and osteoblasts originate from the same bone marrow mesenchymal stromal cell which terminally differentiated to different cells. Previous osteoporosis studies[8, 9] suggest that the relationship between BMD and R2* is approximately linear. And Bray et al[4] investigated the BMD and R2* in a phantom containing different proportion of fat, water, and trabecular bone, and found a positive correlation between BMD and R2*. Since bony trabeculae are more diamagnetic than the surrounding marrow make the rate of signal decay R2* increased. Bray[4] found R2* was significantly reduced in areas of fat metaplasia in AS patient. In our study, we found only FF in fat metaplasia, but not FF in BME, was significant related to R2*, indicating that R2* was also influenced by other bone marrow composition. The influencing factors need to be further studied.Conclusion
FF and R2* measurements can quantitatively analyze bone marrow component change in AS.Acknowledgements
The author would like to thank the staff of department of Radiology, Department of Rheumatology and Department of Pain in Shenzhen Hospital of Huazhong University of Science and Technology for their help in case screening and data collection.Thanks to Dr. Qian for his technical support in data analysis and measurement.
This work was supported by the Shenzhen Nanshan District Science and Technology Project (NS129).
References
[1] MAKSYMOWYCH W P, LAMBERT R G, OSTERGAARD M, et al. MRI lesions in the sacroiliac joints of patients with spondyloarthritis: an update of definitions and validation by the ASAS MRI working group [J]. Ann Rheum Dis, 2019, 78(11): 1550-1558.
[2] MAKSYMOWYCH W P, WICHUK S, CHIOWCHANWISAWAKIT P, et al. Fat metaplasia on MRI of the sacroiliac joints increases the propensity for disease progression in the spine of patients with spondyloarthritis [J]. RMD Open, 2017, 3(1): e000399.
[3] LEONHARDT Y, GASSERT F T, FEUERRIEGEL G, et al. Vertebral bone marrow T2* mapping using chemical shift encoding-based water-fat separation in the quantitative analysis of lumbar osteoporosis and osteoporotic fractures [J]. Quant Imaging Med Surg, 2021, 11(8): 3715-25.
[4] BRAY T J P, BAINBRIDGE A, PUNWANI S, et al. Simultaneous Quantification of Bone Edema/Adiposity and Structure in Inflamed Bone Using Chemical Shift-Encoded MRI in Spondyloarthritis [J]. Magn Reson Med, 2018, 79(2): 1031-1042.
[5] KOO B S, SONG Y, SHIN J H, et al. Evaluation of disease chronicity by bone marrow fat fraction using sacroiliac joint magnetic resonance imaging in patients with spondyloarthritis: A retrospective study [J]. Int J Rheum Dis, 2019, 22(4): 734-741.
[6] MAKSYMOWYCH W P, WICHUK S, CHIOWCHANWISAWAKIT P, et al. Fat metaplasia and backfill are key intermediaries in the development of sacroiliac joint ankylosis in patients with ankylosing spondylitis [J]. Arthritis Rheumatol, 2014, 66(11): 2958-2967.
[7] TENCEROVA M, FERENCAKOVA M, KASSEM M. Bone marrow adipose tissue: Role in bone remodeling and energy metabolism [J]. Best Pract Res Clin Endocrinol Metab, 2021, 35(4): 101545.
[8] MACEWAN I J, GLEMBOTSKI N E, D'LIMA D, et al. Proton density water fraction as a biomarker of bone marrow cellularity: validation in ex vivo spine specimens [J]. Magn Reson Imaging, 2014, 32(9): 1097-1101.
[9] KWACK K S, LEE H D, JEON S W, et al. Comparison of proton density fat fraction, simultaneous R2*, and apparent diffusion coefficient for assessment of focal vertebral bone marrow lesions [J]. Clin Radiol, 2020, 75(2): 123-130.
Figures