3081
Assessment of idiopathic inflammatory myopathy using muscle T2 mapping segmented by Deep Anatomical Federated Network (DAFNE)1Radiology, Peking Union Medical College Hospital, Beijing, China, 2University Hospital Basel, Basel, Switzerland, 3Siemens Healthcare Ltd., Beijing, China, 4Siemens Healthcare AG, Lausanne, Switzerland, 5Lausanne University Hospital and University of Lausanne, Lausanne, Switzerland, 6École Polytechnique Fédérale de Lausanne (EPFL), Lausanne, Switzerland
Synopsis
Idiopathic Inflammatory Myopathy (IIM) is a group of immune-mediated myopathies, with high morbidity and mortality. Prior work showed that dedicated accelerated T2 mapping of bilateral thighs can be performed within 3 minutes at high resolution and can detect IIM-induced muscle inflammation. However, manual drawing methods to delineate regions of interest are subject to sampling errors. This study investigated the first utility of a fully automated deep-learning method for segmentation of T2 maps in 64 patients with IIM against healthy controls, with results confirming its feasibility, accuracy, and efficiency.
Background and Purpose
T2 mapping quantitatively characterizes muscle inflammation in patients with idiopathic inflammatory myopathy (IIM) [1-2]. However, manual drawing methods to delineate regions of interest are subject to sampling errors. This study investigated the utility of T2 mapping segmented by the Deep Anatomical Federated Network (DAFNE), including a quantitative assessment of patient data.Methods
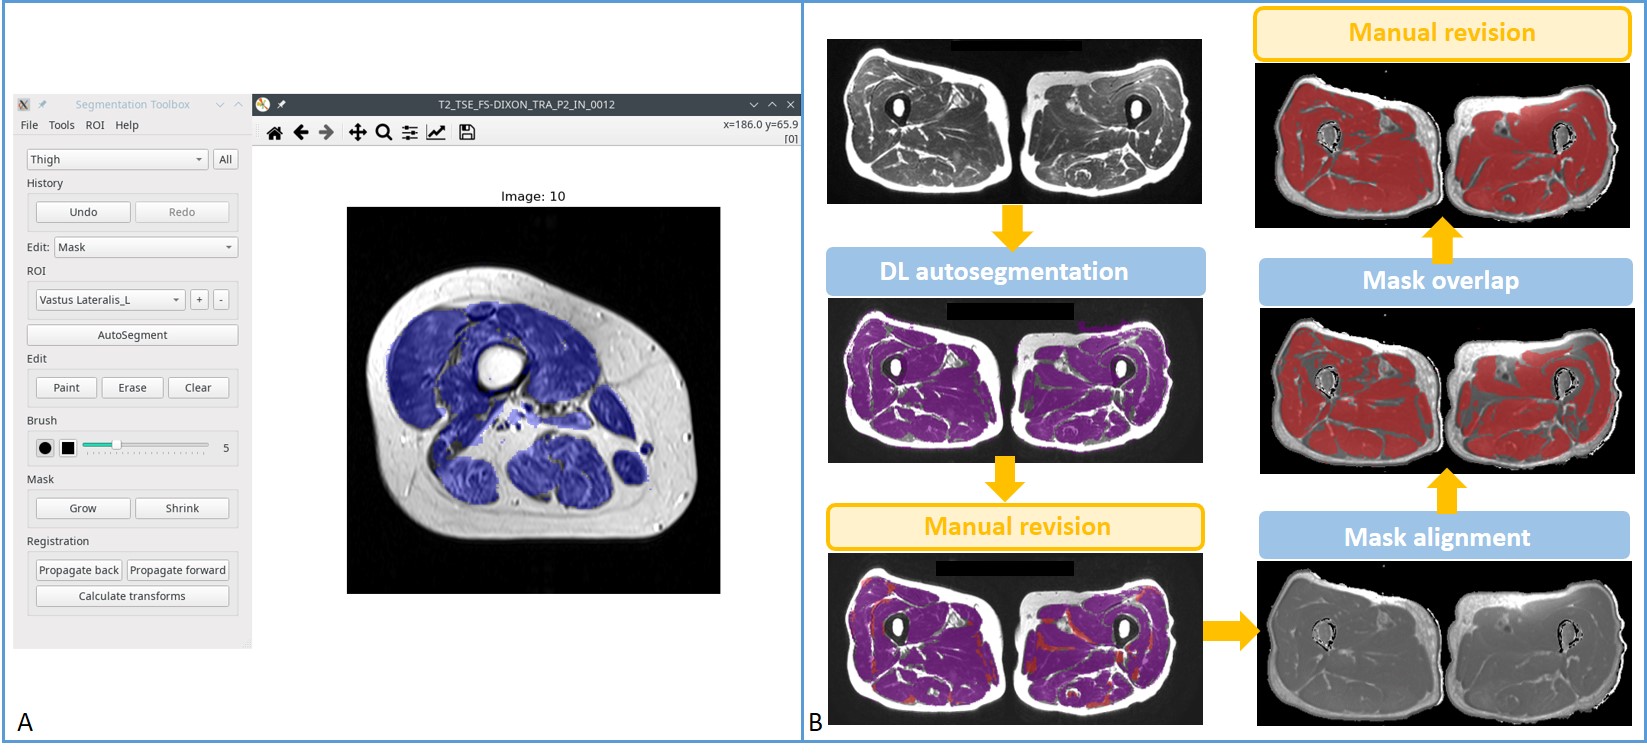
A total of 64 patients with IIM and 10 healthy volunteers underwent conventional MRI including DIXON and T2 mapping of bilateral thighs using a 3T MR scanner (MAGNETOM Skyra, Siemens Healthcare, Erlangen, Germany). The cohort included 27 patients with DM, 29 with PM, and 8 with ASS; there were 26 males and 38 females; mean age was 44.3 years (range: 19–72 years); their mean disease duration was 22.2 months (range: 1–144 months). The ten volunteers consisted of one male and nine females with a mean age of 36.6 years (range: 25–63 years). Dedicated axial T2 mapping was obtained with chemical-shift-selective fat saturation using a prototype sequence (Siemens Healthcare, Erlangen, Germany). T2 mapping was accelerated by a previously reported technique [3], GRAPPATINI, allowing for block-based Cartesian undersampling in k-space. The DIXON in-phase images were used as the structural images for the automated segmentation performed using DAFNE (Fig. 1), a dedicated software based on a pretrained convolutional neural network and implementing incremental and federated learning for continuous adaptation and improvement. This segmentation was saved as masks which were then imported and matched to the corresponding slices of T2 maps by the alignment module, yielding muscle T2 values of both thighs in a fully automated fashion. In addition, muscle strength of lower extremities of patients was graded (range: 0–5) by a rheumatologist. Serum myositis-specific autoantibodies (MSA) and serum muscle enzymes including creatine kinase (CK), alanine aminotransferase (ALT), aspartate aminotransferase (AST), and lactate dehydrogenase (LDH), were measured. Moreover, a radiologist evaluated chest high-resolution computed tomography (HRCT) images to determine whether there was interstitial lung disease (ILD) and further graded the severity and extent of ILD as previously described [4]. For statistically analysis, T2 values were compared between patients and volunteers, and T2 values of patients were further analyzed with clinical findings, serum muscle enzymes, MSA, and the score of ILD.Results
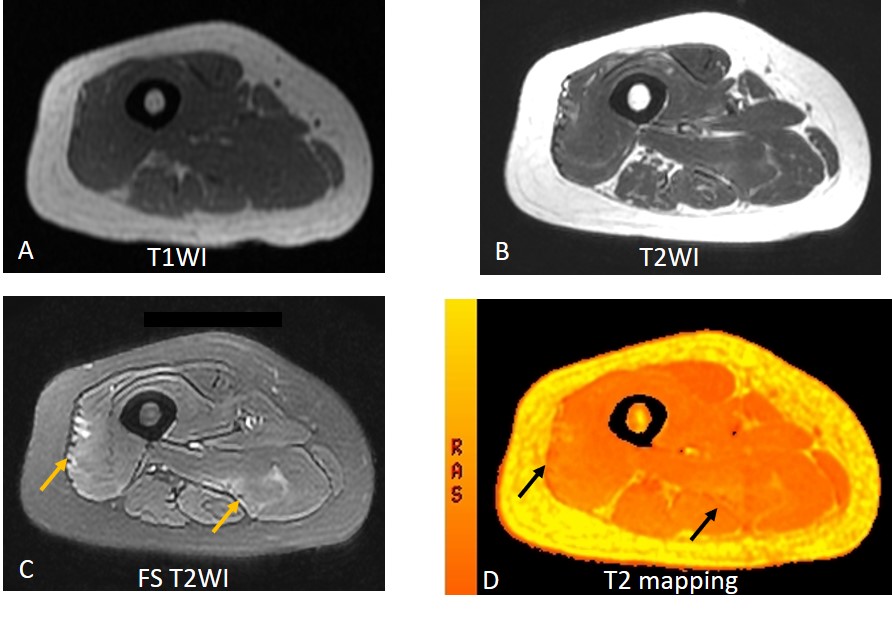
T2 values segmented by DAFNE differentiate diseased muscles of IIM from healthy controls (47.4±9.0 ms vs 33.9±0.9 ms, P < 0.001). The Area Under the Curve (AUC) was 0.986 (p < 0.001) with a cut-off value of 36.4 ms (sensitivity 96.9%, and specificity 100%). In patients, muscle T2 value positively correlated with CK and AST (p= 0.026 and 0.002, respectively), while the correlation with ALT and LDH had no statistical significance (p= 0.096 and 0.116, respectively). Of note, the T2 map detected muscle disease even in patients with normal muscle enzyme levels (Fig. 2). From HRCT results, 31 patients (48%, 31/64) were found to have IIM-associated ILD, while no honeycombing was observed; T2 values were found to be uncorrelated with ILD (P = 0.391). Additional subgroup analysis revealed no differences in T2 values of patients with impaired muscle strength of lower extremities, MSA, Antisynthetase syndrome, malignancy or death (all P > 0.05).Discussion and Conclusions
Muscle weakness, the most typical characteristic of IIM, develops in a subacute way. Thus, T2 mapping, with its ability to detect early symptoms and quantify muscle inflammation, is useful for the diagnosis and monitoring of the disease [5]. Compared to manual measurements, muscle T2 measurement based on DAFNE segmentation is more accurate, efficient and cost-effective, because all measurements can be taken simultaneously and automatically, reducing the error rate considerably. In conclusion, T2 mapping of thigh muscle using automatic DAFNE segmentation could be used to assess muscular inflammation of IIM, holding promise in the assessment of IIM.Acknowledgements
The authors thank Yi Sun (Siemens Healthcare, Beijing, China) for his technical support, and Dong Liu (Department of Radiology, Peking Union Medical College Hospital, Chinese Academy of Medical Sciences & Peking Union Medical College) for help during data acquisition.References
1. Maillard SM, Jones R, Owens C, Pilkington C, Woo P, Wedderburn LR, et al. Quantitative assessment of MRI T2 relaxation time of thigh muscles in juvenile dermatomyositis. Rheumatology (Oxford). 2004;43(5):603-8.
2. Wang F, Zhang H, Wu C, Wang Q, Hou B, Sun Y, et al. Quantitative T2 mapping accelerated by GRAPPATINI for evaluation of muscles in patients with myositis. Br J Radiol. 2019;92(1102):20190109.
3. Hilbert T, Sumpf TJ, Weiland E, Frahm J, Thiran JP, Meuli R, et al. Accelerated T2 mapping combining parallel MRI and model-based reconstruction: GRAPPATINI. J Magn Reson Imaging. 2018;48(2):359-68.
4. Bai J, Xu J, Yang W, Gao B, Cao W, Liang S, et al. A New Scale to Assess the Severity and Prognosis of Pulmonary Alveolar Proteinosis. Can Respir J. 2016;2016:3412836.
5. Yao L, Yip AL, Shrader JA, Mesdaghinia S, Volochayev R, Jansen AV, et al. Magnetic resonance measurement of muscle T2, fat-corrected T2 and fat fraction in the assessment of idiopathic inflammatory myopathies. Rheumatology (Oxford). 2016;55(3):441-9.
Figures