3080
Functional Deficits in the Large-scale Circuitry Mediate the Links of Structural Atrophy to Social Anxiety Disorder Outcomes1Huaxi MR Research Center (HMRRC), West China Hospital of Sichuan University, Chengdu, China
Synopsis
Social anxiety disorder (SAD) is a prevalent and disabling psychiatric disorder, for which the underlying neurobiological mechanisms remain poorly understood. Herein, whole-brain voxel-based morphometry and coupled functional connectivity analyses were conducted to investigate structural and functional alterations, while correlation and mediation analyses were performed to probe the potential roles of structural-functional couplings in SAD diagnosis. As a result, we observed significant subcortical grey matter atrophy and widespread dysconnectivity in cortico-striato-thalamo-cerebellar circuitry in SAD; functional dysconnectivity could partially mediate the effects of structural atrophy on SAD diagnosis, which may contribute to clarifying the underlying mechanisms of structure-functional couplings for SAD.
Introduction
Social anxiety disorder (SAD) is a highly prevalent and disabling disease characterized by marked and persistent fear and anxiety, as well as avoidance of public scrutiny in social situations. Although functional and structural abnormalities in brain regions involved in the neurobiology of fear and anxiety have been observed in SAD, findings have been heterogeneous due to small sample sizes, demographic confounders, and methodological differences 1,2, while multimodal neuroimaging studies on structural–functional deficits and couplings are rather scarce. Besides, most extant functional findings were based on task-functional MRI (fMRI), while it remains to be evaluated whether an analogous pattern of functional anomalies occurs in resting-state brain physiology (i.e., resting-state fMRI (rs-fMRI)) without the potential confounding effects of task performance 3. Taking these issues into consideration, the current study aimed to determine resting-state functional connectivity (rs-FC) alterations in brain areas with structural deficits in non-comorbid adult patients with SAD and explore potential mechanisms of structural-functional couplings for SAD diagnosis.Methods
As the power analysis using G Power software indicated that we needed a sample of at least 102 participants to detect a medium-sized effect (Cohen's d = 0.5, α = 0.05, 1-β = 0.8) for a two-sample t-test 4, 49 non-comorbid adult patients with SAD (aged 24.6±5.3 years; 30 male) and 53 demography-matched healthy controls (HCs) (aged 23.4±3.3 years; 31 male) were recruited to obtain whole-brain high-resolution 3.0-Tesla T1-weighted images and rs-fMRI data using a spoiled gradient-recalled sequence and gradient echo-planar imaging sequence respectively.Preprocessing of structural images was performed using Statistical Parametric Mapping software (SPM12) 5, while the rs-fMRI data were preprocessed with the structural abnormal areas as seeds for the rs-FC analysis through the Data Processing Assistant for Resting-State fMRI (DPARSF 4.3) 6. Then, whole-brain voxel-wise comparisons of grey matter volume (GMV) between groups were performed using two-sample t-test with age, sex, and total intracranial volume (TIV) as covariates, while group differences in rs-FC were conducted via two-sample t-test to compare rs-FC between groups with age, sex, and mean frame-wise displacement as covariates. The Gaussian random field theory was performed to control for multiple comparisons with a significance threshold of a voxel-wise value of P < 0.001 and cluster probability of P < 0.05. In addition, we applied the false discovery rate to correct for four seeds in the FC analyses. Furtherly, a partial correlation analysis was conducted to identify the associations between the structural/functional changes and clinical characteristics, and mediation analysis was performed with the SPSS macro PROCESS including the bootstrapping approach to explore the potential mediating roles of functional deficits (i.e., mediator variable) in the relationship between the corresponding structural abnormalities (i.e., independent variable) and SAD diagnosis (i.e., dependent variable) with age, sex, TIV, and mean frame-wise displacement as covariates 7.
Results
SAD patients had significantly decreased GMV in the bilateral putamen, right thalamus, and left parahippocampus, coupled with large-scale resting-state dysconnectivity in cortico-striato-thalamo-cerebellar circuitry. Besides, decreased GMV in the bilateral putamen was inversely related to SAD duration, and decreased rs-FC between the right thalamus with limbic lobe or cerebellum were positively correlated with SAD duration. Furtherly, dysconnectivity of the putamen with the cerebellum or the right thalamus with the middle temporal gyrus/supplementary motor area partially mediated the effects of putamen/thalamus atrophy on SAD diagnosis.Discussion
Evidence is accumulating for the interconnection of the cortex, basal ganglia, and thalamus in large-scale loops (i.e., cortico-striato-thalamo-cortical (CSTCort) circuitry), which is considered a prevailing model regarding the pathophysiological underpinnings of obsessive–compulsive disorder (another important anxiety-related psychosis in DSM-IV) 8. The current results not only confirmed the involvement of CSTCort circuitry in SAD, but also highlighted the crucial roles of the cerebellum in SAD, thus indicating that aberrant cortico-striato-thalamo-cerebellar (CSTCere) circuitry may contribute to the psychopathological basis of SAD; that is, dysfunctional CSTCere circuitry may contribute to undue appraisal of external stimuli such as facial emotion and potential social threat, defective cognitive, emotional, and social motor processing, and consequent excessive fear and avoidance of social interactions 9. More critically, our mediation analysis confirmed that dysconnectivity based on the bilateral putamen and right thalamus partially mediated the relationships between subcortical nuclei atrophy and SAD diagnosis; that is, the corresponding functional deficits may be a potential intrinsic mechanism linking GMV alterations to SAD occurrence 10. In other words, it is speculated that atrophy of the bilateral putamen and right thalamus may cause aberrant functional synchronization and then give rise to defective function in some vital areas, eventually leading to the occurrence of SAD 11.Conclusion
For the first time, the current study extended prior SAD-related neuroimaging studies by identifying the involvement of the CSTCere circuitry in non-comorbid adult patients with SAD, and provided further evidence for the “brain structure-function behavioural coupling” hypothesis that structural alterations in the brain may give rise to clinical syndromes via an impact on disrupted FC, by revealing the potential coupling mechanisms of structural and functional deficits in the prediction of SAD diagnosis. Therefore, the current findings might provide insights into understanding the neurobiological substrates of SAD and initial evidence for further identification of candidate neuroanatomical biomarkers, which may advance early diagnosis, targeted treatment, and therapeutic evaluation for SAD.Acknowledgements
The authors would like to express their sincere appreciation to the tutors and colleagues for provided valuable help. We also thank all the participants in this study. This study was supported by the National Natural Science Foundation of China (Grant Nos. 81621003, 81761128023, 81820108018, 82027808) and NIH/NIMH R01MH112189-01. The funding sources had no involvement in the study design, data collection and analysis, results interpretation, or writing of the paper.
References
[1] Bas-Hoogendam JM, Westenberg PM. Imaging the socially-anxious brain: recent advances and future prospects. F1000Res. 2020;9.
[2] Mizzi S, Pedersen M, Lorenzetti V, Heinrichs M, et al. Resting-state neuroimaging in social anxiety disorder: a systematic review. Mol Psychiatry. 2021.
[3] Smitha KA, Akhil Raja K, Arun KM, et al. Resting state fMRI: A review on methods in resting state connectivity analysis and resting state networks. The neuroradiology journal. 2017;30:305-317.
[4] Faul F, Erdfelder E, Lang AG, et al. G*Power 3: a flexible statistical power analysis program for the social, behavioral, and biomedical sciences. Behavior research methods. 2007;39:175-191.
[5] Ashburner J, Friston KJ. Unified segmentation. NeuroImage. 2005;26:839-851.
[6] Chao-Gan Y, Yu-Feng Z. DPARSF: A MATLAB Toolbox for "Pipeline" Data Analysis of Resting-State fMRI. Front Syst Neurosci. 2010;4:13.
[7] Gaynor SM, Schwartz J, Lin X. Mediation analysis for common binary outcomes. Statistics in medicine 2019;38:512-529.
[8] Pauls DL, Abramovitch A, Rauch SL, et al. Obsessive-compulsive disorder: an integrative genetic and neurobiological perspective. Nat Rev Neurosci 2014;15:410-424.
[9] Chavanne AV, Robinson OJ. The Overlapping Neurobiology of Induced and Pathological Anxiety: A Meta-Analysis of Functional Neural Activation. Am J Psychiatry 2021;178:156-164.
[10] Honey CJ, Sporns O, Cammoun, L, et al. Predicting human resting-state functional connectivity from structural connectivity. Proc Natl Acad Sci USA. 2009;106:2035-2040.
[11] Gong Q. Clinical Aims of Psychoradiology. Neuroimaging clinics of North America. 2020;30:xvii-xviii.
Figures
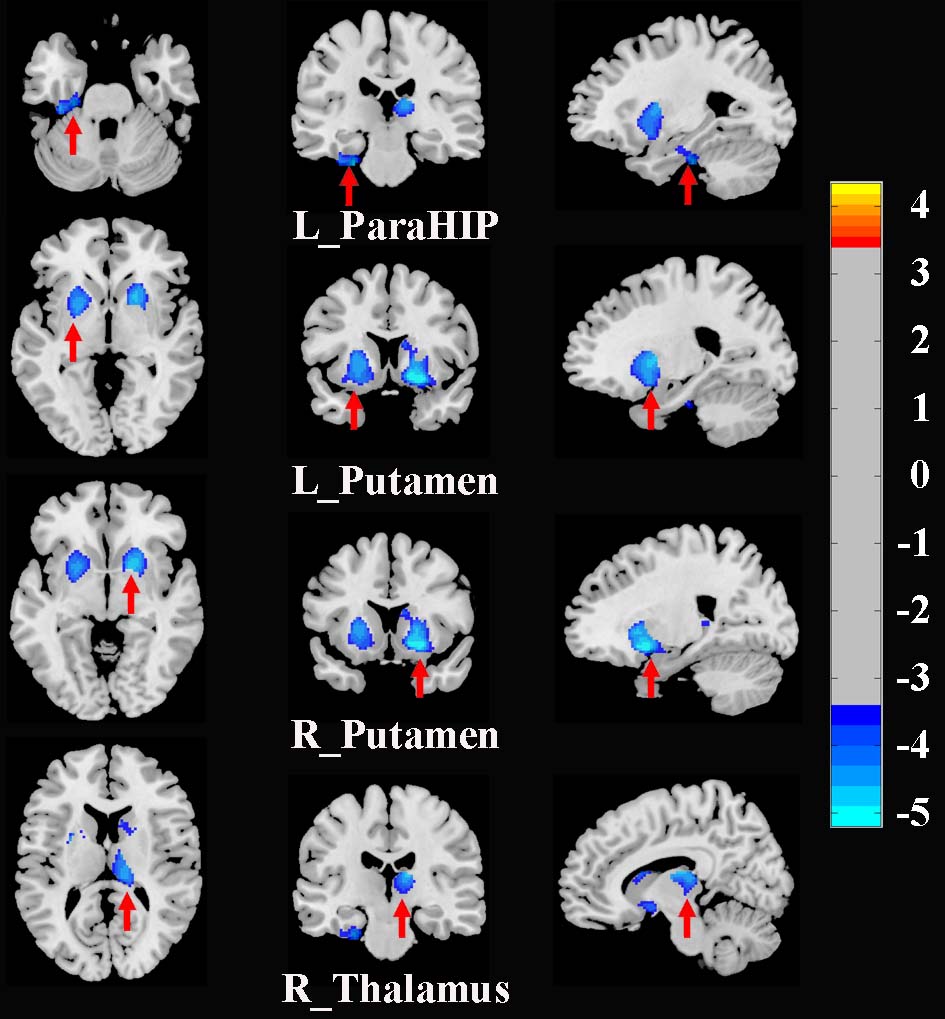
Figure 1. Brain regions with significant differences in GMV between SAD patients and HCs (corrected with Gaussian random field theory with a significance threshold of a voxel-wise value of P < 0.001 and cluster probability of P < 0.05). Warmer colours (positive values) represent increased GMV, while cooler colours (negative values) represent decreased GMV in SAD patients compared to HCs. Abbreviations: GMV, grey matter volume; HCs, healthy controls; L, left; ParaHIP, parahippocampus; R, right; SAD, social anxiety disorder.
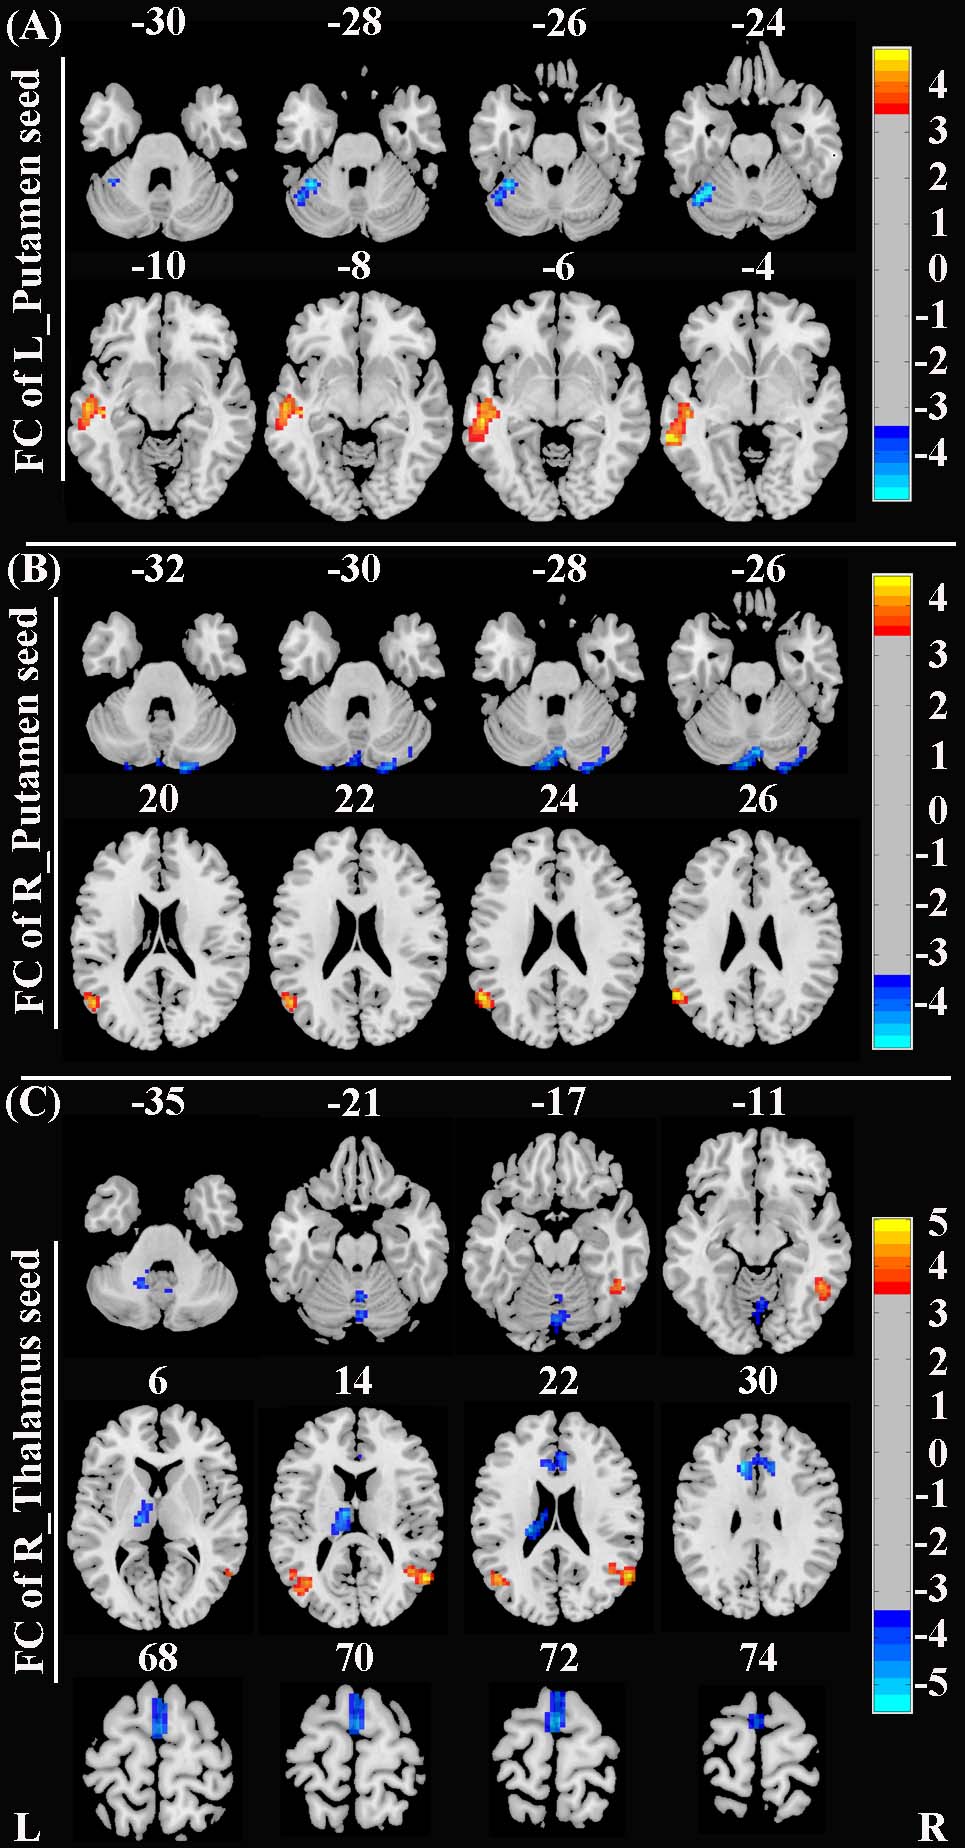
Figure 2. Brain regions with significant differences in rs-FC between SAD patients and HCs (corrected with Gaussian random field theory with a significance threshold of a voxel-wise value of P < 0.001 and cluster probability of P < 0.05). Warmer colours (positive values) represent increased rs-FC, while cooler colours (negative values) represent decreased rs-FC in SAD patients compared to HCs. Abbreviations: HCs, healthy controls; L, left; R, right; rs-FC, resting-state functional connectivity; SAD, social anxiety disorder.
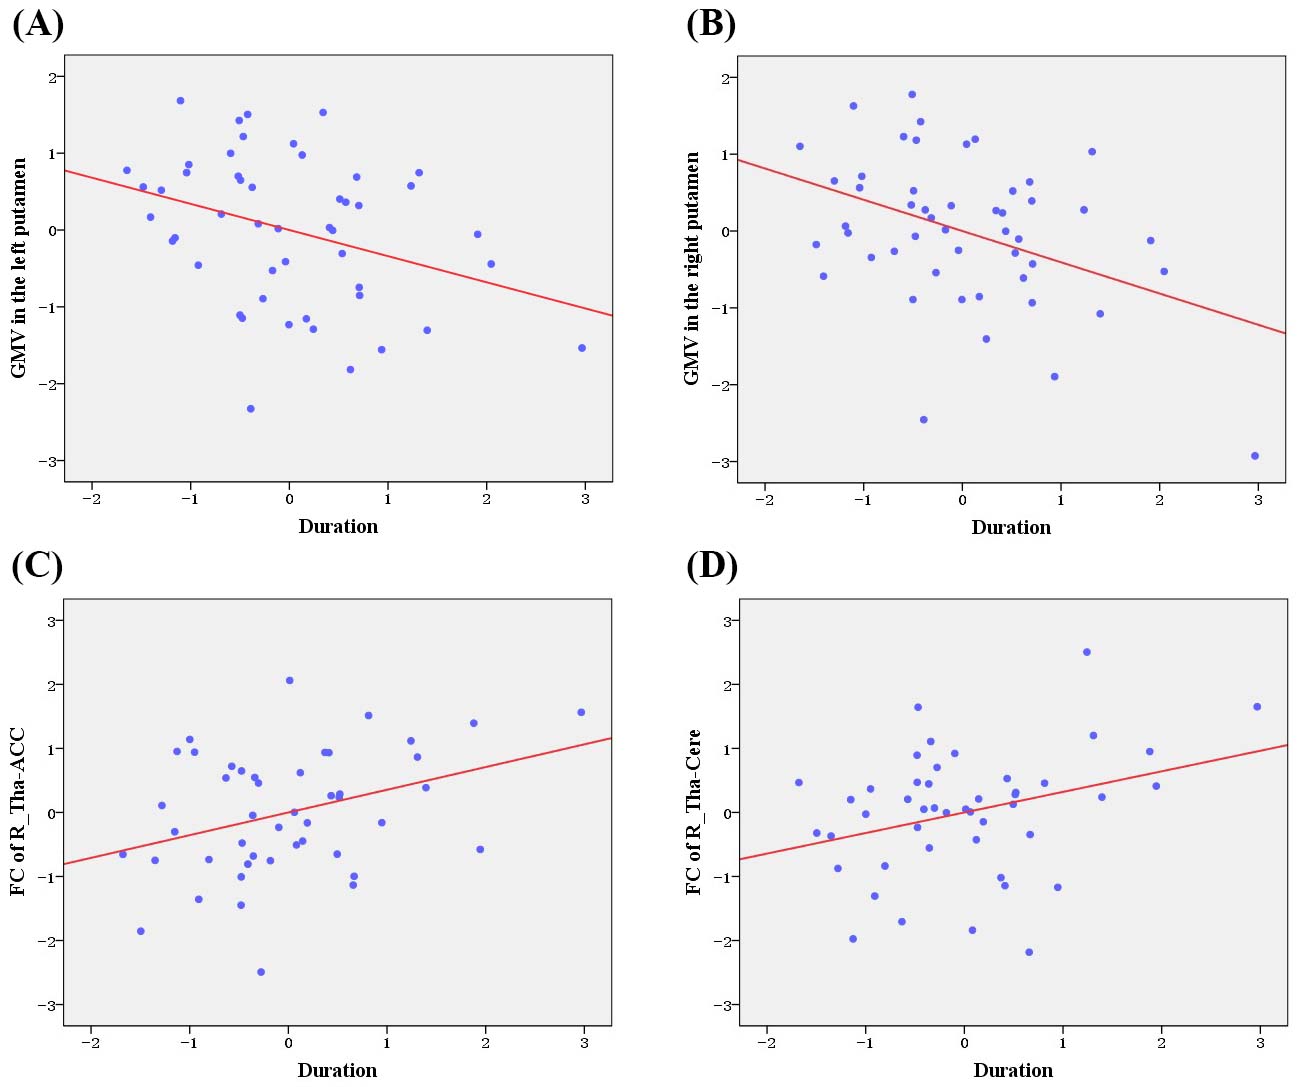
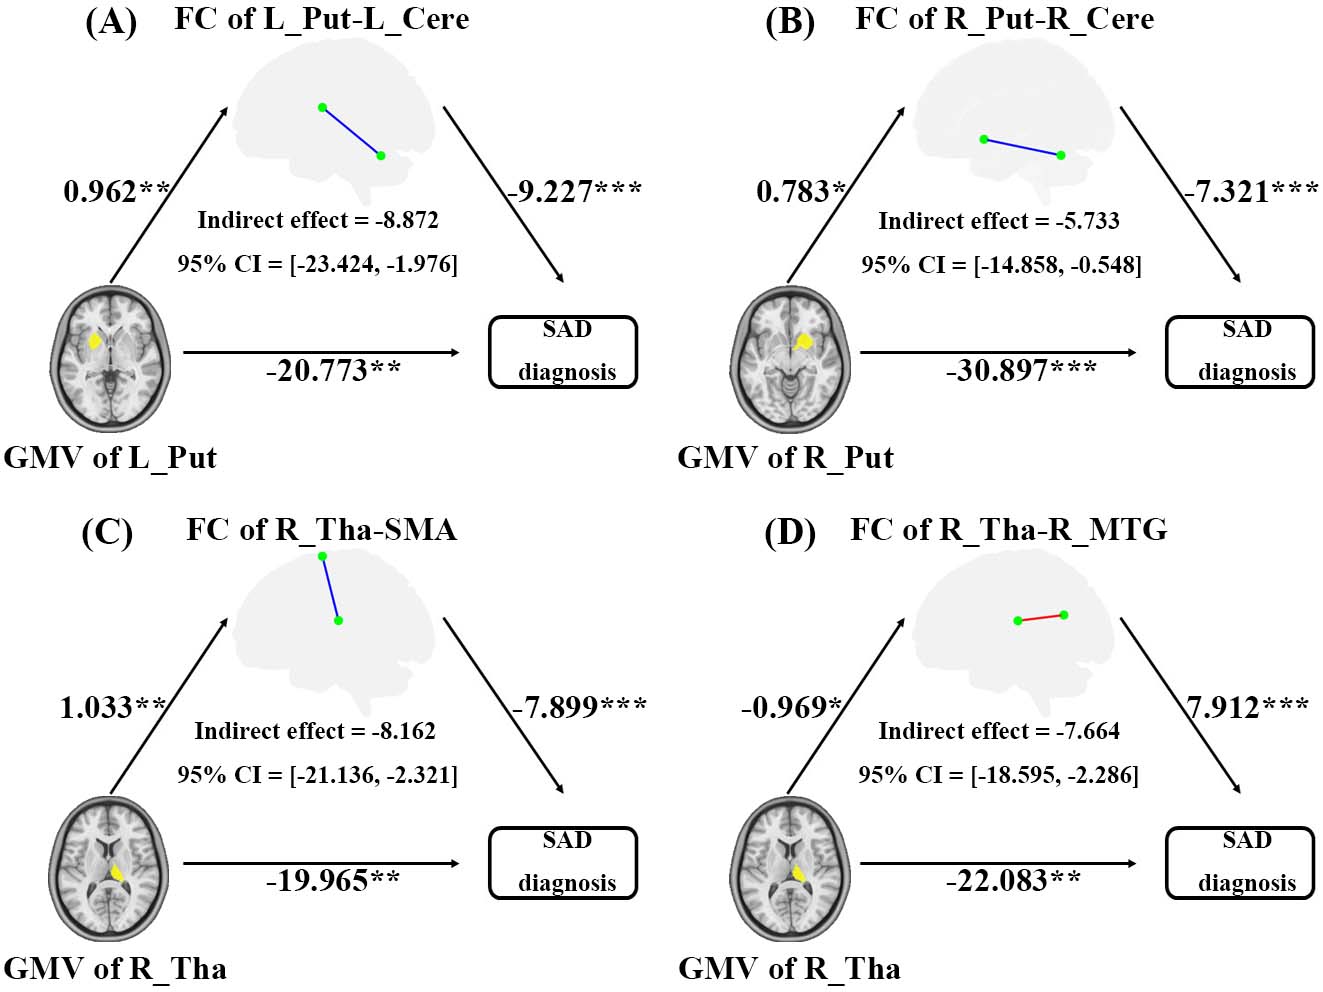
Figure 4. Mediating role of rs-FC deficits on the effects of GMV abnormalities on SAD diagnosis. Unstandardized regression coefficients are displayed (*P < 0.05, **P < 0.01, ***P < 0.001). Age, sex, total intracranial volume, and mean frame-wise displacement were controlled for in the model.