3078
Cerebellar atrophy in Major Depressive Disorder1Department of NMR, All India Institute of Medical Sciences (AIIMS), New Delhi, India, 2Department of Psychiatry, All India Institute of Medical Sciences (AIIMS), New Delhi, India
Synopsis
Present study investigated volumetric changes in the brain of Indian patients suffering from Major Depressive Disorder (MDD) using Magnetic Resonance Imaging (MRI). These patients were seen to have significantly reduced brain and cerebellar volumes. Volume of caudate, putamen and globus pallidus were seen to be reduced but no significant changes were seen in hippocampus and amygdala. Volume of cerebellum and lobule VI of cerebellum was also reduced. Our results suggest that cerebellum as well as VI lobule of cerebellum may be associated with MDD.
Introduction
Major depressive disorder (MDD) is psychiatric disorder characterized by persistent depressed/abnormal mood with little/no interest in daily life1. Prevalence of MDD patients is 3.2-4.7 % globally and 0.5-7.8% in Indian subcontinent2. These patients not only show abnormalities in neuro-vegetative functions, cognition and psycho-motor activities3 but also are susceptible for developing diabetes mellitus, heart disease and stroke. MDD is a global burden and up-to 50% of the suicides per year worldwide occur within a depressive episode4. There is an inhibition of HPA axis and an imbalance of neuro-chemicals in MDD5. This inhibition and imbalance of neuro-chemicals are associated with the changes at structural and volumetric level. Structural studies based on Magnetic Resonance Imaging (MRI) have shown that the areas that affect cognition and social relations are affected in MDD and may show a significant increase/decrease in their volume. Areas like hippocampus and amygdala which are thought to influence cognition and social behavior were seen to undergo reduction in the volume6,7. However, those results were not consistent and other organs that regulate emotions and mood like the cerebellum8 were not emphasised. Additionally, there were not enough MRI based studies on the patients of MDD in Indian population. Therefore, in this study we have done volumetric estimation of whole brain as well as the cerebellum of the patients of MDD of Indian subcontinent to find out if cerebellum or its lobules undergo volumetric changes.Materials and methods
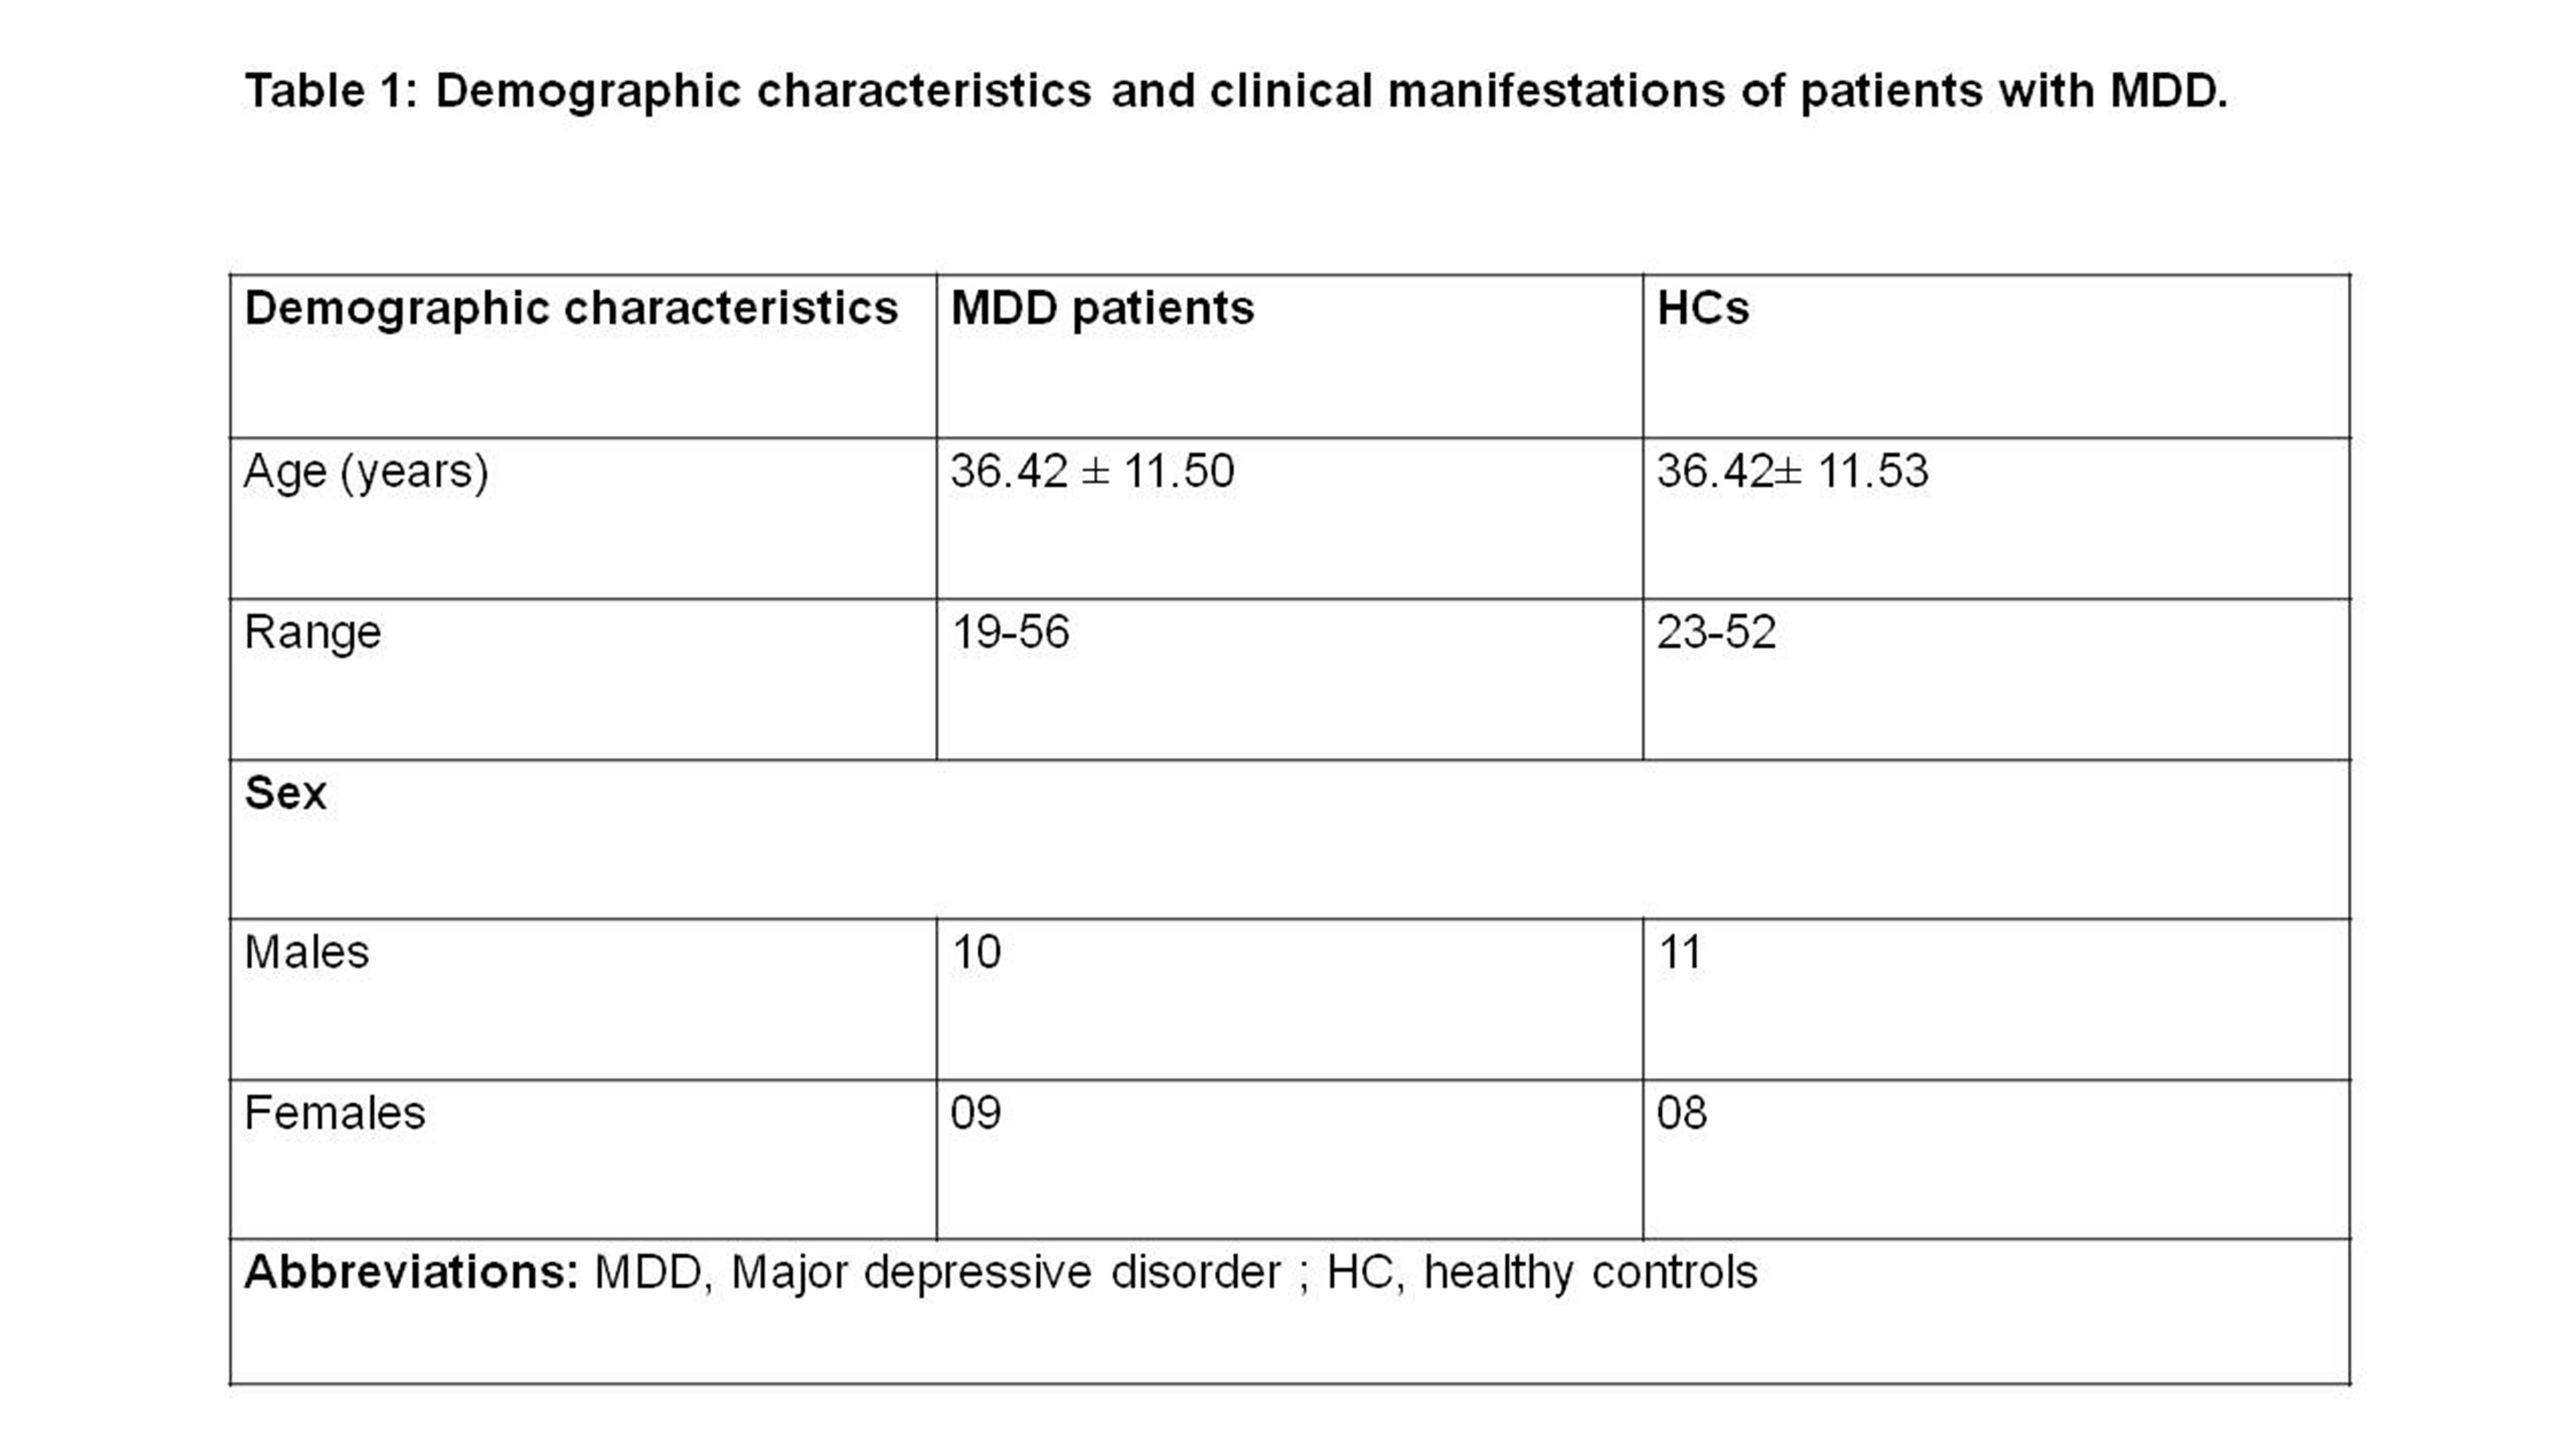
Objectives: To perform volumetric estimation of brain as well as the cerebellum of MDD patients from Indian patients using MRI and to compare the results with healthy controls to find out the structural changes in the brain as well as in the cerebellum.Patients: The MDD patient group (screened using MINI 7.0 and with a score above 8 on HAM-D and 7 on MADRS) consisted of 19 patients (10 males, 9 females) (mean age 36.42 ± 11.50 years, age range 19-56 years) were recruited from the Department of Psychiatry, AIIMS, New Delhi. Control group consisted of 19 healthy volunteers (11 males, 8 females) (mean age 36.42 ± 11.53, age range 23-52 years) with no neurological/psychiatric disease. The study was approved by Institute Ethics Committee, written informed consent was obtained from each subject.
Magnetic Resonance Imaging: Volumetric 3-D T1 images in all three planes, axial, coronal and sagittal of whole brain were acquired using standard spin-echo pulse sequence at 3T (Ingenia, Philips). The images were saved in DICOM format and changed into NifTi files. Images were processed with the web based online tools like volBrain pipeline and CERES pipeline that provides automated brain segmentation and generates report summarising the volumetric results. The percentage [(Mean±standard deviation (SD)] of different brain volumes were calculated, compared between two groups (MDD and HC) using student t-test (SPSS, Chicago, Illionois). All volumetric analysis results are reported as a % of total intracranial volume. Level of significance was set at p<0.05.
Results
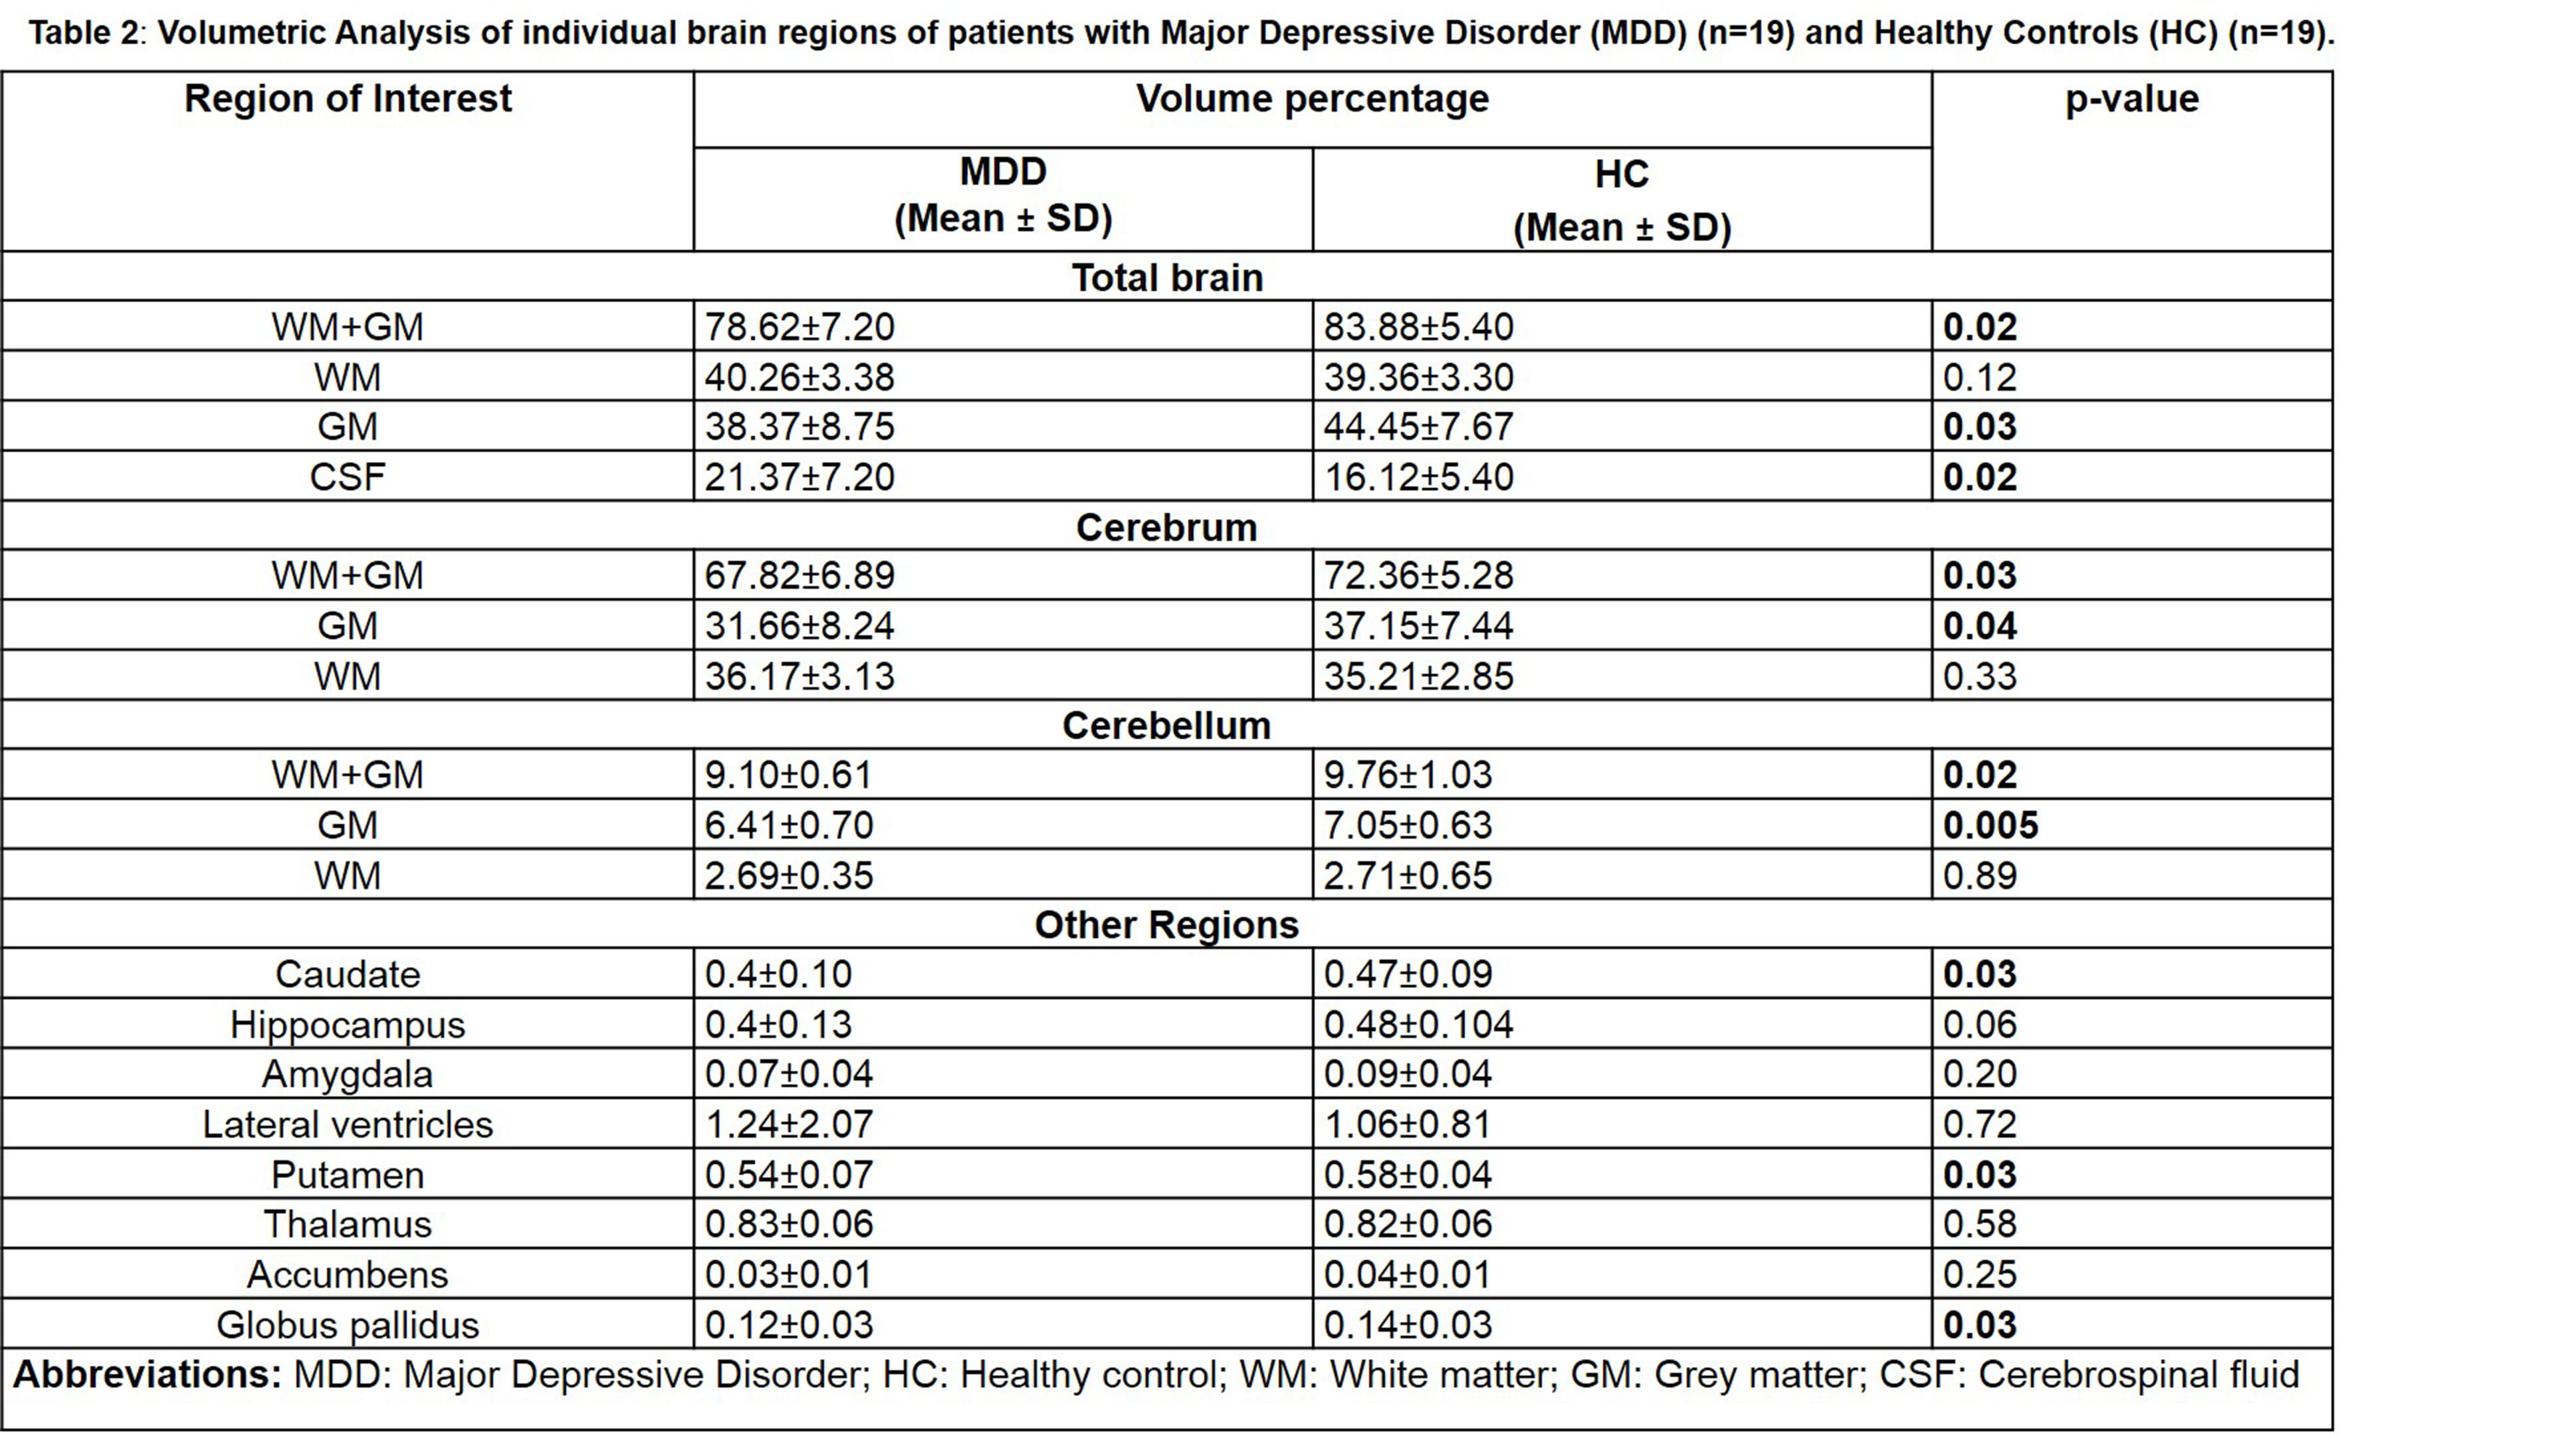
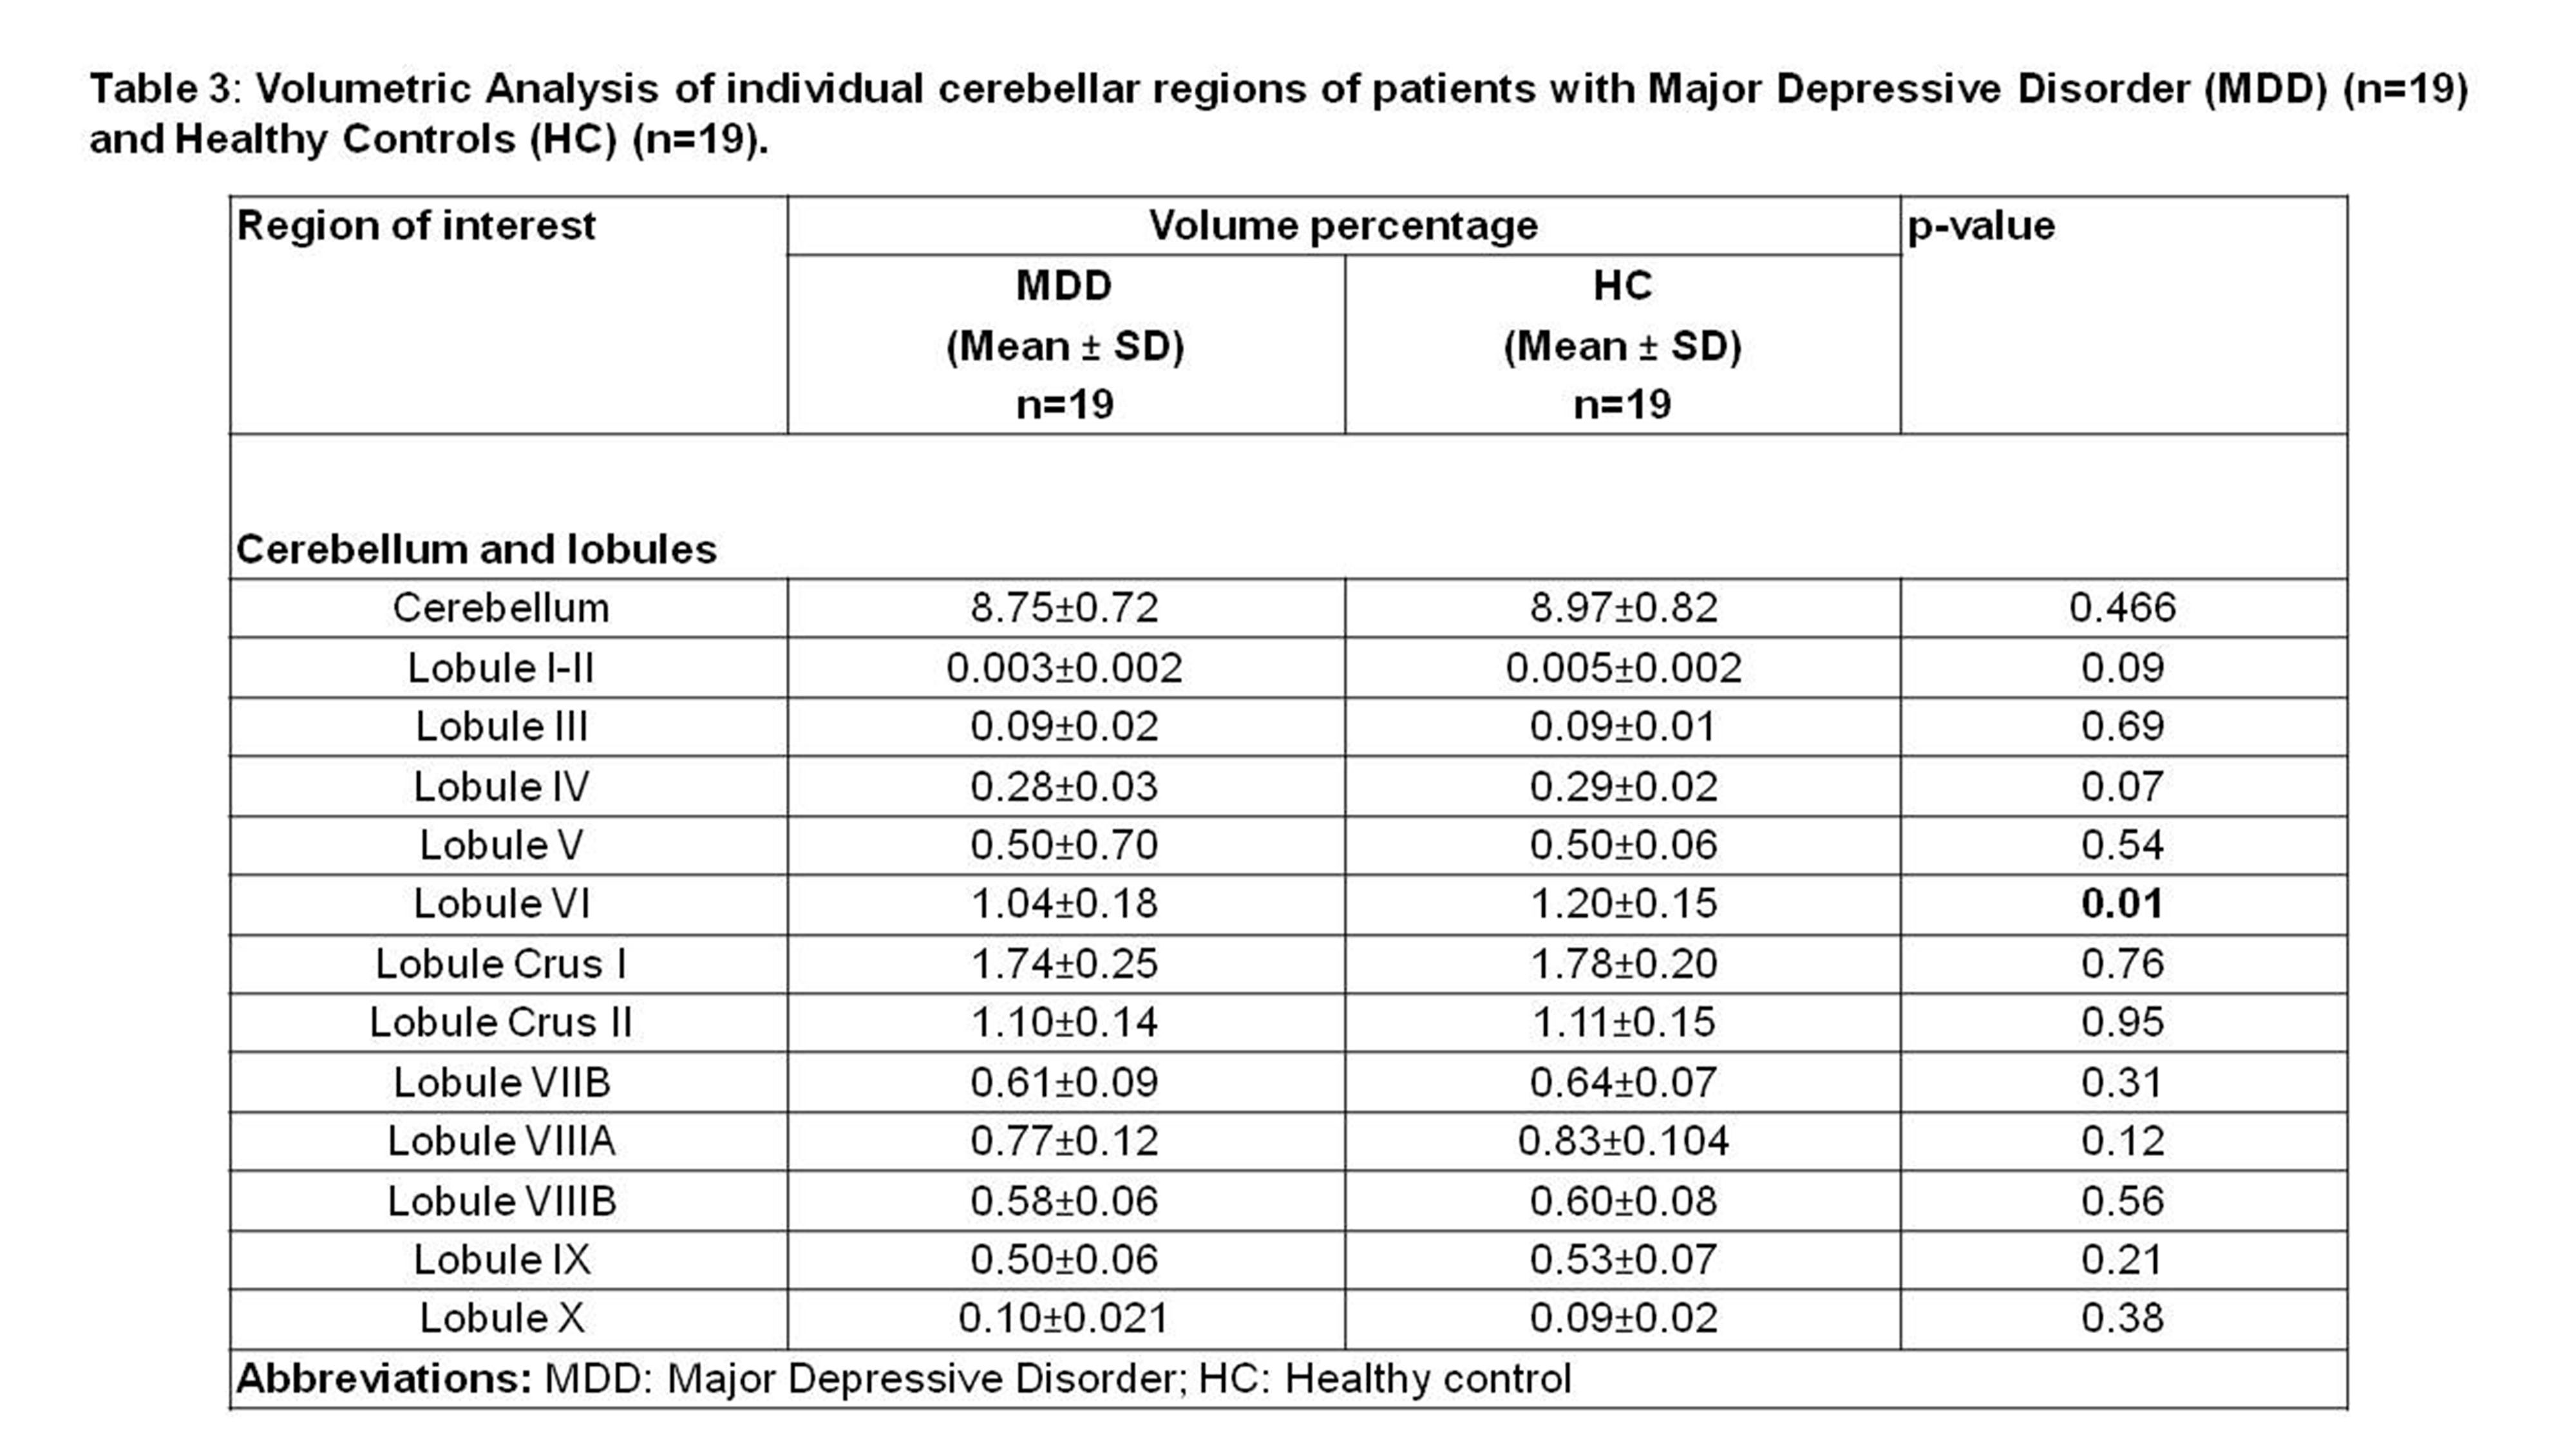
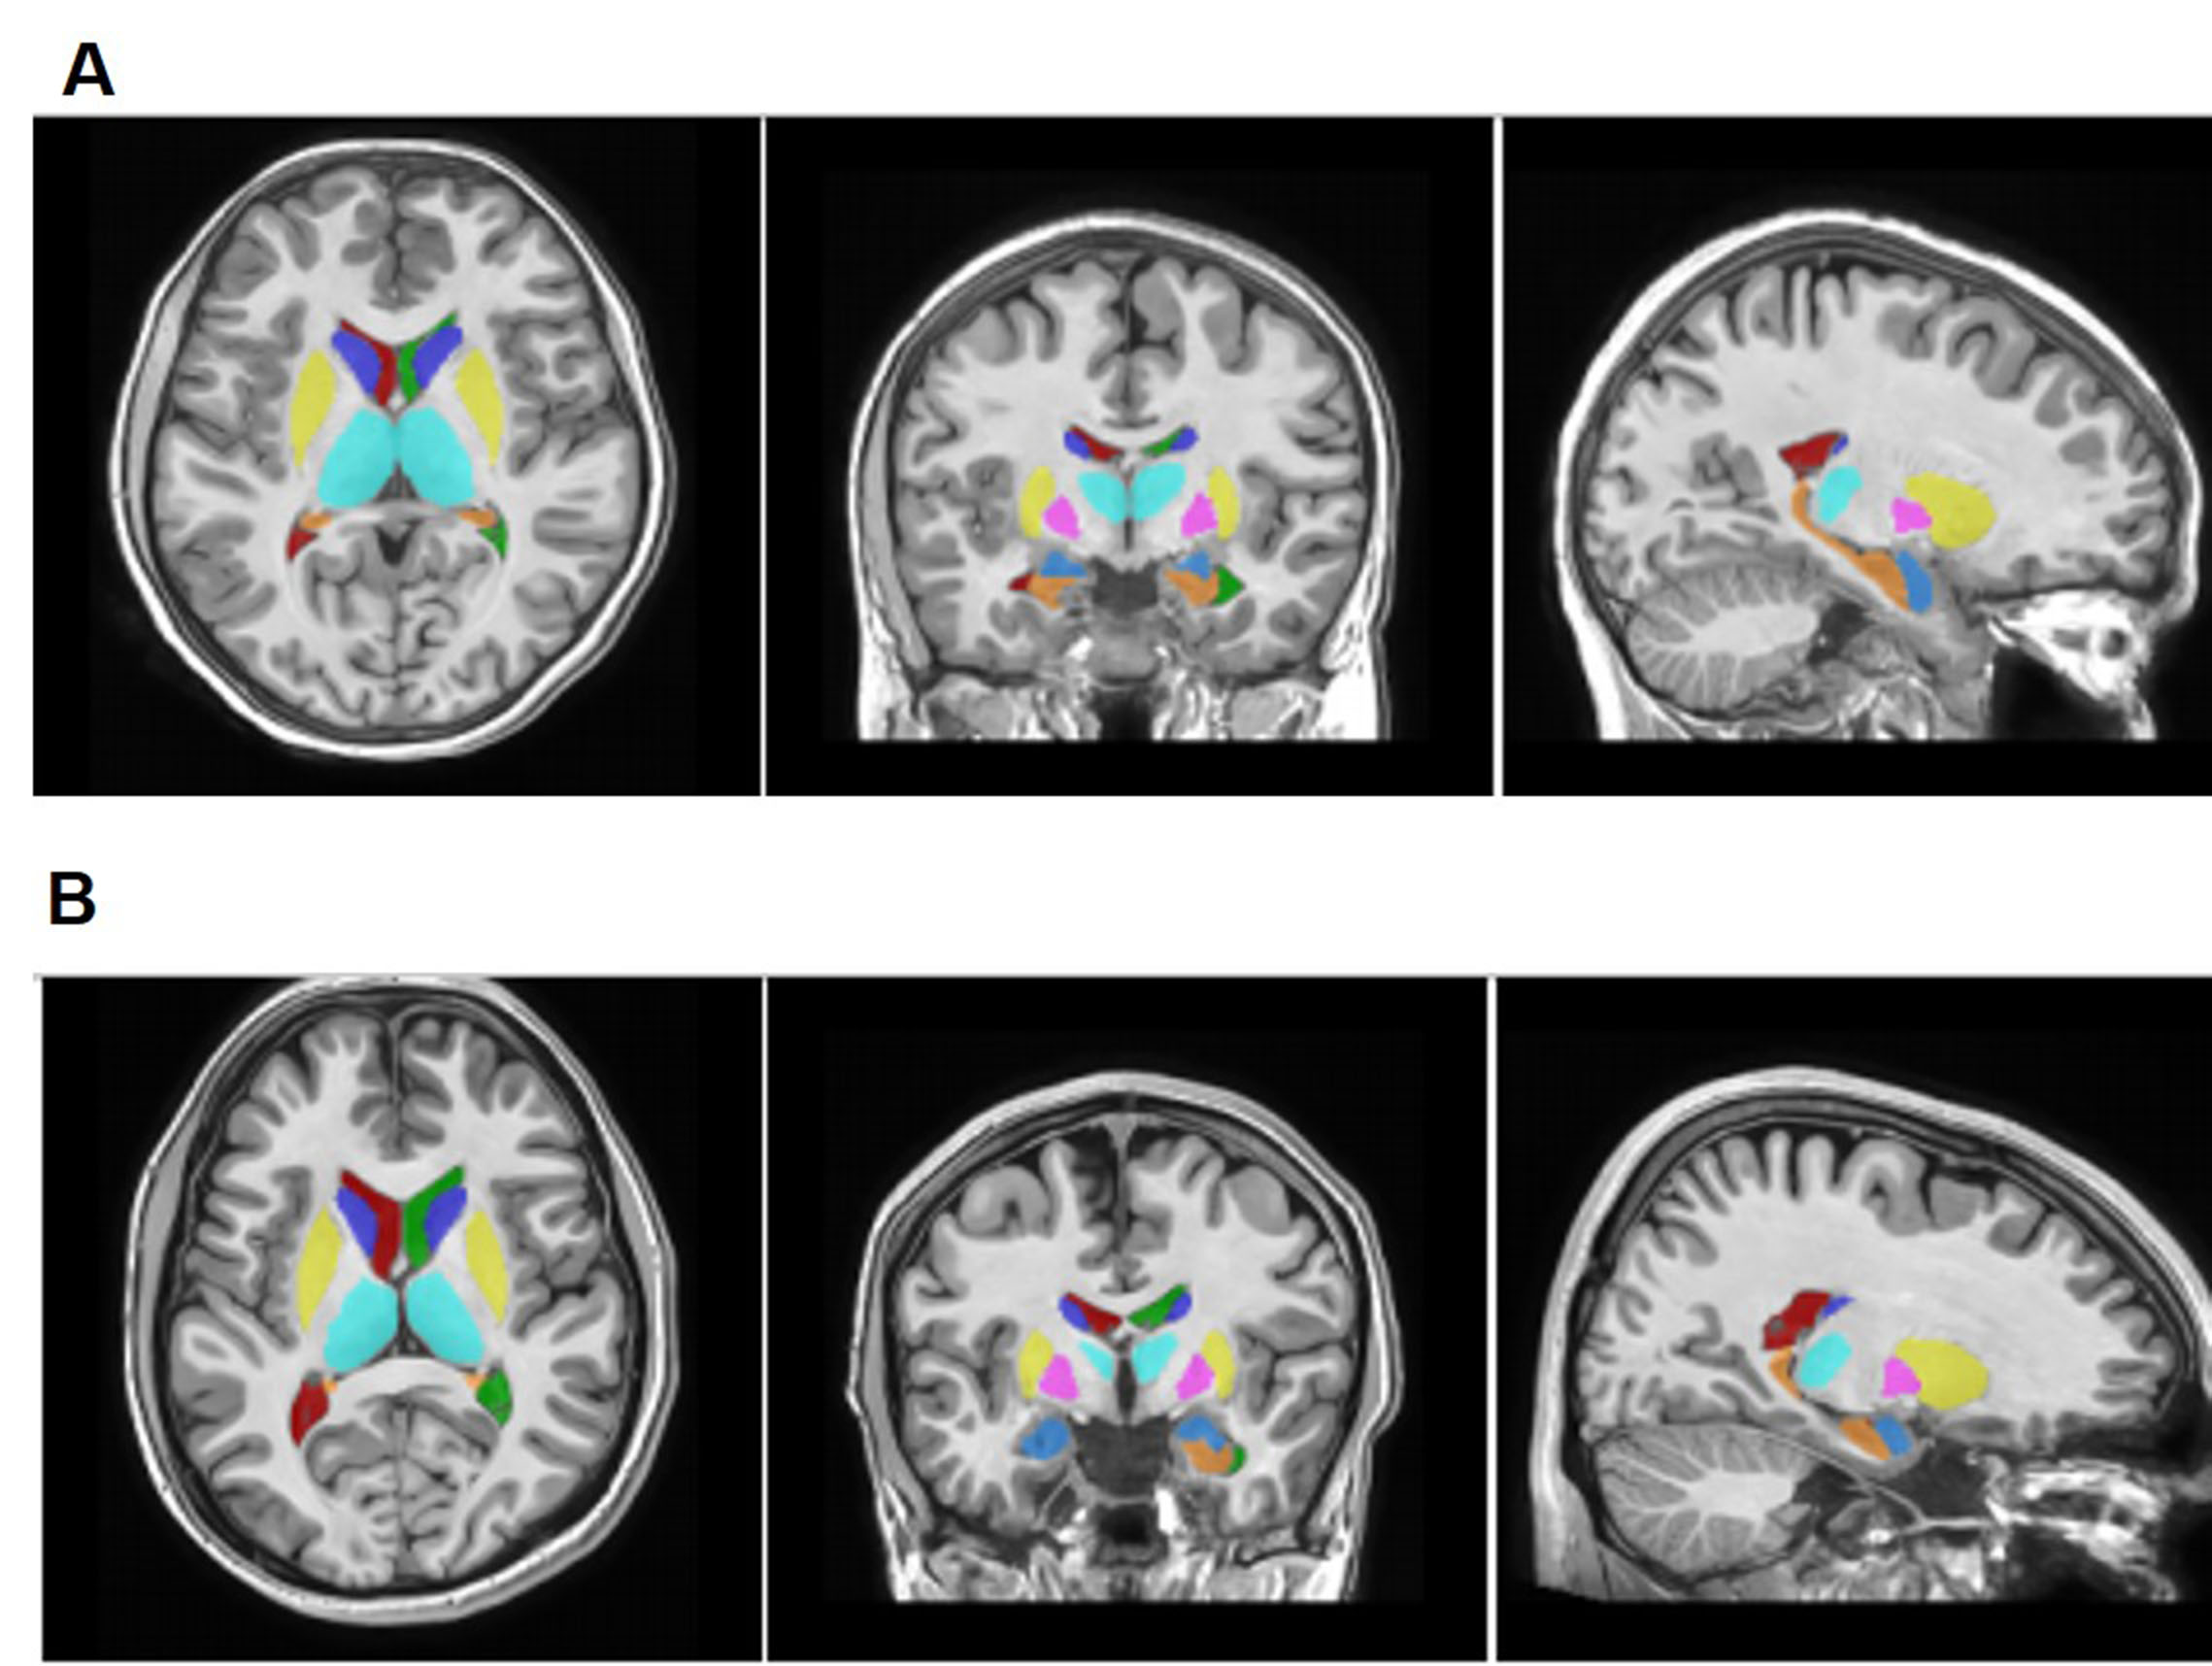
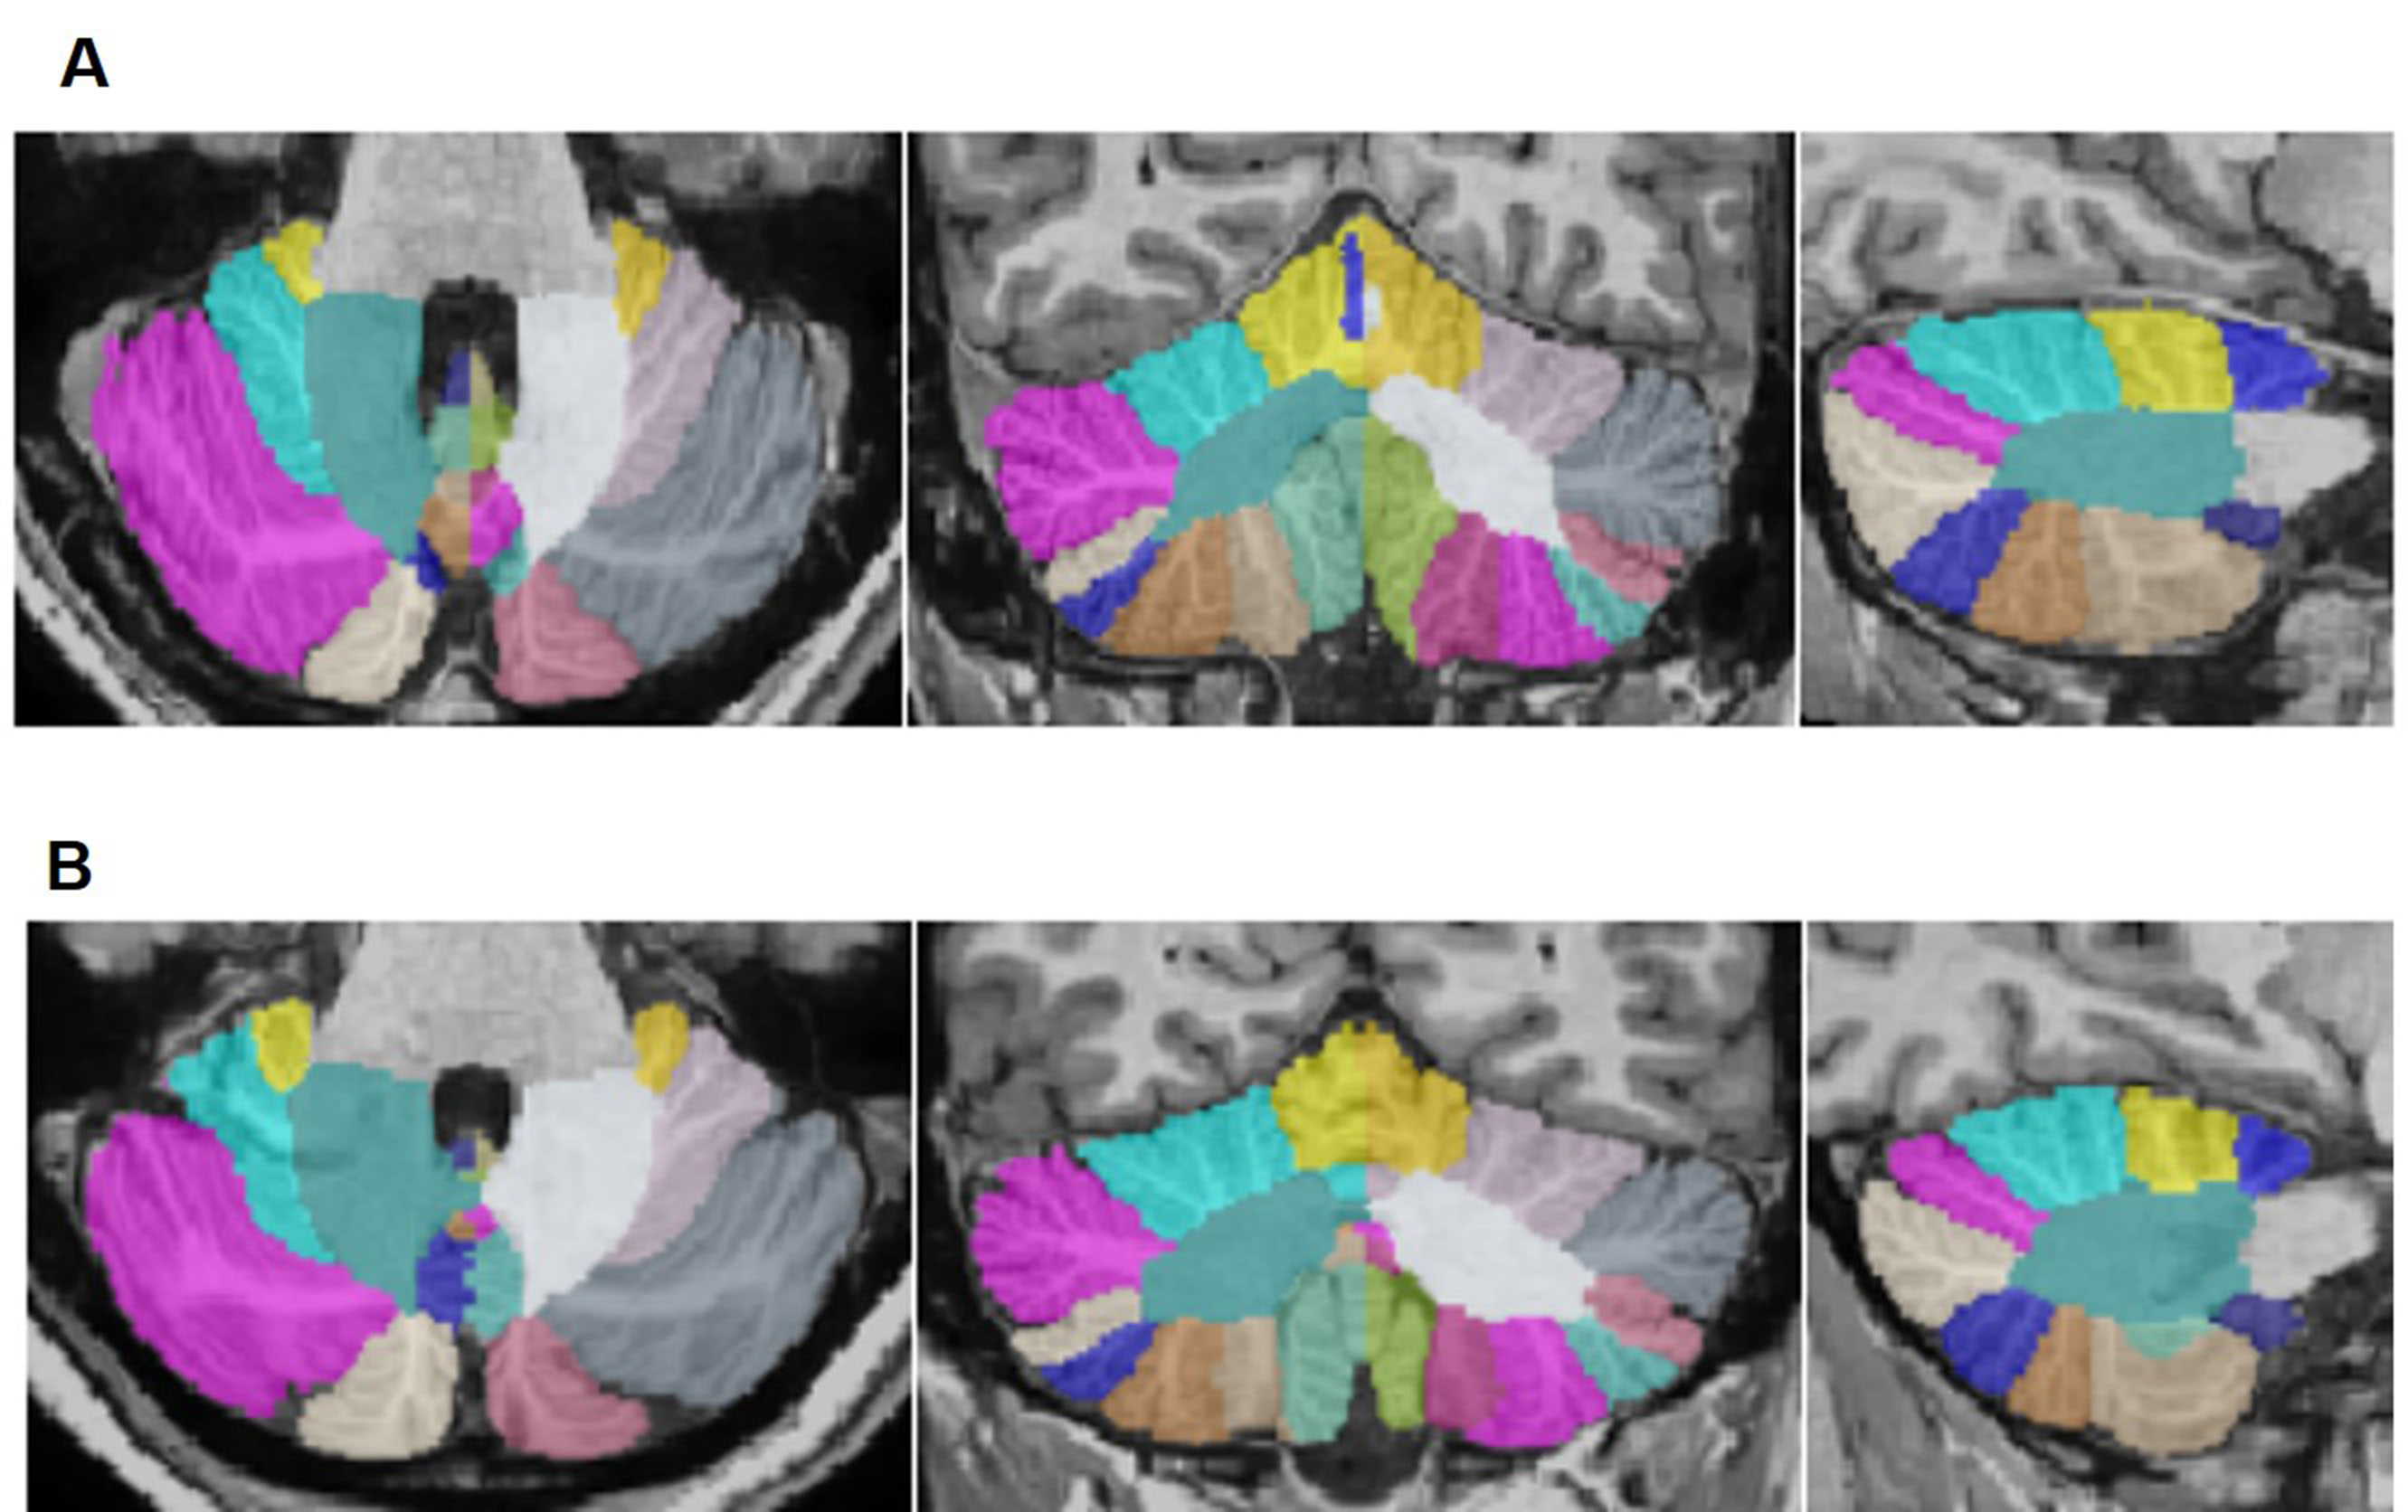
Demographic characteristics of MDD patients are presented in Table 1. Volumetric analysis of the whole brain and cerebellum of MDD patients and HCs was carried out. Figure1 shows representative volBrain images of brain and sub-parts obtained from a healthy control (male, 49 years old) (A) and a patient with MDD (male, 43 years old) (B). Figure 2 shows representative CERES images of cerebellum and lobules taken from a healthy control (male, 49 years old) (A) and a patient with MDD (male, 43 years old) (B). Significant changes in the volume of different brain structures were seen. Whole brain volume was significantly reduced in patients of MDD including the volume of grey matter (GM) (p<0.03), cerebrum (p<0.02) and grey matter of cerebrum (p<0.04), cerebellum (p<0.02) and grey matter of cerebellum (p<0.005), caudate (p<0.03), putamen (p<0.03) and globus pallidus (p<0.03). Volume of CSF was significantly increased in case of MDD patients (p<0.02) (Table 2). Volumetric analysis of the cerebellum showed that the total cerebellum volume and volume of cerebellum lobe VI was decreased in case of MDD patients (p<0.01) (Table 3).Discussion
Present study demonstrated significant changes in the various brain structures of MDD patients compared to controls. The main findings of our study are significantly lower brain volume of grey matter (GM), grey matter of cerebrum, caudate, putamen and globus pallidus and grey matter of cerebellum and lobule VI of cerebellum in MDD patients. As the patients of MDD show abnormalities in cognition, there is a probability that this abnormality could be due to volume changes in the cerebellum. Our MRI findings demonstrated that atrophy of various brain parts in patients with MDD may have the clinical relevance by aiding in the diagnosis of these patients.Conclusion
Our result suggest that the volume of cerebrum, caudate, putamen, globus pallidus and cerebellum was significantly reduced in the patients of MDD.Acknowledgements
The authors would like to acknowledge the extramural funding from Department of Science and Technology (DST-SERB) (FILE NO.CRG/20l9/002709), New Delhi, India and CSIR, India.References
1. Qiu, H., & Li, J. (2018). Major Depressive disorder and Magnetic Resonance Imaging: A Mini-Review of Recent Progress. Current pharmaceutical design, 24(22), 2524-2529.
2. Arvind, B. A., Gururaj, G., Loganathan, S., Amudhan, S., Varghese, M., Benegal, V., Rao, G. N., Kokane, A. M., B S, C., P K, D., Ram, D., Pathak, K., R K, L. S., Singh, L. K., Sharma, P., Saha, P. K., C, R., Mehta, R., Y., T M, S., & NMHS collaborators group (2019). Prevalence and socioeconomic impact of depressive disorders in India: multisite population-based cross-sectional study. BMJ open, 9(6), e027250.
3. Fava, M., & Kendler, K. S. (2000). Major depressive disorder. Neuron, 28(2), 335-341.
4. Prince, M., Patel, V., & Saxena, S., Maj, M., Maselko, J., Phillips, M. R., & Rahman, A. (2007). No health without mental health. Lancet (London, England), 370(9590), 859-77.
5. Varghese, F. P., & Brown, S. (2001). The Hypothalamic-Pituitary-Adrenal Axis in Major Depressive Disorder: A Brief Primer for Primary Care Physicians. Primary Care Companion J Clin Psychiatry, 3, 151-155.
6. Malykhin, N. V., Carter, R., Seres, P., Coupland, N. J. (2010). Structural changes in the hippocampus in major depressive disorder: contributions of disease and treatment. J Psychiatry Neurosci, 35(5), 337-43.
7. Kronenberg, G. (2009). Reduced amygdale volume in newly admitted psychiatric in-patients with unipolar major depression. J Psychiatr Res. 43(13), 1112-7.
8. Adamaszek, M., D’Agata, F., Ferrucci, R. et al. (2017). Consensus Paper: Cerebellum and Emotion. Cerebellum, 16, 552-576 .
Figures