3077
Changes in neurochemicals of patients with depression observed using two MRS sequences at 7T
Tomohisa Okada1, Yujiro Yoshihara2, Manabu Kubota2, Taro Suwa2, Jun Miyata2, Yuhei Takado3, Jamie Near4, Masoumeh Dehghani4, Thai Akasaka1, Dinh Ha Duy Thuy1, Ravi Teja Seethamraju5, Sinyeob Ahn6, Tadashi Isa1, and Toshiya Murai2
1Human Brain Research Center, Kyoto University, Kyoto, Japan, 2Department of Psychiatry, Kyoto University, Kyoto, Japan, 3Department of Functional Brain imaging, National Institutes for Quantum and Radiological Science and Technology, Chiba, Japan, 4Physical Sciences Platform, Sunnybrook Research Institute, Toronto, ON, Canada, 5Siemens Healthcare USA, Boston, MA, United States, 6Siemens Healthcare USA, Berkeley, CA, United States
1Human Brain Research Center, Kyoto University, Kyoto, Japan, 2Department of Psychiatry, Kyoto University, Kyoto, Japan, 3Department of Functional Brain imaging, National Institutes for Quantum and Radiological Science and Technology, Chiba, Japan, 4Physical Sciences Platform, Sunnybrook Research Institute, Toronto, ON, Canada, 5Siemens Healthcare USA, Boston, MA, United States, 6Siemens Healthcare USA, Berkeley, CA, United States
Synopsis
Major depressive disorder (MDD) afflicts up to 20% of the total population. MRS findings are different among studies. One of the reasons is differences in MRS sequences used. This study compared two sequences: sSPECIAL and STEAM, which consistently found significant and marginally significant reduction of taurine in the anterior cingulate cortex in MDD compared with healthy controls, although concentration of neurochemicals in sSPECIAL and STEAM was different. The difference was lost when concentration was normalized by total creatine due to its significant positive correlation to Taurine. Differences between the two sequences did not result in different neurochemical findings for MDD.
INTRODUCTION
Major depressive disorder (MDD) afflicts up to 20% of the total population in their lifetime,1 and non-invasive imaging is expected to offer objective biomarkers. In MDD, one of the important structures is the anterior cingulate cortex (ACC), where changes from healthy controls (HC) have been reported.2 ACC is a key area of antidepressant action.3 In a review of proton MRS studies of MDD, statistically significant differences in ACC have been reported for myo-inositol (Ins), glutamate (Glu) and creatine/phosphocreatine (tCr), but these differences were inconsistent between studies.4,5 One of the reasons might be the different MRS sequences used.Recently, the semi-adiabatic short-TE spin-echo full-intensity acquired localized (sSPECIAL) sequence has become available that enables low-concentration neurochemicals including γ-aminobutyric acid (GABA) with high SNR.6 The stimulated echo acquisition mode (STEAM) sequence also enables a short-TE acquisition. Therefore, these sequences were used to investigate presence or absence of neurochemical differences in MMD in this study.
METHODS
Eight patients with MDD (4 females, mean 53.8 y.o.) and 13 HC (9 females, mean 49.2 y.o.) were enrolled with written informed consent under an IRB-approved protocol. Scans were conducted on an investigational whole-body scanner (MAGNETOM 7T, Siemens Healthcare, Erlangen, Germany) using a single-transmit volume coil and a 32-channel receiver head coil (Nova Medical, MA, USA).For proton MRS, a measurement voxel 20×30×20 mm3 (in RL, AP and SI directions) was placed in the ACC using a 3D whole-brain T1-weighted MP2RAGE image (TR/TE 6000/2.9ms, TI1/TI2 800/2700ms, FA1/FA2 4°/5°, 0.7mm isotropic resolution) for guidance. FASTMAP and manual shimming were conducted. For MRS scans, a sSPECIAL sequence (inhouse research sequence: TR/TE 6500/16ms, spectral bandwidth 5kHz, 48 averages) and a STEAM (Siemens investigational prototype: TR/TE/TM 4000/5/45ms, spectral bandwidth 6 kHz, 48 averages) were used. Water unsuppressed spectra were also acquired for eddy-current correction and quantitation.
Spectral analysis was carried out using LCModel (version 6.3-1L) on Windows 10. Neurochemicals that attained %SD ≤ 20 in more than 80% of subjects were included for further analysis. Segmentation was conducted for GM, WM and CSF to correct water-referenced concentration estimates. Differences and correlations of concentration between the MRS sequences, as well as between patients and healthy controls were statistically compared. In addition, correlation analysis between taurine (Tau) and tCr was conducted. A p-value < 0.05 was considered statistically significant.
RESULTS
No significant difference was observed in mean age between MDD and HC (p = 0.53). The %SD ≤ 20 were attained in more than 80% of subjects for both sequences in 8 neurochemicals (Table 1): glutamine (Gln), Glu, glutathione (GSH), Ins, N-acetyl-aspartate (NAA), Tau, total choline (tCho) and tCr (See Figure 1 for representative results). The absolute concentrations were significantly different in all 8 neurochemicals between the two sequences, and differences remained in more than half after normalization by tCr. However, correlation coefficients of absolute concentrations between the two sequences ranged from 0.714 to 0.976 and were found to be highly correlated.Between MDD and HC, no statistically significant difference was observed when tCr normalized concentrations were compared, but a difference in absolute concentration was found for Tau using SPECIAL (p = 0.02) and STEAM (p = 0.06, marginal). All other neurochemicals also decreased in MDD, but the differences were not statistically significant (Figure 2). Of the other neurochemicals, Cr had the second lowest p-values (< 0.2). The relation between Cr and Tau was statistically significant for both SPECIAL and STEAM (both, p < 0.01; Figure 3).
DISCUSSION
In this study, Tau was decreased in MDD for both sequences with slightly different statistically significant levels at 7T. Smith et al. investigated late-life depression (LLD) using a STEAM sequence at 7T and found no significant difference in GABA, Glu, GSH, NAA, N-acetyl-aspartyl-glutamate and mI between pre-therapeutic LDD and HC nor before and during Citalopram treatment at ACC.7 They used concentration normalized by tCr, and no result was presented as for Tau.In a depression-like rat model, Tau was found to be decreased in an ex vivo MRS study at 11.7T.8 Tau serves various important functions, such as osmotic regulation of neuronal activity,9 membrane stabilization and tissue maintenance.10 It also protects neural cells from excitotoxicity induced by excitatory amino acids11 and has anti-depressant effect on rats in chronic mild stress-induced depressive state.12 MRS measurement of Tau is difficult at a lower magnetic field, but its reduction observed by both sequences will promote further investigations.
Significant reduction in tCr has been reported in childhood MDD that is considered attributable to decreased energy utilization.13 A non-significant reduction of tCr was also observed in this study, and concentration normalization by tCr may obscure reduction of other neurochemicals. In fact, there were significant linear correlations between Tau and tCr in measurements of both sequences, and the significant differences in Tau concentration between MDD and HC were lost. Caution needs to be taken when normalizing concentrations using tCr.
CONCLUSION
Almost the same number of cases were measured with %SD ≤ 20 in both MRS sequences. They found concentration differences in the same neurochemical, Tau. Consistent use of either of the two sequences will facilitate clinical use of MRS at 7T to elucidate pathological changes in neurochemicals.Acknowledgements
This work was supported grants from AMED (21dm0307102h0003), JSPS KAKENHI (21H03806) and Siemens Healthcare KK, Japan. Authors are grateful to Dr. Hideto Kuribayashi and Mr. Yuta Urushibata for their support.References
1. Kessler, R. C. et al. The Epidemiology of Major Depressive Disorder: Results From the National Comorbidity Survey Replication (NCS-R). Jama 289, 3095–3105 (2003).2. MacMaster, F. P., Carrey, N., Langevin, L. M., Jaworska, N. & Crawford, S. Disorder-specific volumetric brain difference in adolescent major depressive disorder and bipolar depression. Brain Imaging Behav 8, 119–127 (2014).3. Alexander, L., Jelen, L. A., Mehta, M. A. & Young, A. H. The anterior cingulate cortex as a key locus of ketamine’s antidepressant action. Neurosci Biobehav Rev 127, 531–554 (2021).4. Yildiz-Yesiloglu, A. & Ankerst, D. P. Review of 1H magnetic resonance spectroscopy findings in major depressive disorder: a meta-analysis. Psychiat Res 147, 1–25 (2006).5. Sarawagi, A., Soni, N. D. & Patel, A. B. Glutamate and GABA Homeostasis and Neurometabolism in Major Depressive Disorder. Frontiers Psychiatry 12, 637863 (2021).6. Near, J. et al. Unedited in vivo detection and quantification of γ‐aminobutyric acid in the occipital cortex using short‐TE MRS at 3 T. NMR in Biomedicine 26, 1353–1362 (2013).7. Smith, G. S. et al. Neurotransmitters and Neurometabolites in Late-Life Depression: A Preliminary Magnetic Resonance Spectroscopy Study at 7T. J Affect Disorders 279, 417–425 (2021).8. Li, C.-X. et al. Cerebral Metabolic Changes in a Depression-like Rat Model of Chronic Forced Swimming Studied by Ex vivo High Resolution 1H Magnetic Resonance Spectroscopy. Neurochem Res 33, 2342–2349 (2008).9. Hussy, N., Deleuze, C., Desarménien, M. G. & Moos, F. C. Osmotic regulation of neuronal activity: a new role for taurine and glial cells in a hypothalamic neuroendocrine structure. Prog Neurobiol 62, 113–134 (2000).10. Schaffer, S. W., Ito, T. & Azuma, J. Clinical significance of taurine. Amino Acids 46, 1–5 (2014).11. Li, X.-W., Gao, H.-Y. & Liu, J. The role of taurine in improving neural stem cells proliferation and differentiation. Nutr Neurosci 20, 1–7 (2016).12. Wu, G.-F. et al. Antidepressant effect of taurine in chronic unpredictable mild stress-induced depressive rats. Sci Rep-uk 7, 4989 (2017).13. Mirza, Y. et al. Reduced Anterior Cingulate Cortex Glutamatergic Concentrations in Childhood Major Depression. J Am Acad Child Adolesc Psychiatry 43, 341–348 (2004).Figures
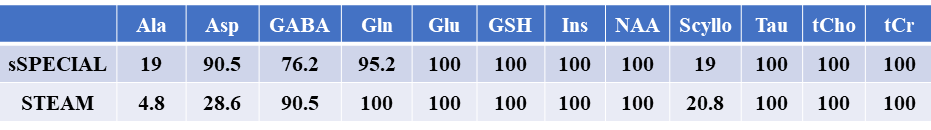
Table 1.
Percentage of measurements with %SD ≤ 20 of all subjects. Detectability of
neurochemicals are almost the same between the two sequences except Asp. Abbreviations:
Asp, asparate; Ala, alanine; Scyllo, scyllo-inositol.
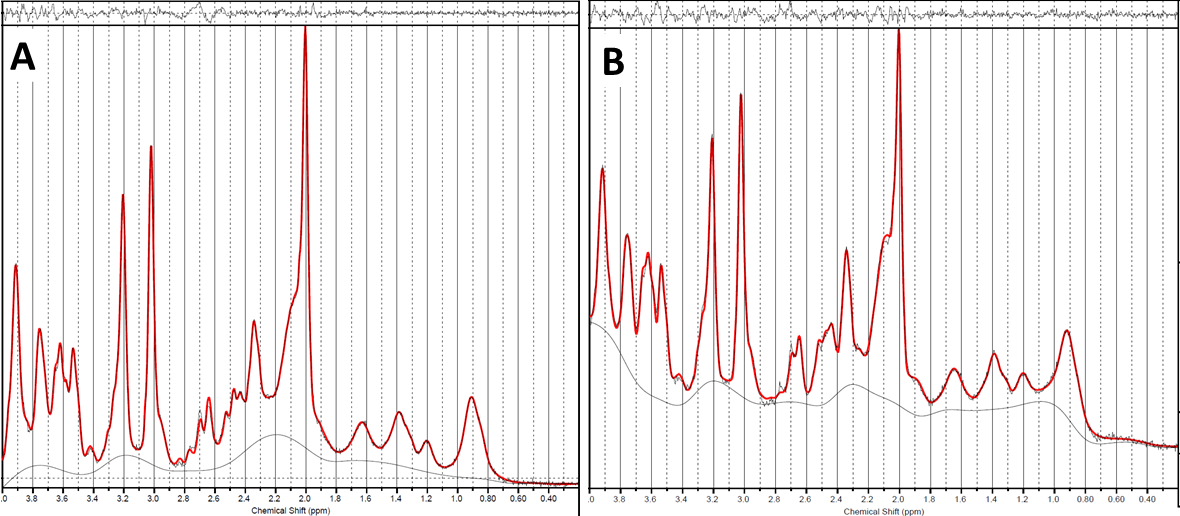
Figure 1.
Representative spectra of (A) sSPECIAL and (B) STEAM of a 48
years old male MDD patient.
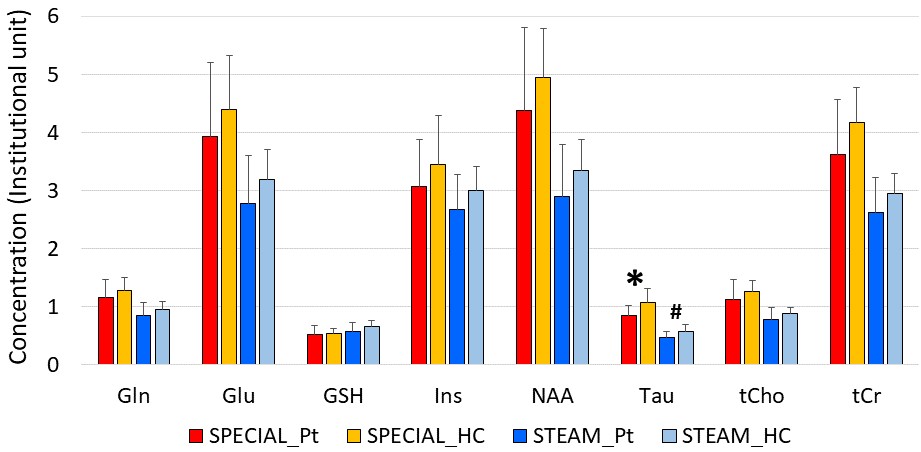
Figure 2.
Difference between Patients (Pt) and healthy controls (HC) of two sequences.
Significant
difference was observed in Tau (*p=0.02) in sSPECIAL. The difference in
STEAM was marginally significant (#p=0.06)
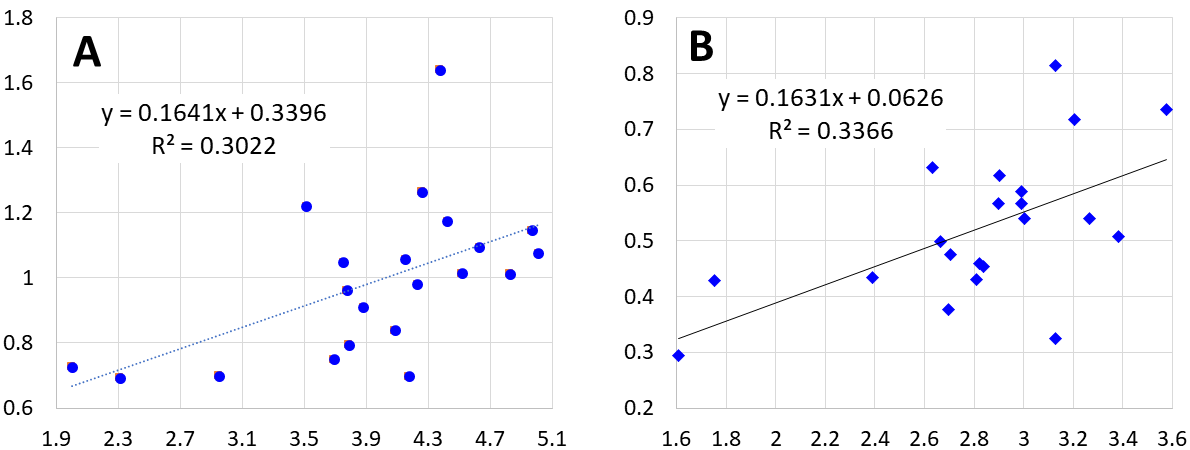
Figure 3. Correlation
between creatine (x-axis) and taurine (y-axis) of (A) SPECIAL and (B)
STEAM. The concentration is presented in institutional unit.
DOI: https://doi.org/10.58530/2022/3077