3073
White matter fiber-specific alterations in bipolar disorder: a fixel-based analysis1Graduate Institute of Mind, Brain, and Consciousness, Taipei Medical University, Taipei, Taiwan, 2Brain and Consciousness Research Centre, Taipei Medical University - Shuang Ho Hospital, New Taipei City, Taiwan, 3Institute for Radiological Research, Chang Gung University and Chang Gung Memorial Hospital, Taoyuan, Taiwan, 4Azrieli Adult Neurodevelopmental Centre, Campbell Family Mental Health Research Institute, and Adult Neurodevelopmental and Geriatric Psychiatry Division, Centre for Addiction and Mental Health, Toronto, ON, Canada, 5Department of Neuroscience, Rehabilitation, Ophthalmology, Genetics, Maternal and Child Health, Section of Psychiatry, University of Genoa, Genoa, Italy
Synopsis
The recent unified model of the pathophysiology of bipolar disorder (BD) proposed that micro/macrostructural disturbance in limbic white matter (WM) fibers is important in the pathophysiological mechanism of BD. To gain more insights into this model, preprocessed diffusion MRI data of 67 BD and 125 healthy participants were analyzed using fixel-based analysis. We found a reduction of fiber density and/or cross-section of tracts, including the fornix and cingulum bundle that are core elements of the limbic system. These findings robustly support an association of BD with a specific spatial pattern of WM alterations.
Introduction
Bipolar disorder (BD) has been associated with alterations in white matter (WM) microstructure1-3. However, it is still unclear if such alterations are widespread or involve specific WM tracts. This information is crucial to better understand the role of WM alterations in the pathophysiology of BD. The advanced fixel-based analysis4 (FBA) provides fiber tract-specific analysis at a within-voxel level (called ‘fixel’) as opposed to analyses of the conventional voxel-averaged metrics. FBA has been shown to be more sensitive and interpretable than voxel-wise methods. Therefore, the aim of this work is to investigate the spatial pattern of WM alterations in BD by using FBA.Methods
We recruited 67 patients with BD, either in manic, depressive, or euthymic phase, along with 125 age-matched healthy controls (HC) (see Table 1). Diffusion-weighted imaging (DWI) data were acquired on a 1.5T GE MRI scanner with an 8-channel head coil, using a single-shot spin-echo EPI sequence with the following parameters: 2.5-mm isotropic voxel, TR/TE = 13750/93.4 ms, 61 diffusion gradient directions at b=1000 s/mm2 and 5 b=0 volumes. All procedures were approved by the local Research Ethics Board.DWI data pre-processing included denoising5, Gibbs ringing removal6, corrections for image distortions7, inter-volume motions8, bias field9, and upsampling. Quality assessments were performed to ensure that the raw DWI data had no excessive signal loss, artifacts, or excessive in-scanner movement (average framewise displacement >1mm). A two-tissue constrained spherical deconvolution10 was adopted to compute fiber orientation distributions, followed by compartmental normalization to minimize intensity inhomogeneities. We then applied the standardized FBA processing steps4,11 to generate the FBA metrics of fiber density (FD, representing microstructural property), fiber cross-section (FC, estimating macrostructural morphometry), and combined FD and FC (FDC). The whole-brain fixel-wise statistical analysis of these metrics was conducted based on the general linear model as follows:
- Examining between-group disparity using two-sample t-tests: HC vs BD; BD in the active phases of illness (mania and depression) vs BD in the asymptomatic phase (euthymia).
- Dimensional analysis for brain-symptom correlation between the FBA metrics and clinical features, including illness duration, medication dose equivalents (mood stabilizer, antipsychotic, antidepressant, benzodiazepine), alongside total medication loads3 (sums of the preceding four classes), respectively, within the BD group.
Results
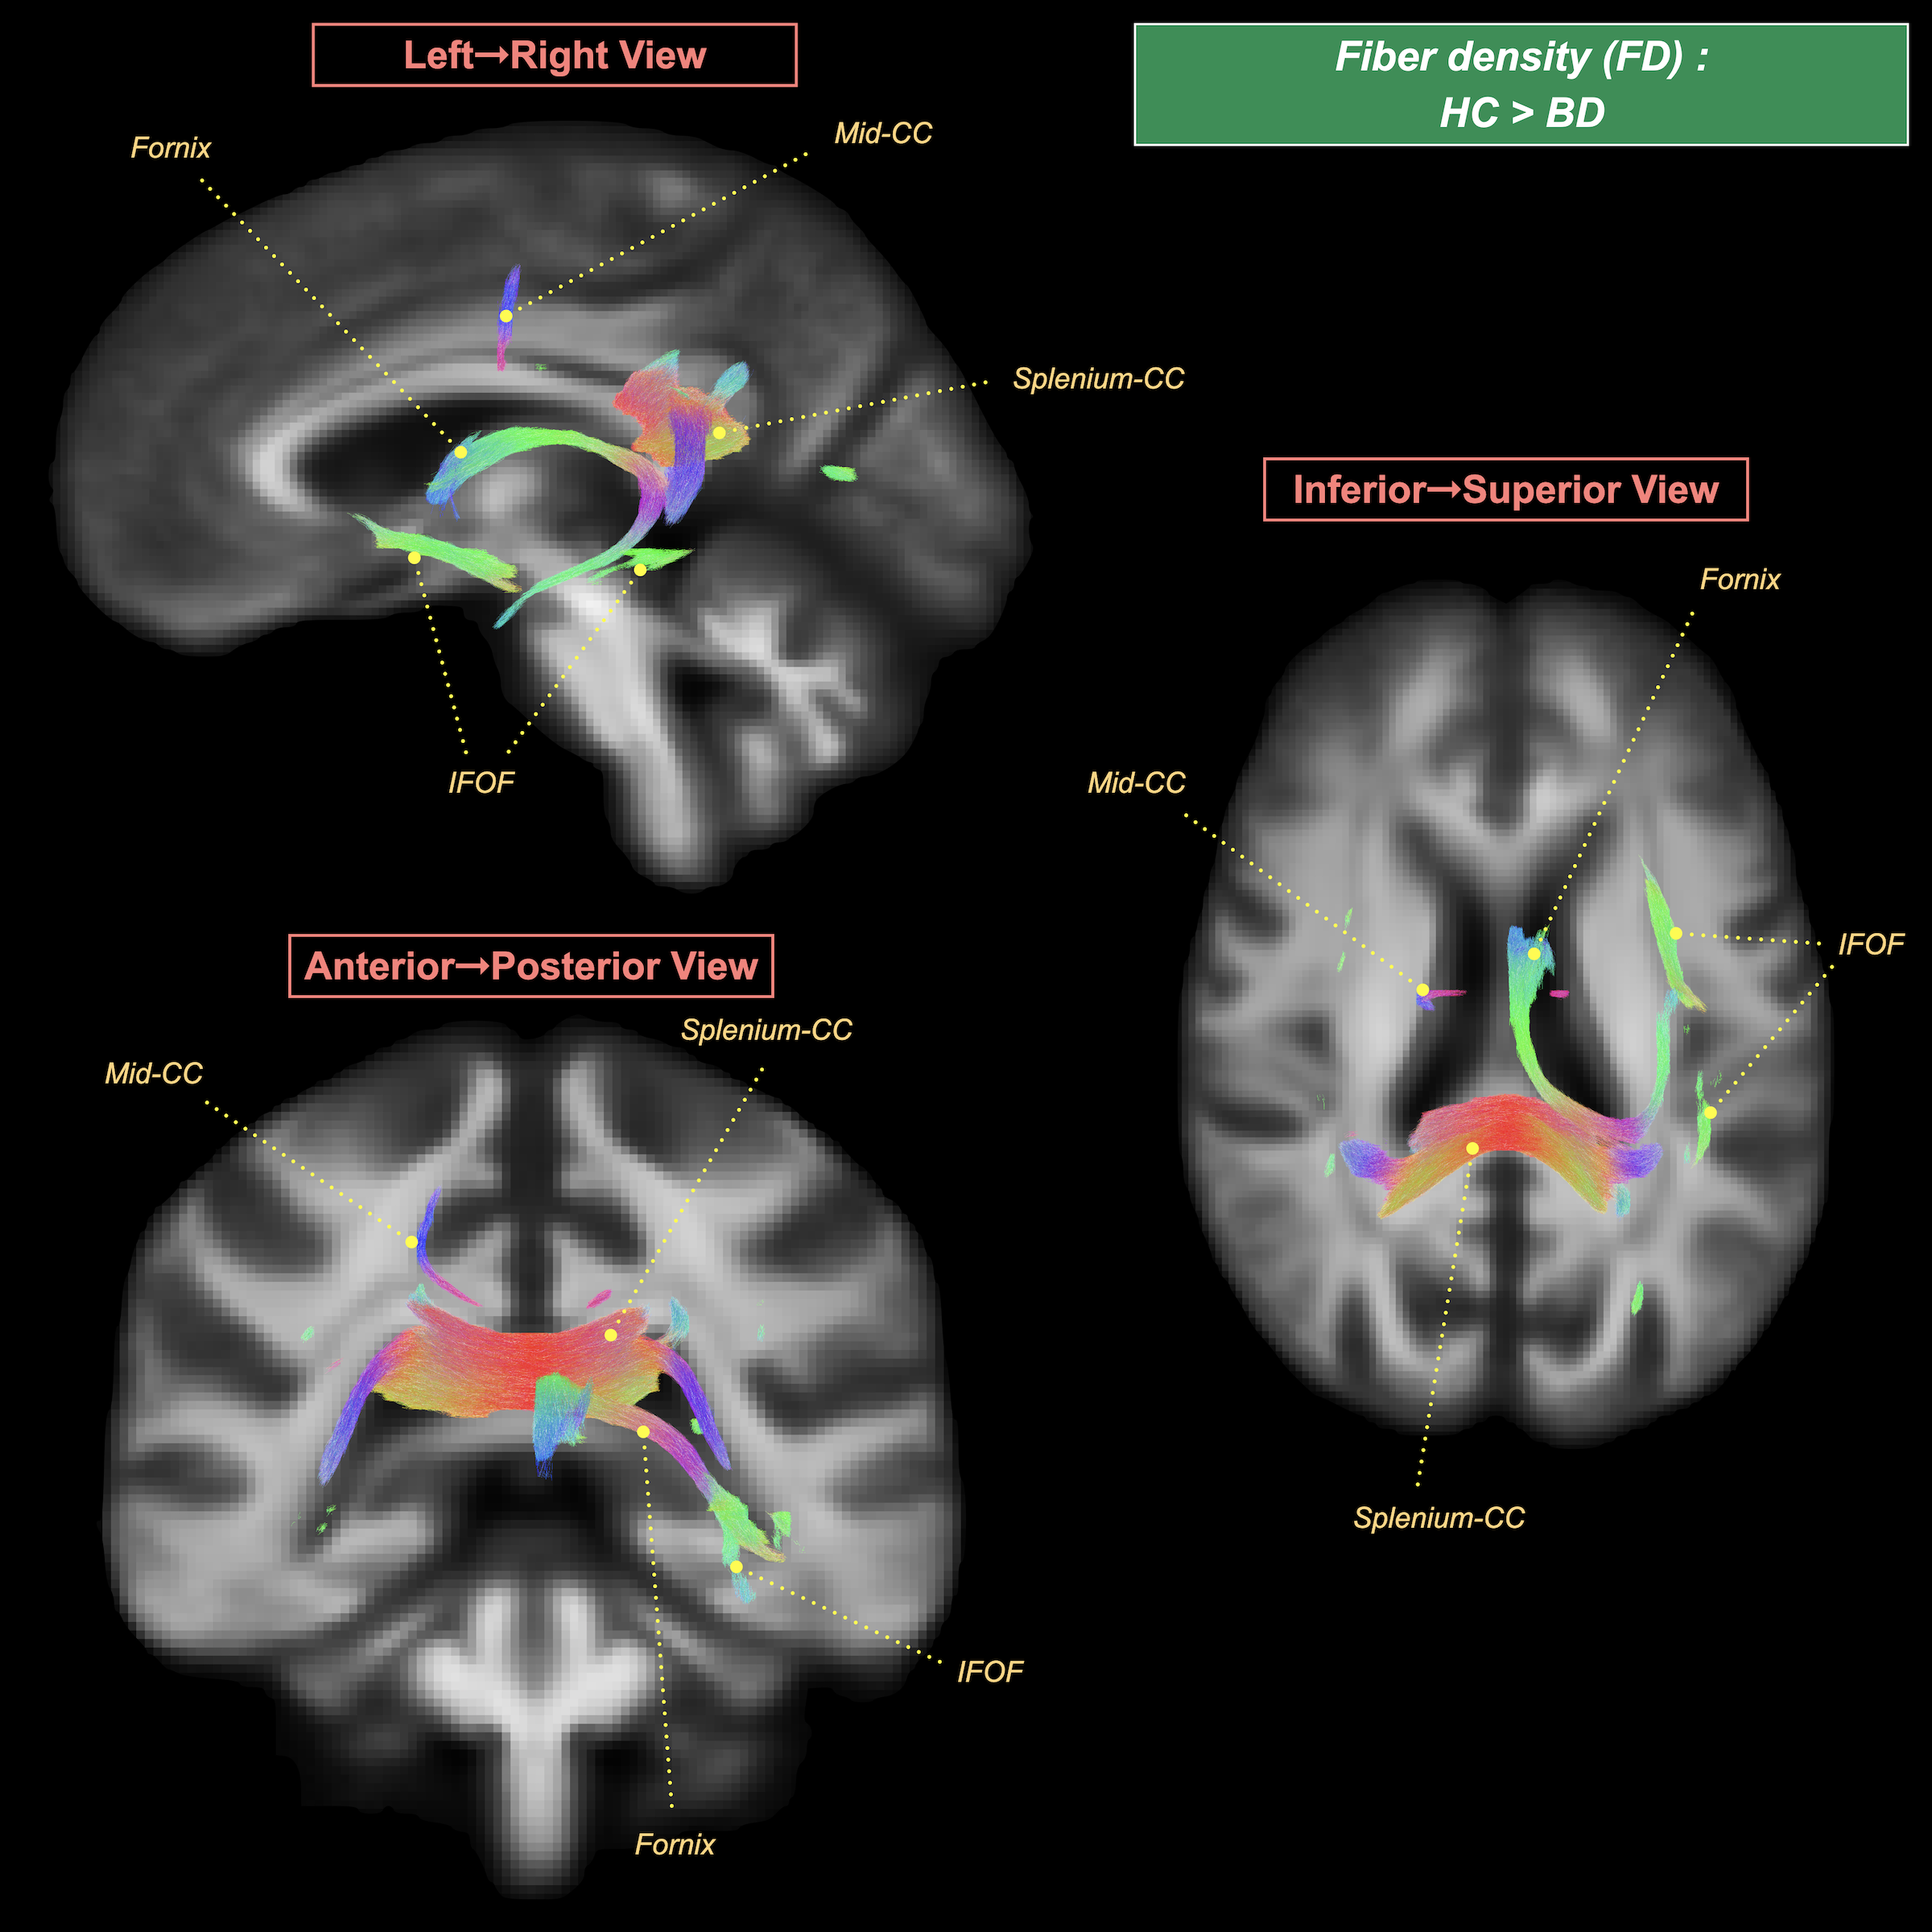
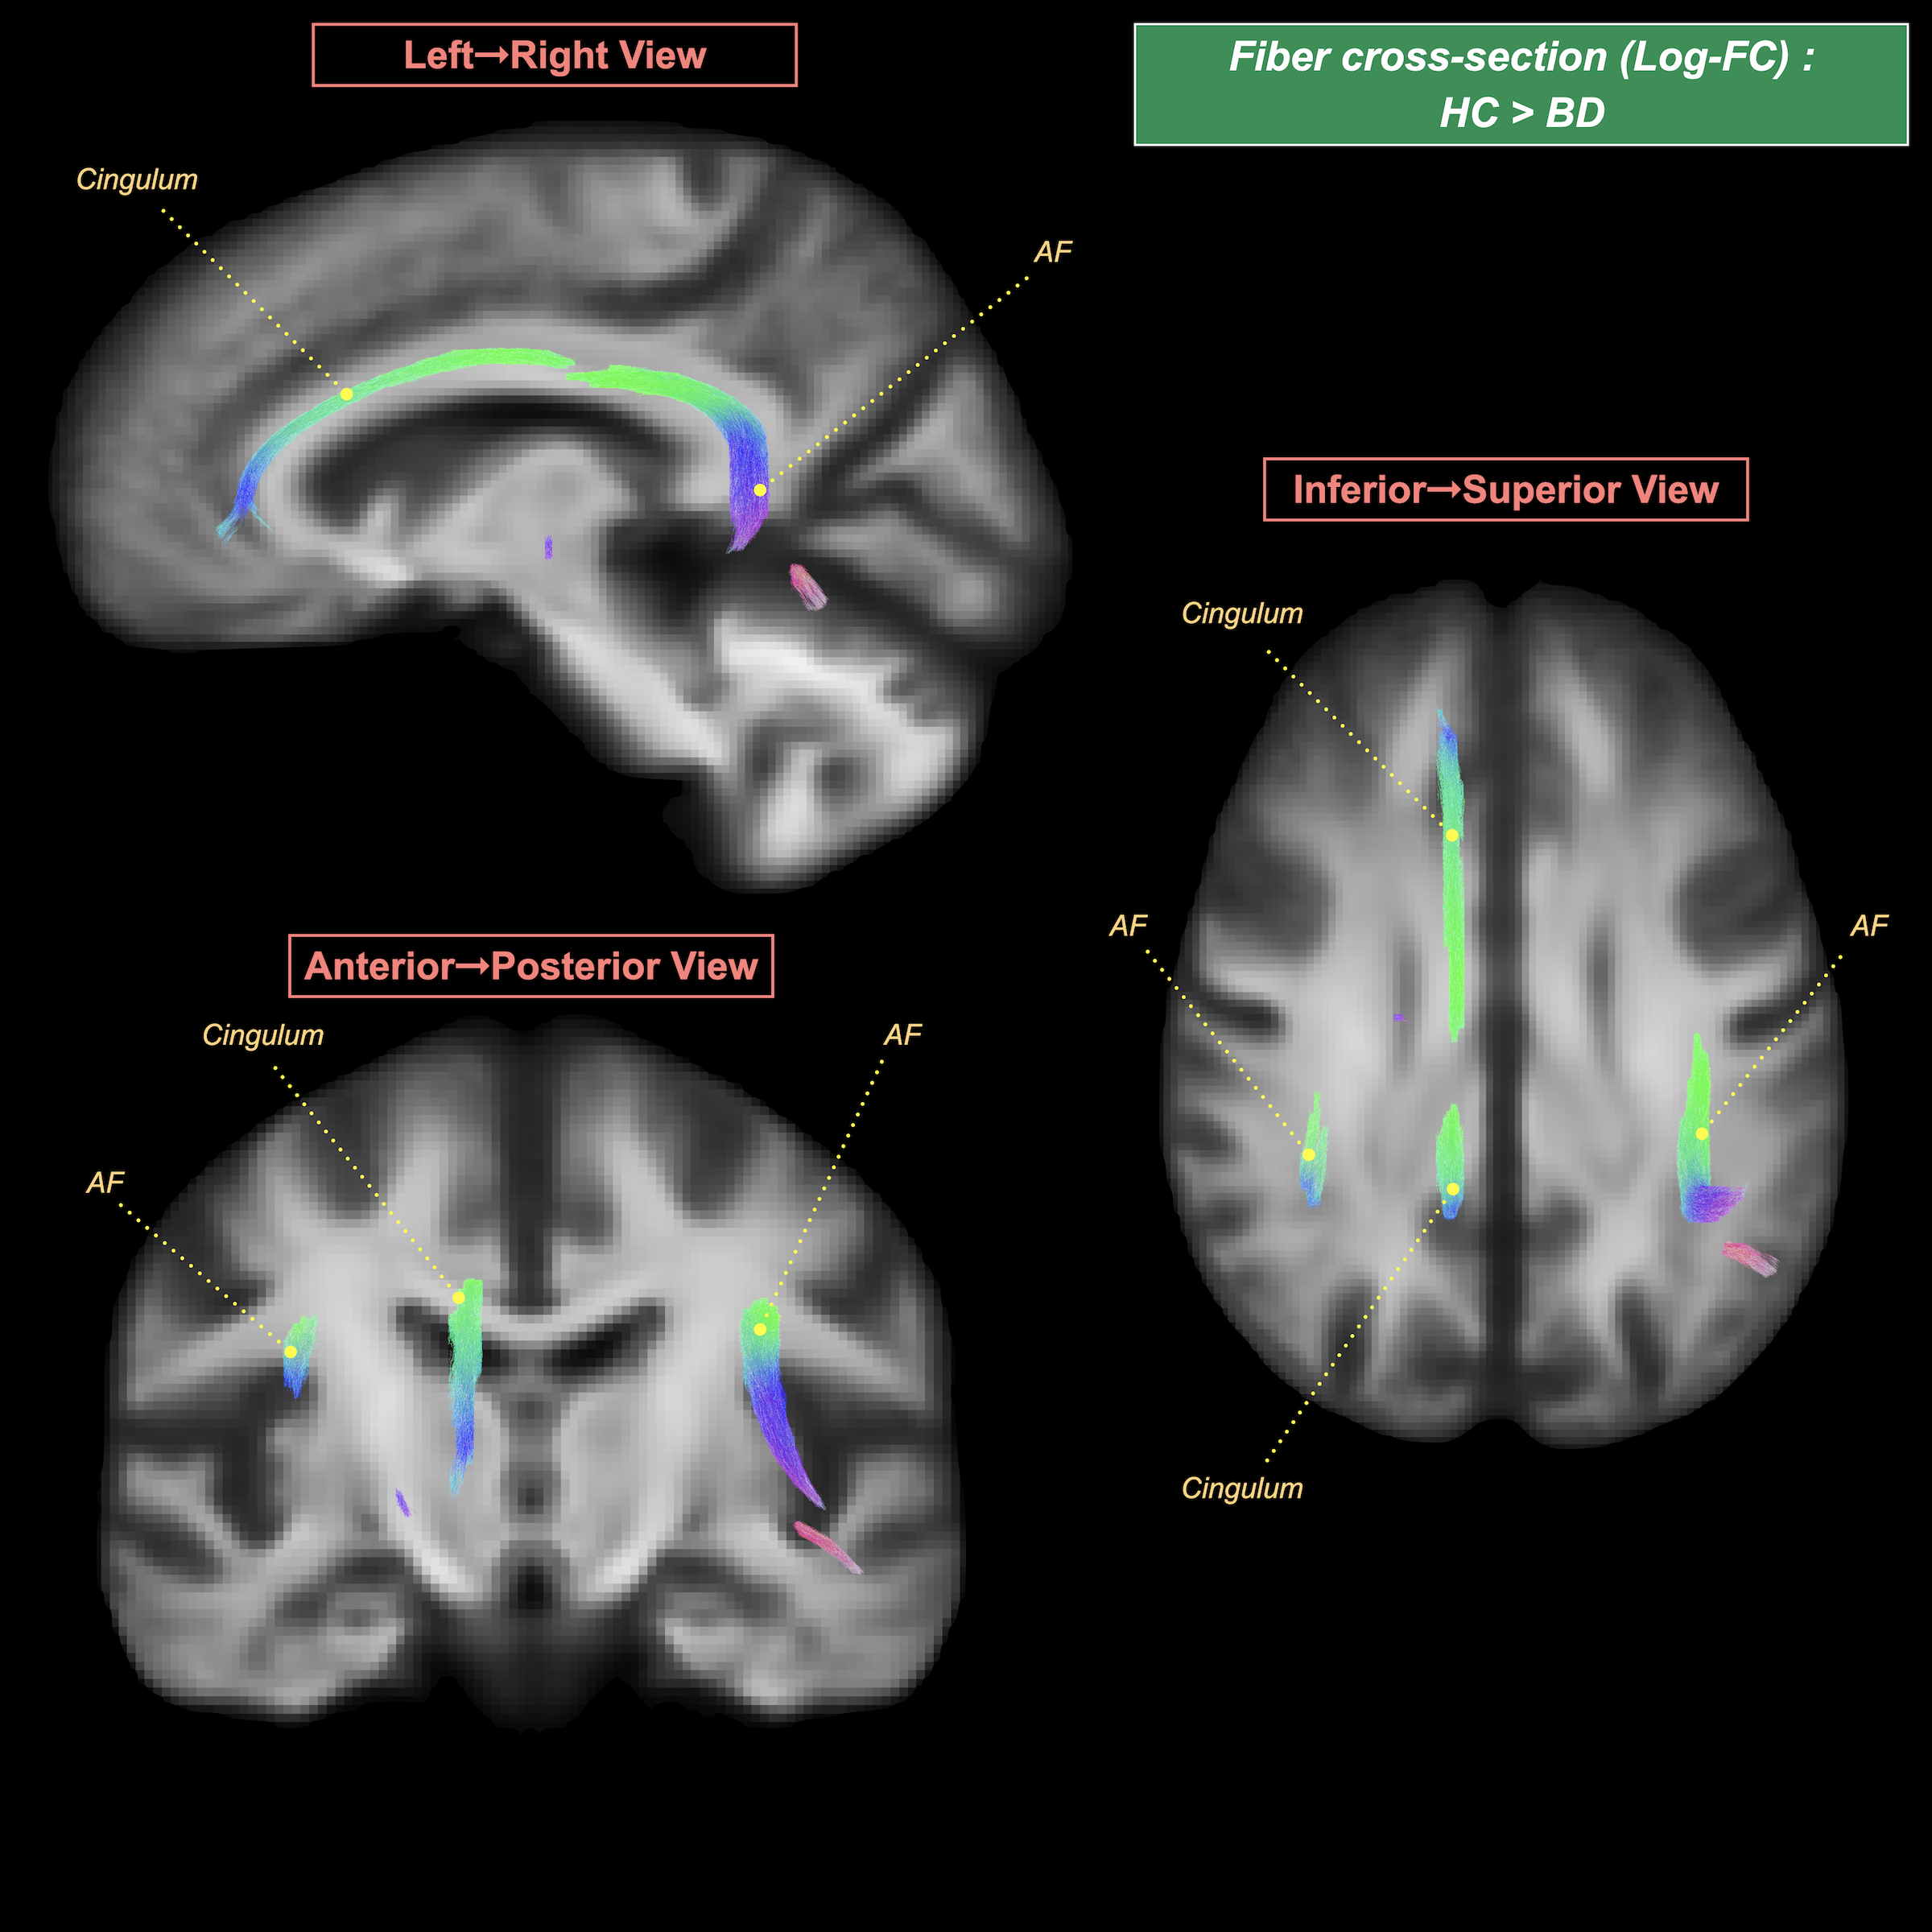
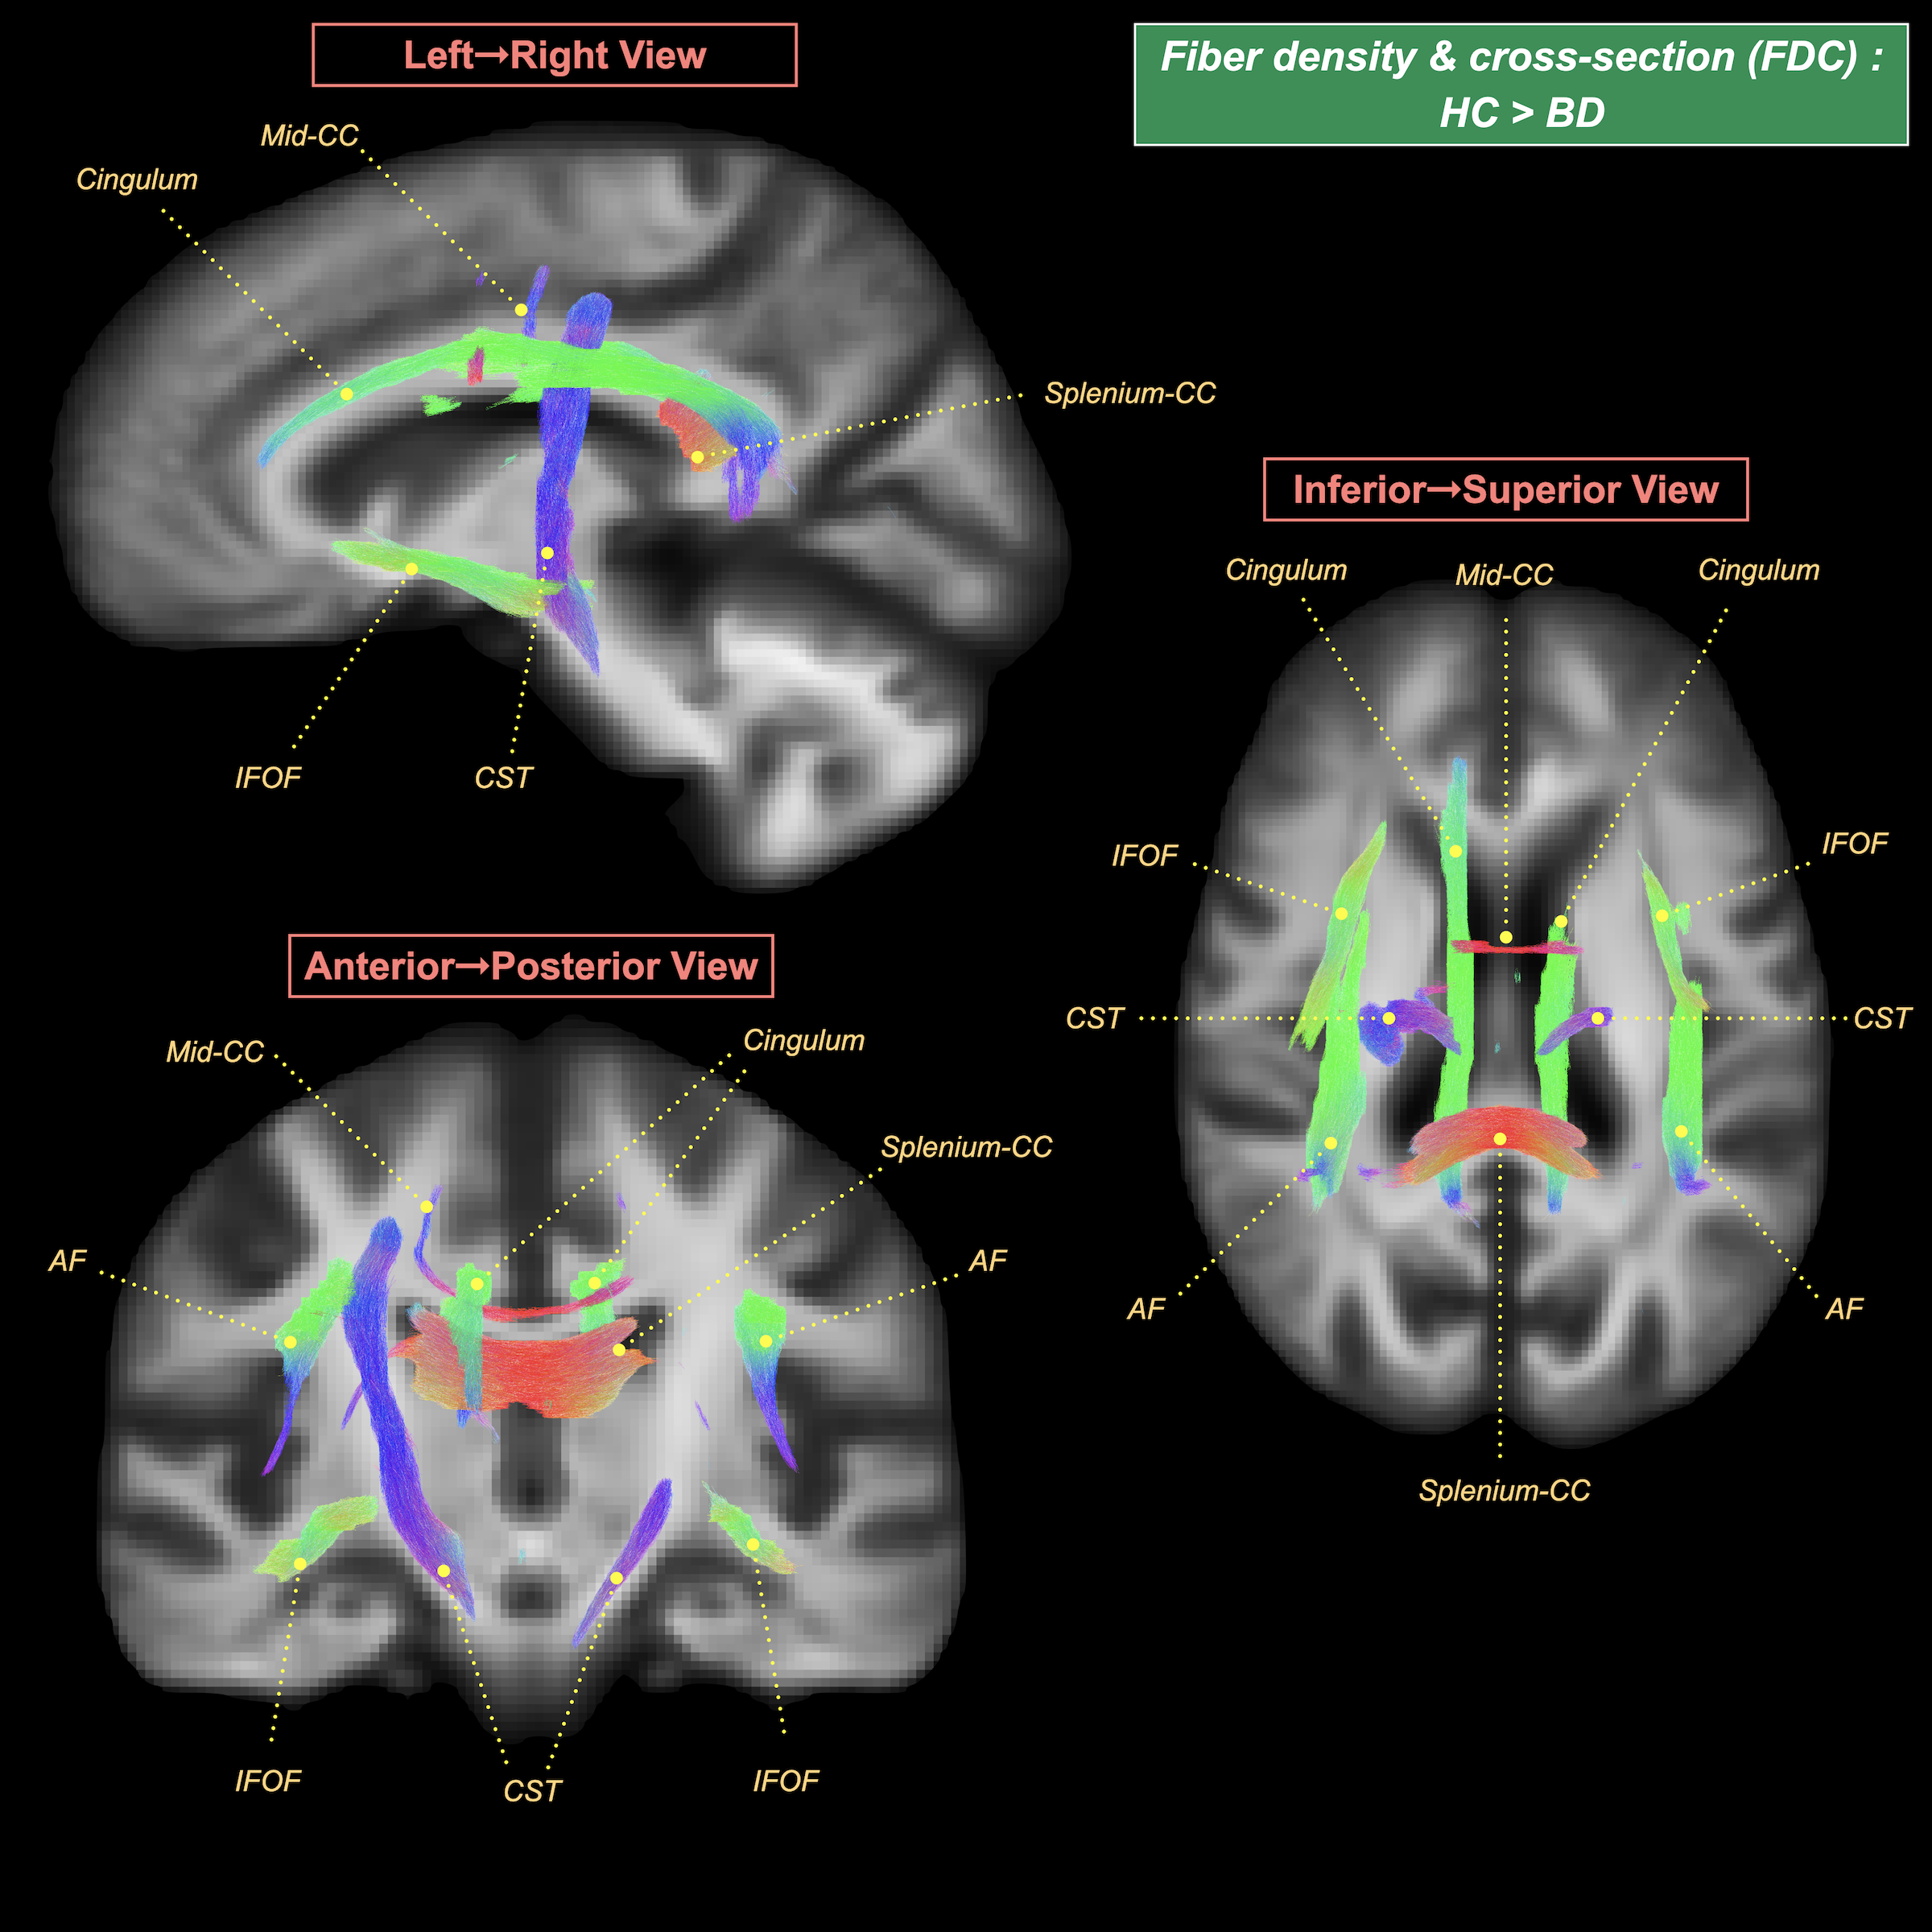
BD patients, relative to HC, showed: (i) a significant FD decrease in the left fornix and fronto-occipital fascicle, along with the mid-body and splenium of corpus callosum (Figure 1); (ii) a significant FC decrease in the bilateral cingulum and arcuate fascicle (Figure 2); and (iii) a significant FDC decrease in the bilateral cingulum, inferior fronto-occipital fascicle, arcuate fascicle, and corticospinal tract, along with the mid-body and splenium of corpus callosum (Figure 3).No significant differences in the FBA metrics were detected between BD in the active phases and BD in the asymptomatic phase.
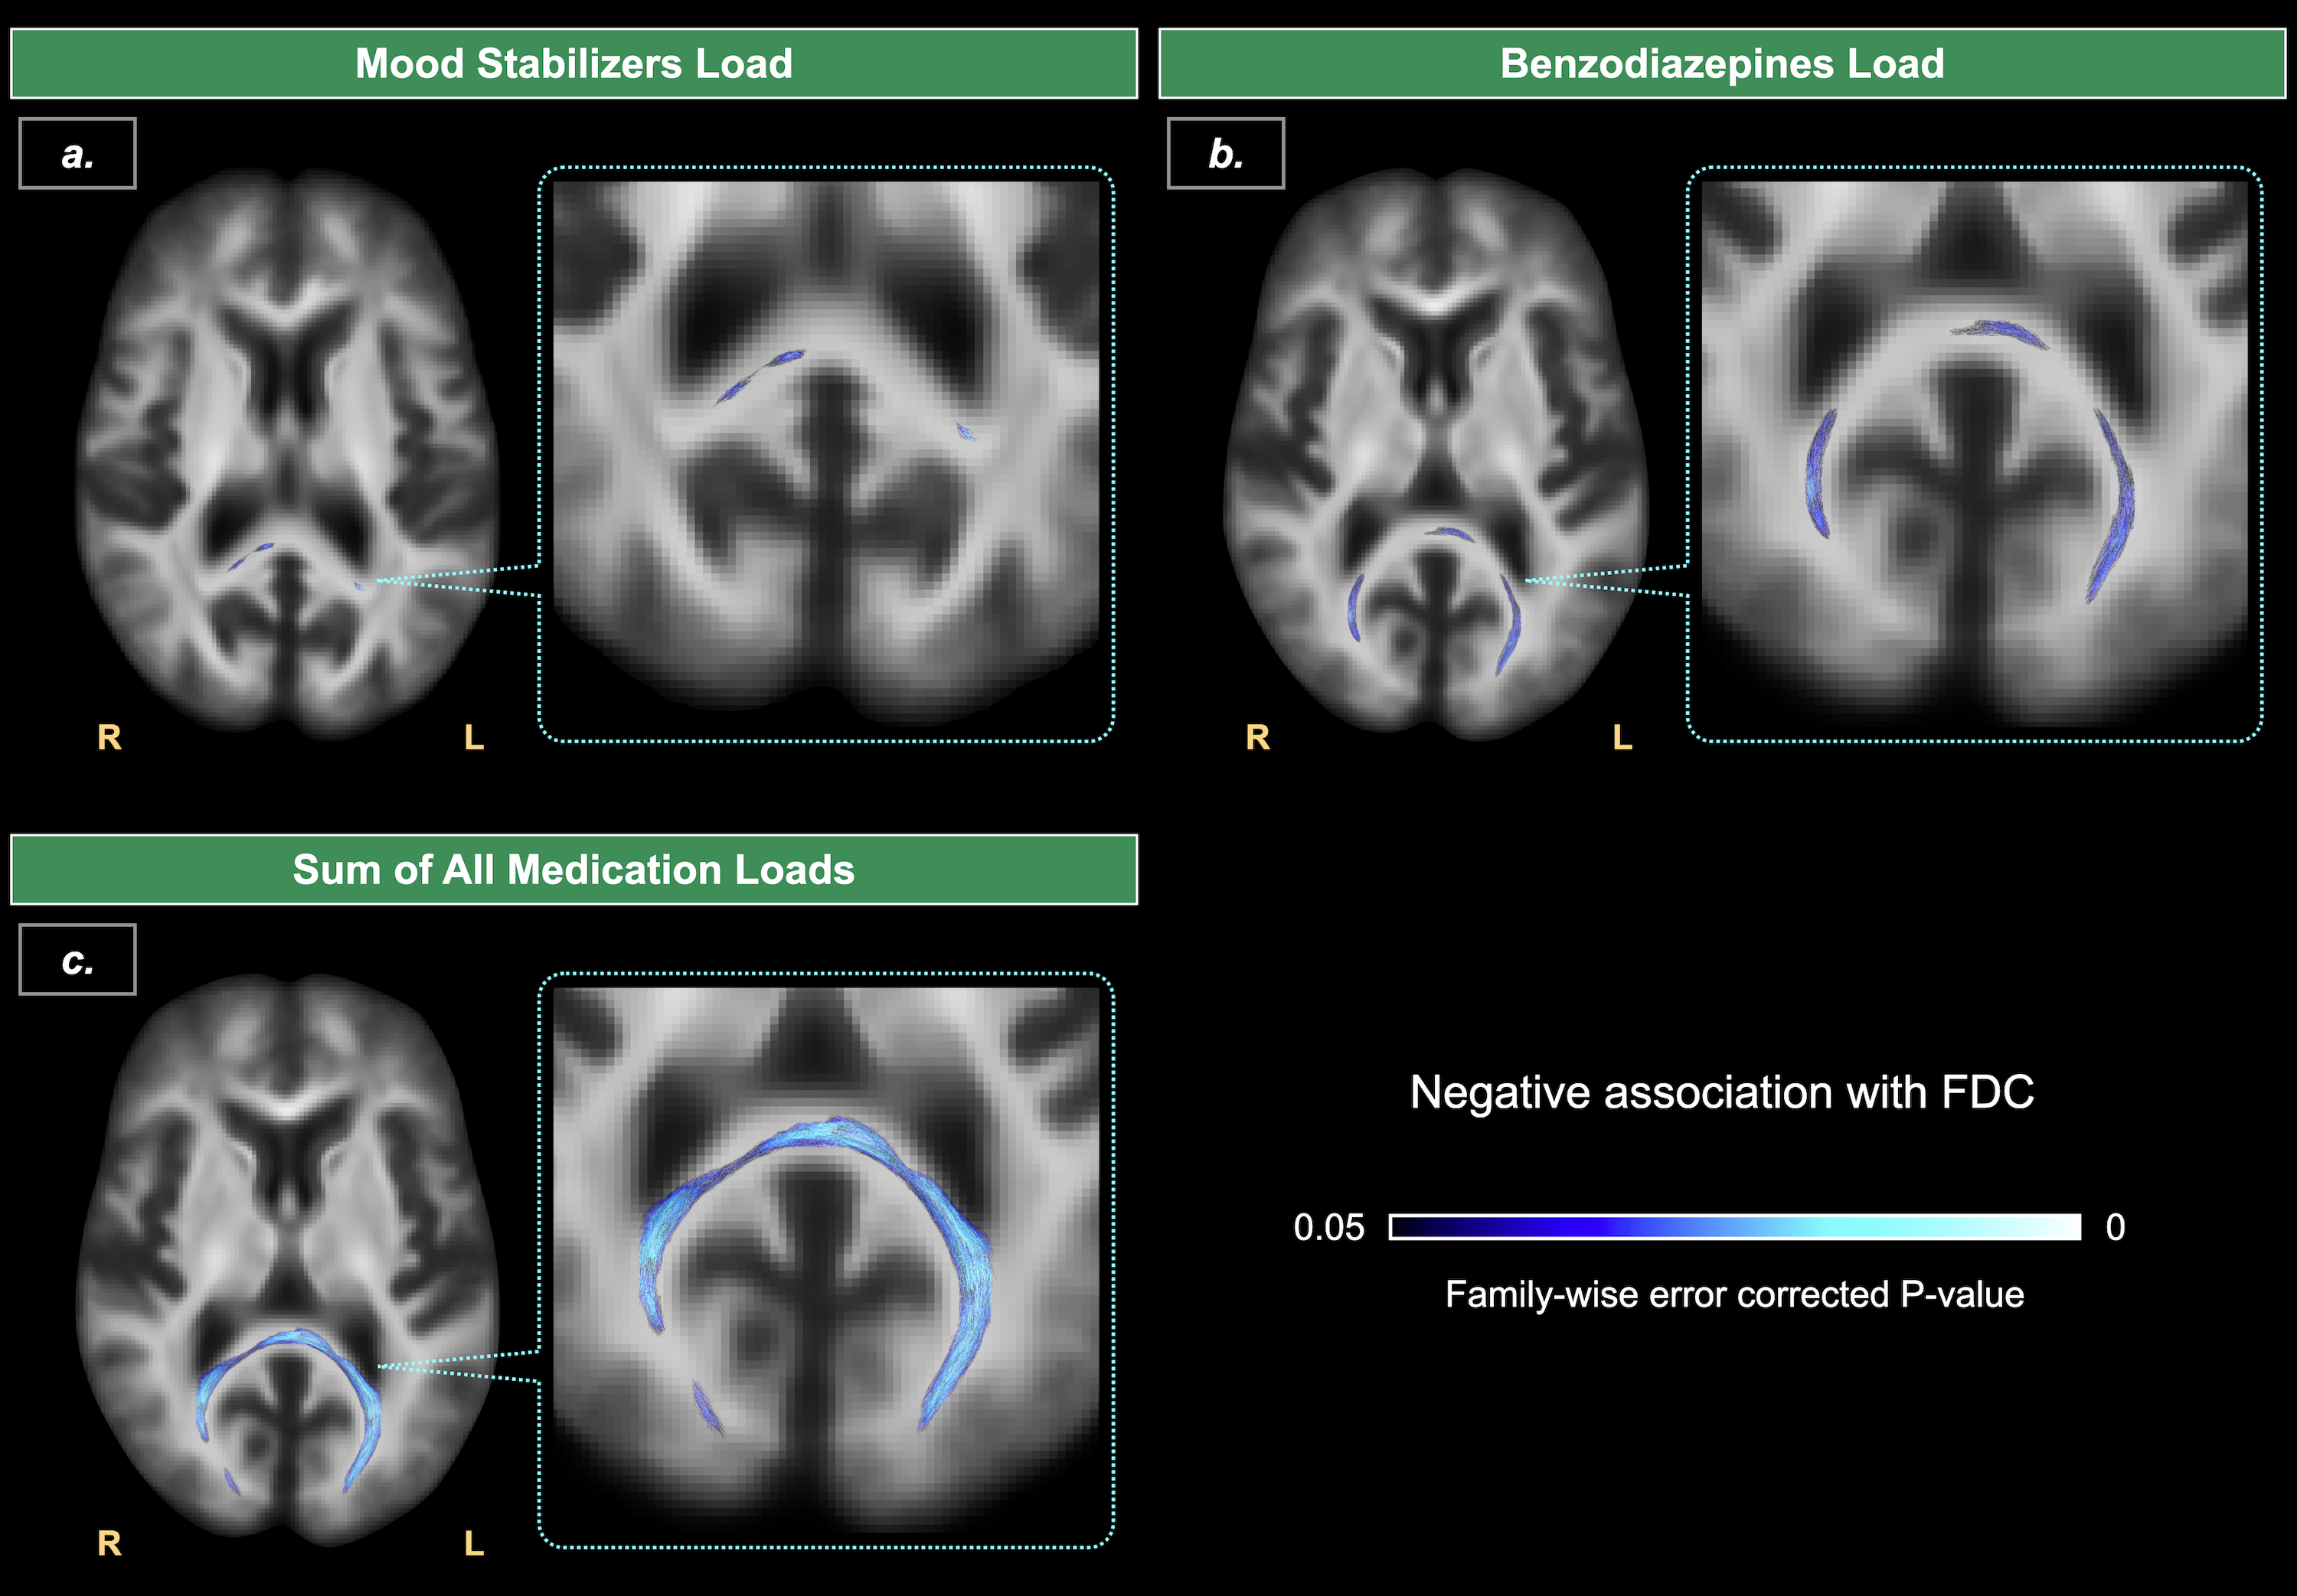
Dimensionally, the illness duration was not significantly associated with any FBA metrics. We found negative correlations of mood stabilizer, benzodiazepine dose equivalents, alongside total medication loads with the FDC of the splenium of corpus callosum (see Figure 4).
Discussion & Conclusion
The findings of this work robustly support an association of BD with a specific spatial pattern of WM alterations, i.e., a reduction of fiber density and/or cross-section of tracts such as the fornix and cingulum bundle that are core elements of the limbic system. Therefore, in accordance with our recently proposed unified model of the pathophysiology of BD, we suppose that a WM damage of the limbic system plays a key role in the neurobiology of this disorder12.Acknowledgements
P.M. received support from the Taiwan Ministry of Science and Technology (109-2314-B-038-138-MY2 and 110-2628-B-038-015-). M.M. received support from the Taiwan Ministry of Science and Technology (109-2314-B-038-139-MY2) and from Taipei Medical University (TMU108-AE1-B56). C.-H.Y. received support from the Taiwan Ministry of Science and Technology (109-2222-E-182-001-MY3).References
1. Magioncalda P, Martino M, Conio B, Piaggio N, Teodorescu R, Escelsior A et al. Patterns of microstructural white matter abnormalities and their impact on cognitive dysfunction in the various phases of type I bipolar disorder. Journal of affective disorders. 2016; 193: 39-50.
2. Martino M, Magioncalda P, Saiote C, Conio B, Escelsior A, Rocchi G et al. Abnormal functional-structural cingulum connectivity in mania: combined functional magnetic resonance imaging-diffusion tensor imaging investigation in different phases of bipolar disorder. Acta Psychiatr Scand. 2016; 134(4): 339-349.
3. Magioncalda P, Martino M, Tardito S, Sterlini B, Conio B, Marozzi V et al. White matter microstructure alterations correlate with terminally differentiated CD8+ effector T cell depletion in the peripheral blood in mania: Combined DTI and immunological investigation in the different phases of bipolar disorder. Brain Behav Immun. 2018; 73: 192-204.
4. Raffelt DA, et al. Investigating white matter fibre density and morphology using fixel-based analysis. Neuroimage. 2017; 144: 58–73.
5. Veraart J, et al. Diffusion MRI noise mapping using random matrix theory. Magn Reson Med. 2016; 76: 1582–93.
6. Kellner E, et al. Gibbs-ringing artifact removal based on local subvoxel-shifts. Magn Reson Med. 2016; 76: 1574–1581.
7. Schilling KG, et al. Distortion correction of diffusion weighted MRI without reverse phase-encoding scans or field-maps. PLoS ONE. 2020; 15(7): e0236418.
8. Andersson JLR and Sotiropoulos SN. An integrated approach to correction for off-resonance effects and subject movement in diffusion MR imaging. NeuroImage. 2016; 125: 1063–1078.
9. Tustison N, et al. N4ITK: Improved N3 Bias Correction. IEEE Trans on Medical Imaging. 2010; 29: 1310–1320.
10. Jeurissen B, et al. Multi-tissue constrained spherical deconvolution for improved analysis of multi-shell diffusion MRI data. Neuroimage. 2014; 103: 411–426.
11. Tournier JD, et al. MRtrix3: A fast, flexible and open software framework for medical image processing and visualisation. NeuroImage. 2019; 202: 116–37.
12. Magioncalda P, Martino M. A unified model of the pathophysiology of bipolar disorder. Mol Psychiatry. Apr 15 2021.
Figures