3068
Quantitative Evaluation of Substantia Nigra Degeneration in Parkinson’s Disease using T1 mapping1Graduated School of Health Sciences, Kumamoto University, Kumamoto, Japan, 2Department of Medical Image Sciences, Faculty of Life Sciences, Kumamoto University, Kumamoto, Japan, 3Faculty of Medicine, Saga University, Saga, Japan, 4Department of Neurology, National Hospital Organization Omuta National Hospital, Omuta, Japan, 5Department of Radiology, National Hospital Organization Omuta National Hospital, Omuta, Japan
Synopsis
We evaluated the T1 values of the whole and subregions of the substantia nigra (SN) in patients with Parkinson's disease (PD) to identify an imaging biomarker for the early diagnosis of PD. T1 values of the SN of patients with PD were significantly shorter than those of healthy controls and tended to be longer in the lateral part for both groups. T1 values may reflect the pathology of the SN and help assess the degeneration of the SN caused by PD.
INTRODUCTION
Parkinson's disease (PD) is a neurodegenerative disease that causes motor and cognitive deficits due to degeneration and loss of neurons in the substantia nigra (SN) of the midbrain. The diagnosis of PD is based on the clinical course, symptoms, and neurological findings, and magnetic resonance imaging (MRI) is used to exclude other diseases.Neuromelanin-sensitive imaging (NMI) can be used to assess SN degeneration. However, it is challenging to detect small signal changes in the SN because the signal acquired by NMI depends on the scanner and imaging parameters.
Recently, quantitative imaging techniques for the evaluation of the SN, such as R2*, QSM, and fractional anisotropy, have been proposed as imaging biomarkers. A multiparametric evaluation, rather than using a single parameter, is needed to accurately diagnose early SN degeneration and differentiate it from other diseases. Due to the fact that neuromelanin deposited in the SN has paramagnetic properties, the use of the T1 value may be applicable for assessing SN degeneration.
We previously evaluated the T1 value of the SN in healthy subjects and compared it with the NMI contrast. However, the relationship between SN degeneration and changes in T1 values is unclear. Thus, the purpose of this study was to investigate whether T1 values can be used as biomarkers to assess SN degeneration in PD.
MATERIALS AND METHODS
This study was performed using a 3.0-T MRI with a phased-array coil (Ingenia, Philips Healthcare, Best, The Netherlands). Fifteen healthy controls (HCs) (mean age, 59.4 years; age range, 55–69 years) and 15 patients with PD (mean age, 73.5 years; age range, 45–85 years) were enrolled. All subjects were imaged using a 3D phase-sensitive inversion recovery (PSIR) sequence to obtain the T1 map of the SN. The 3D PSIR sequence consists of a non-selective inversion pulse and turbo field echo readouts at two inversion times. The T1 value was calculated voxel-by-voxel using two TI images (PSIR and reference images). The specific method used was the same as that previously reported. Regions of interest (ROIs) of both SNs were manually placed on the magnitude image obtained by the PSIR sequence. The T1 value and the high-signal area in both SNs were measured for all subjects. Furthermore, the T1 values of three subregions of the SN (central, medial, and lateral parts) were measured. Three circular ROIs were set on the SN ROIs with equal spaces. The T1 value and area of the SN were compared between the HC and PD groups. The relationship between the Hoehn and Yahr stage and their measurements was also investigated in patients with PD.RESULTS
Figure 1 shows representative magnitude images and T1 maps for the volunteers and patients with PD. There was no significant difference in the SN area between the HC and PD groups (p = 0.29) (Fig. 2). The T1 value of the SN in the PD group was significantly shorter than that in the HC group (p = 0.04) (Fig. 3). The T1 values of the different regions of the SN tended to be longer, from medial to lateral, in both the HC and PD groups (Fig. 4). The T1 values of the SN for PD were shorter in patients with a higher Hoehn and Yahr stage (r = -0.42) (Fig. 5).DISCUSSION
In the HC group, the T1 value of the SN was prolonged toward the lateral side (medial < central < lateral). These results suggest that the amount of local neuromelanin is related to the T1 value. On the other hand, the T1 value of the SN for PD was significantly shorter than that for HC. Moreover, the shortening of T1 in patients with PD was substantial in the central and lateral areas among all regions. Given that the lateral part of the SN is more vulnerable, and that degeneration proceeds in the earlier stage, the SN T1 value in the lateral region may be an imaging biomarker for assessing SN degeneration. However, the mechanism of T1 shortening associated with SN degeneration remains unclear. Excessive iron deposition due to abnormal iron metabolism may shorten the T1 value of the SN, and further investigation is needed.CONCLUSION
Quantification of the T1 value of the SN may be a valuable biomarker for assessing SN degeneration.Acknowledgements
No Acknowledgements.References
- Sasaki M, Shibata E, Tohyama K, et al. Neuromelanin magnetic resonance imaging of locus ceruleus and substantia nigra in Parkinson's disease. Neuroreport. 2006;17(11):1215-1218.
- Baudrexel S, Nürnberger L, Rüb U, et al. Quantitative mapping of T1 and T2* discloses nigral and brainstem pathology in early Parkinson's disease. Neuroimage. 2010;51(2):512-520.
- Fujiwara Y, Hirai T, Ueda T, et al. Quantitative T1 mapping of the substantia nigra using phase-sensitive inversion recovery sequence at 3.0-T: a healthy volunteer study. Acta Radiologica. 2020;62(2):243-250
- Sulzer D, Cassidy C, Horga G, et al. Neuromelanin detection by magnetic resonance imaging (MRI) and its promise as a biomarker for Parkinson’s disease. npj Parkinson’s disease. 2018;11.
- Gibb WRG, Lees AJ. Anatomy, pigmentation, ventral and dorsal subpopulations of the substantia nigra and differential cell death in Parkinson's disease. Journal of Neurology, Neurosurgery, and Psychiatry. 1991;54:388-396.
Figures
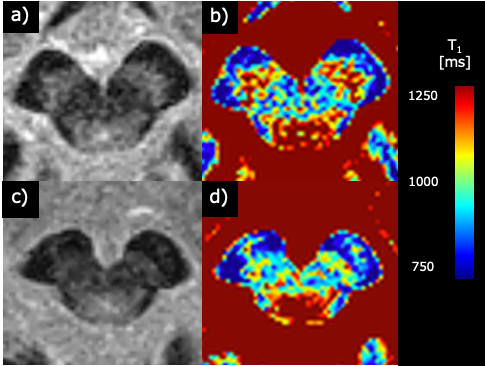
Figure 1
Representative images of healthy controls (69-year-old woman, (a) and (b)) and PD patients (75-year-old woman, (c) and (d)). (a) and (c) are Magnitude images. (b) and (d) are T1 value images.
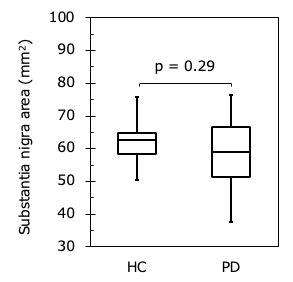
Figure 2
Comparison of substantia nigra area in HC and PD. There was no significant difference between two groups (p = 0.29).
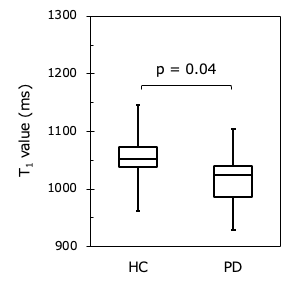
Figure 3
Comparison of the T1 value of the SN in HC and PD. The T1 value of the SN in PD was significantly shorter than that in HC (p = 0.04).
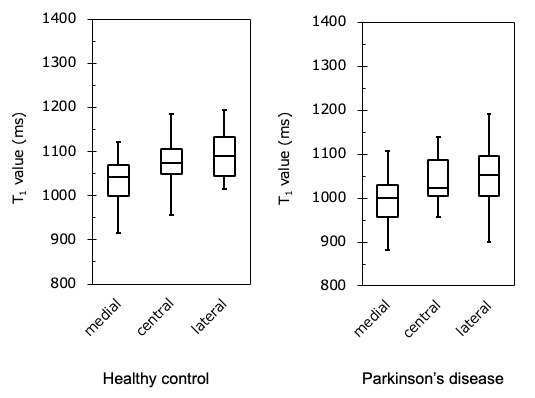
Figure 4
Comparison of the T1 value of the segmented SN in HC and PD. The T1 value was prolonged from medial to lateral in both groups.
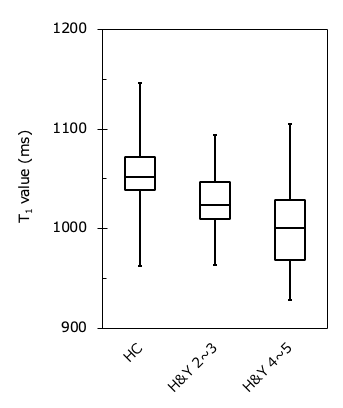
Figure 5
Comparison of the T1 value in PD classified by severity. The higher the severity of the disease, the T1 value of SN was tended to be shortened.