3067
Relaxometry of the Substantia Nigra Pars Compacta and Subsegment Analysis: A Healthy Volunteer Study
Yasuhiro Fujiwara1, Shota Ishida2, Yuki Matta3, Masayuki Kanamoto3, and Hirohiko Kimura4
1Department of Life Sciences, Fuculty of Medical Image Sciences, Kumamoto University, Kumamoto, Japan, 2Department of Radiological Technology, Faculty of Medical Sciences, Kyoto College of Medical Science, Kyoto, Japan, 3Radiological Center, University of Fukui Hospital, Fukui, Japan, 4Department of Radiology, University of Fukui, Fukui, Japan
1Department of Life Sciences, Fuculty of Medical Image Sciences, Kumamoto University, Kumamoto, Japan, 2Department of Radiological Technology, Faculty of Medical Sciences, Kyoto College of Medical Science, Kyoto, Japan, 3Radiological Center, University of Fukui Hospital, Fukui, Japan, 4Department of Radiology, University of Fukui, Fukui, Japan
Synopsis
An anatomical atlas of the three regions (medial, dorsal, and ventrolateral) of the substantia nigra pars compacta (SNpc) were created based on neuromelanin (NM)-sensitive images, and Proton density, T1, and T2 values for each region were characterized in healthy volunteers. The T1 value of the ventrolateral group was higher than the other SNpc regions, which may be correlated with the NM concentration. The measured relaxation times can be used as baseline values for the SNpc.
INTRODUCTION
Parkinson’s disease is a neurodegenerative disorder, caused by a lack of dopamine due to neuronal cell loss in the substantia nigra pars compacta (SNpc) within the midbrain. The SNpc contains neuromelanin (NM) and can be histologically divided into four regions (cell groups) based on differing concentrations of NM: the paranigral nucleus (PN), medial group (MG), ventrolateral group (VG), and dorsal group (DG).1 NM concentration is highest in the MG and DG, followed by the PN, and lastly, VG.1 The progression of Lewy body pathology is parallel to neuronal loss, which in the SNpc begins in the VG, spreads to the PN, the MG, and finally the DG.2 Therefore, it is essential to detect degeneration in the VG to assess early degeneration. Although several studies have evaluated the regions of the SNpc, no established, direct imaging techniques are currently available to evaluate their degeneration. Quantitative synthetic MRI is used to quantify the proton density (PD), T1, and T2 values using a single pulse sequence.3 If the PD, T1, and T2 values of the SNpc can be measured using quantitative synthetic MRI and evaluated based on each region, they can be used to assess degeneration in detail; however, baseline PD, T1, and T2 values of healthy individuals, and their changes with age have not been reported. The purpose of the present study was to perform atlas-based relaxometry in healthy volunteers using an anatomical atlas of the SNpc and obtain regional relaxation time baseline values.METHODS
Twenty-seven healthy volunteers (20 men; aged 36.3 ± 11.5 years, range: 21–59 years), with no major medical conditions or neurological or psychiatric disorders, were enrolled. This study was approved by our institutional review board. Written informed consent was obtained from all participants. MRI acquisition was performed using a 3.0 T MRI system (Discovery MR 750; GE Healthcare). First, a whole-brain 3D T1-weighted image and 2D NM image was obtained. Next, Synthetic MRI was performed using a 2D multi-dynamic multi-echo sequence (MAGiC) with the same location and orientation as NM imaging to obtain T1, T2, and PD maps. 18 Next, The NM-sensitive images and PD, T1, and T2 maps were co-registered to individual 3D T1-weighted images. Co-registered maps were then normalized to the MNI-space template. The spatially normalized NM-sensitive images were used to produce an anatomical atlas for the SNpc. The VOIs of the SNpc were determined based on the estimated boundaries. A probability density map was created and then binarized. Finally, the binarized mask image was defined as the anatomical SNpc atlas. The anatomical SNpc atlas was manually divided into three regions (i.e., MG, VG, and DG). The PD, T1, and T2 values in the MG, VG, and DG for all participants were measured using the segmented SNpc template. A one-way analysis of variance was used to compare the PD, T1, and T2 values for the MG, DG, and VG of the SNpc. Post-hoc comparisons were performed using Tukey's test. The Pearson correlation coefficient (r) was used to test correlations between age and the PD, T1, and T2 values of each segment of the SNpc.RESULTS
Figure 1 shows the anatomical and segmented SNpc atlas produced by the NM-sensitive images and Figure 2 shows the average PD, T1, and T2 maps of the SNpc template. PD, T1, and T2 values of the whole SNpc were 0.73 ± 0.018 ms, 802.4 ± 42.5 ms, and 61.5 ± 3.69 ms, respectively. Figure 3 shows the PD, T1, and T2 values of the SNpc template. The PD was 0.72 ± 0.023 ms, 0.76 ± 0.016 ms, and 0.73 ± 0.023 ms for the MG, VG, and DG, respectively. The T1 value was 771.8 ± 51.9 ms, 849.3 ± 38.3 ms, 828.1 ± 46.1 ms for the MG, VG, and DG, respectively. The T2 value was 60.2 ± 3.61 ms, 62.6 ± 3.83 ms, 63.4 ± 4.91 ms for the MG, VG, and DG, respectively. Figure 4 shows the relationships between age and PD, T1, and T2 values in each segment of the SNpc. There was a significant negative correlation between age and the PD of the MG (r = -0.6521, p = 0.0002). There was a significant negative correlation between age and the T1 value of the MG (r = -0.5954, p = 0.0011).DISCUSSION
The T1 value in the VG was significantly higher than the MG and DG. Because the NM concentration in the SNpc is higher in the DG, PN, MG, and VG in that order, the prolongation of the T1 value in the VG may be associated with the fact that it has the lowest NM concentration. PD and T1 values of the MG showed a significantly negative correlation with age, which suggests that the changes in the PD in the MG may be related to the decrease in the water content with age.CONCLUSION
The T1 value of the VG was higher than the other SNpc regions, which may be correlated with the NM concentration. The measured relaxation times can be used as baseline values for the SNpc. In the future, it is expected that these values may be used to evaluate SNpc degeneration in Parkinson’s disease.Acknowledgements
No acknowledgement found.References
- Gibb WR, Lees AJ. Anatomy, pigmentation, ventral and dorsal subpopulations of the substantia nigra, and differential cell death in Parkinson’s disease. J Neurology Neurosurg Psychiatry 1991;54:388–96.2.
- Wakabayashi K, Mori F, Takahashi H. Progression patterns of neuronal loss and Lewy body pathology in the substantia nigra in Parkinson’s disease. Parkinsonism Relat D 2006;12:S92–8.3.
- Warntjes JBM, Leinhard OD, West J, Lundberg P. Rapid magnetic resonance quantification on the brain: Optimization for clinical usage. Magnet Reson Med 2008;60:320–9.
Figures
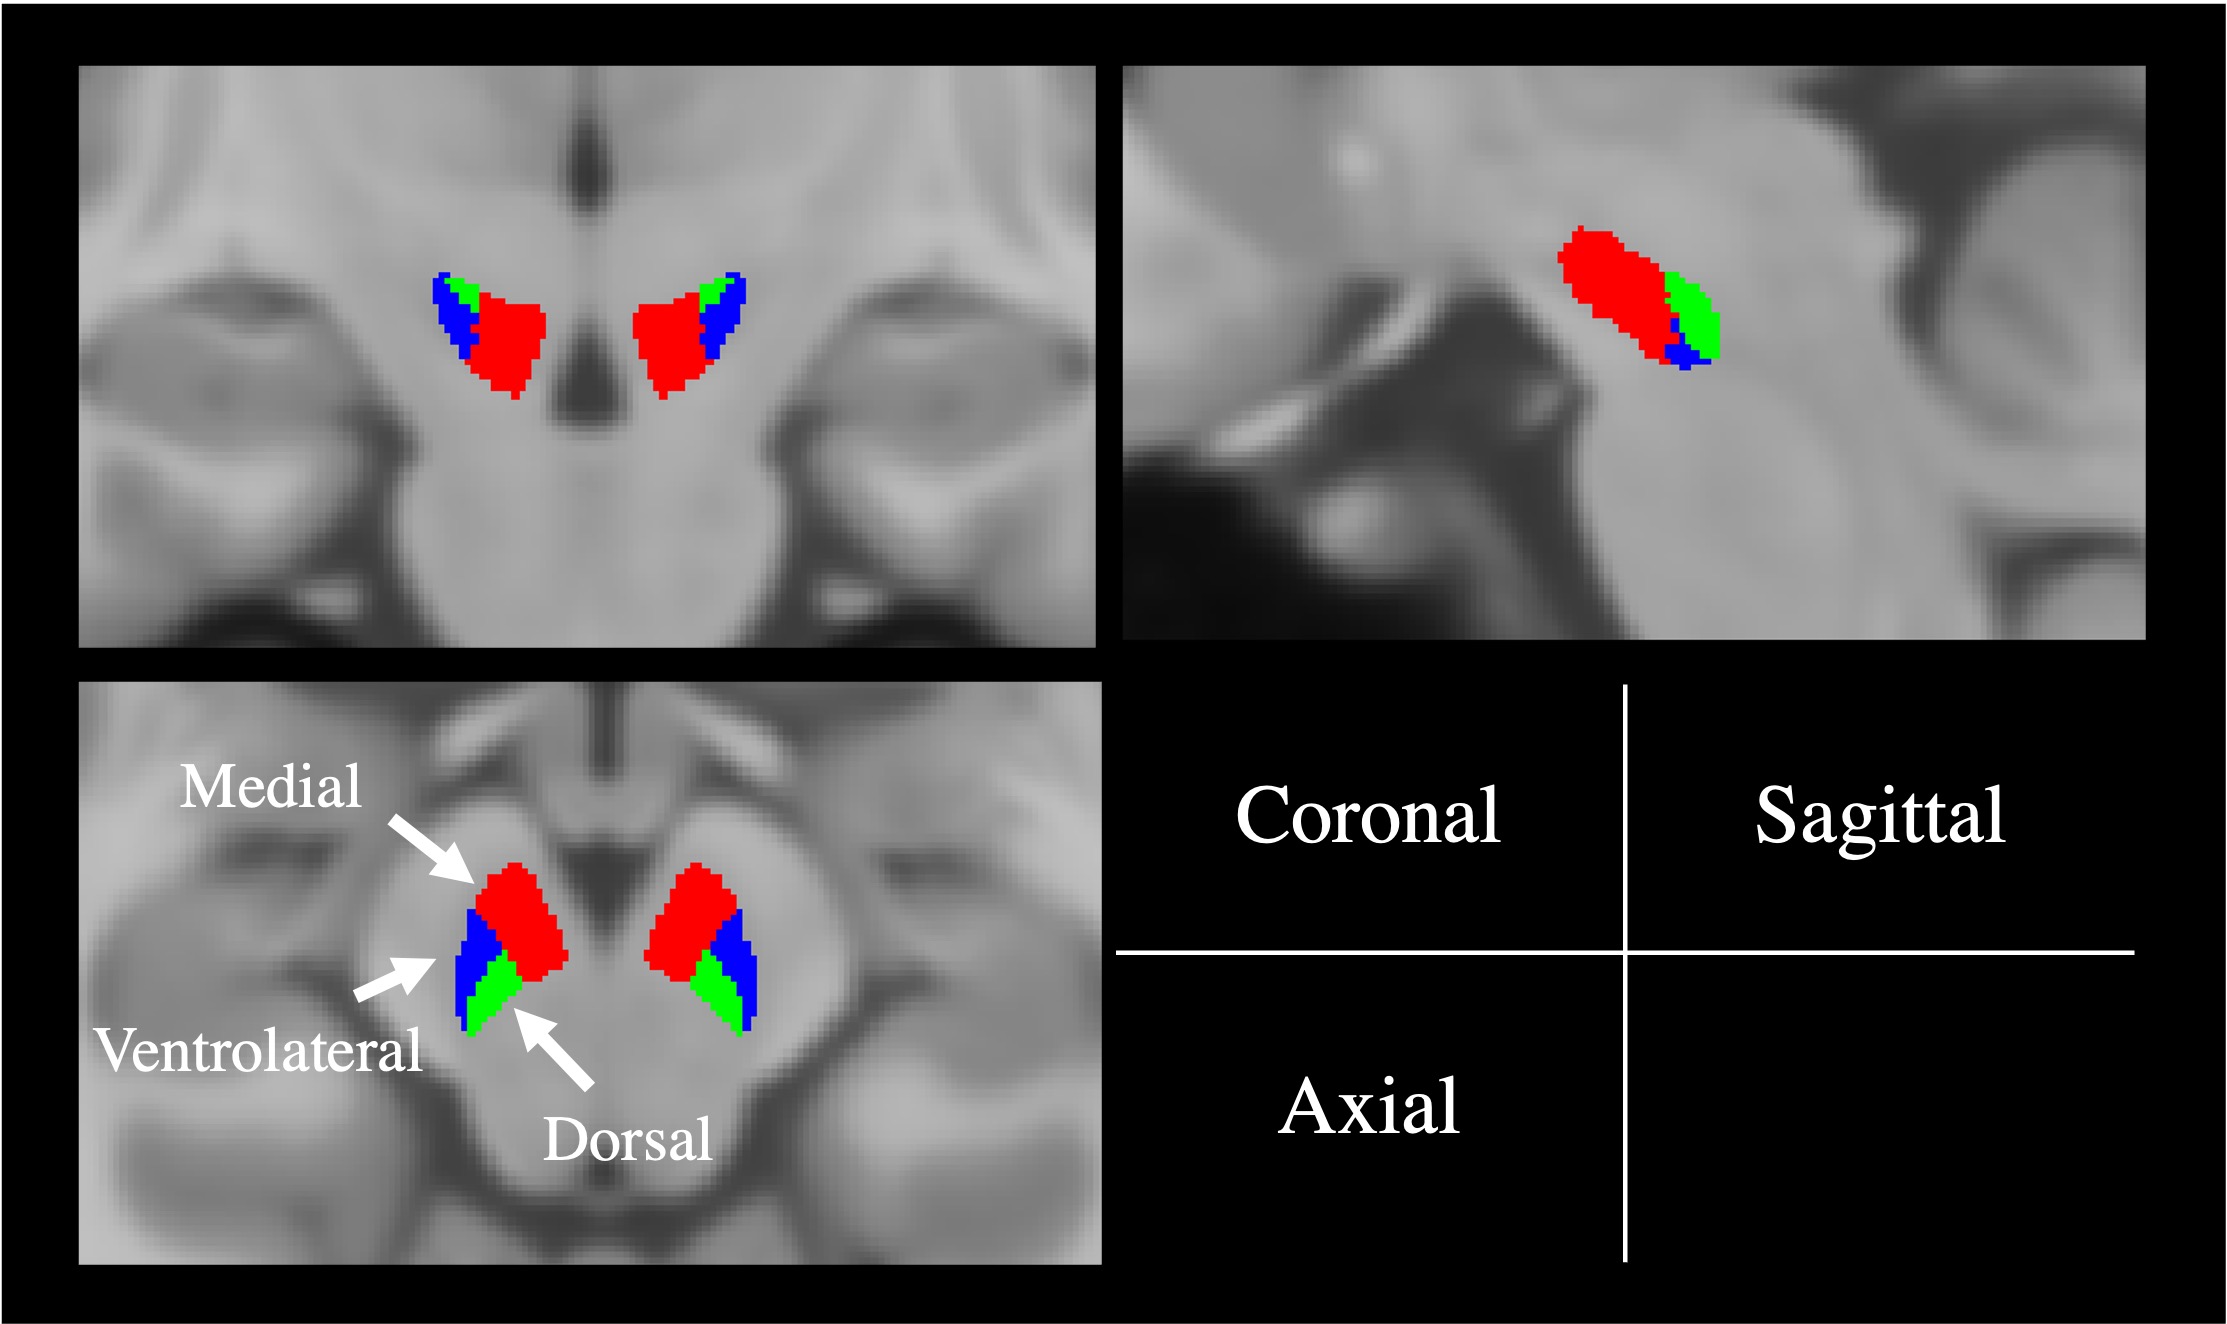
Figure 1. Anatomical atlas of the substantia nigra pars compacta. Coronal, sagittal, and axial planes are shown. Red, blue, and green indicate the medial, ventrolateral, and dorsal regions, respectively.
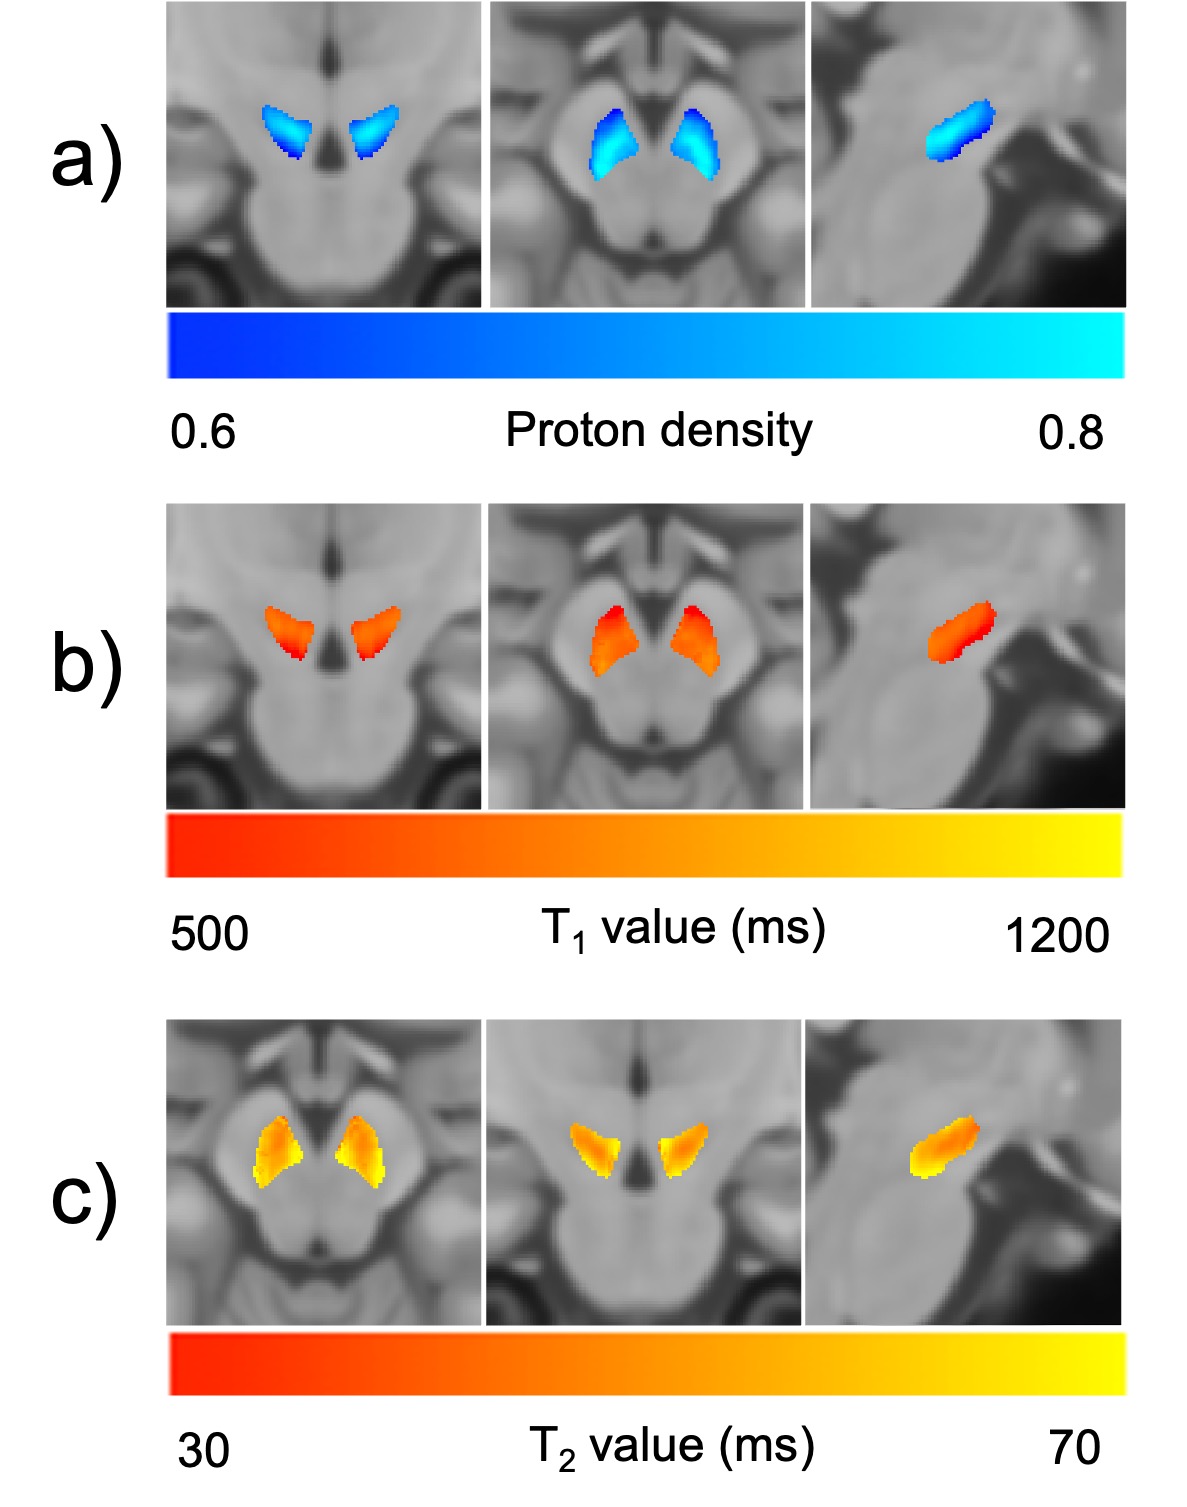
Figure 2. Average proton density (a), T1 (b), T2 (c) maps of the substantia nigra pars compacta.
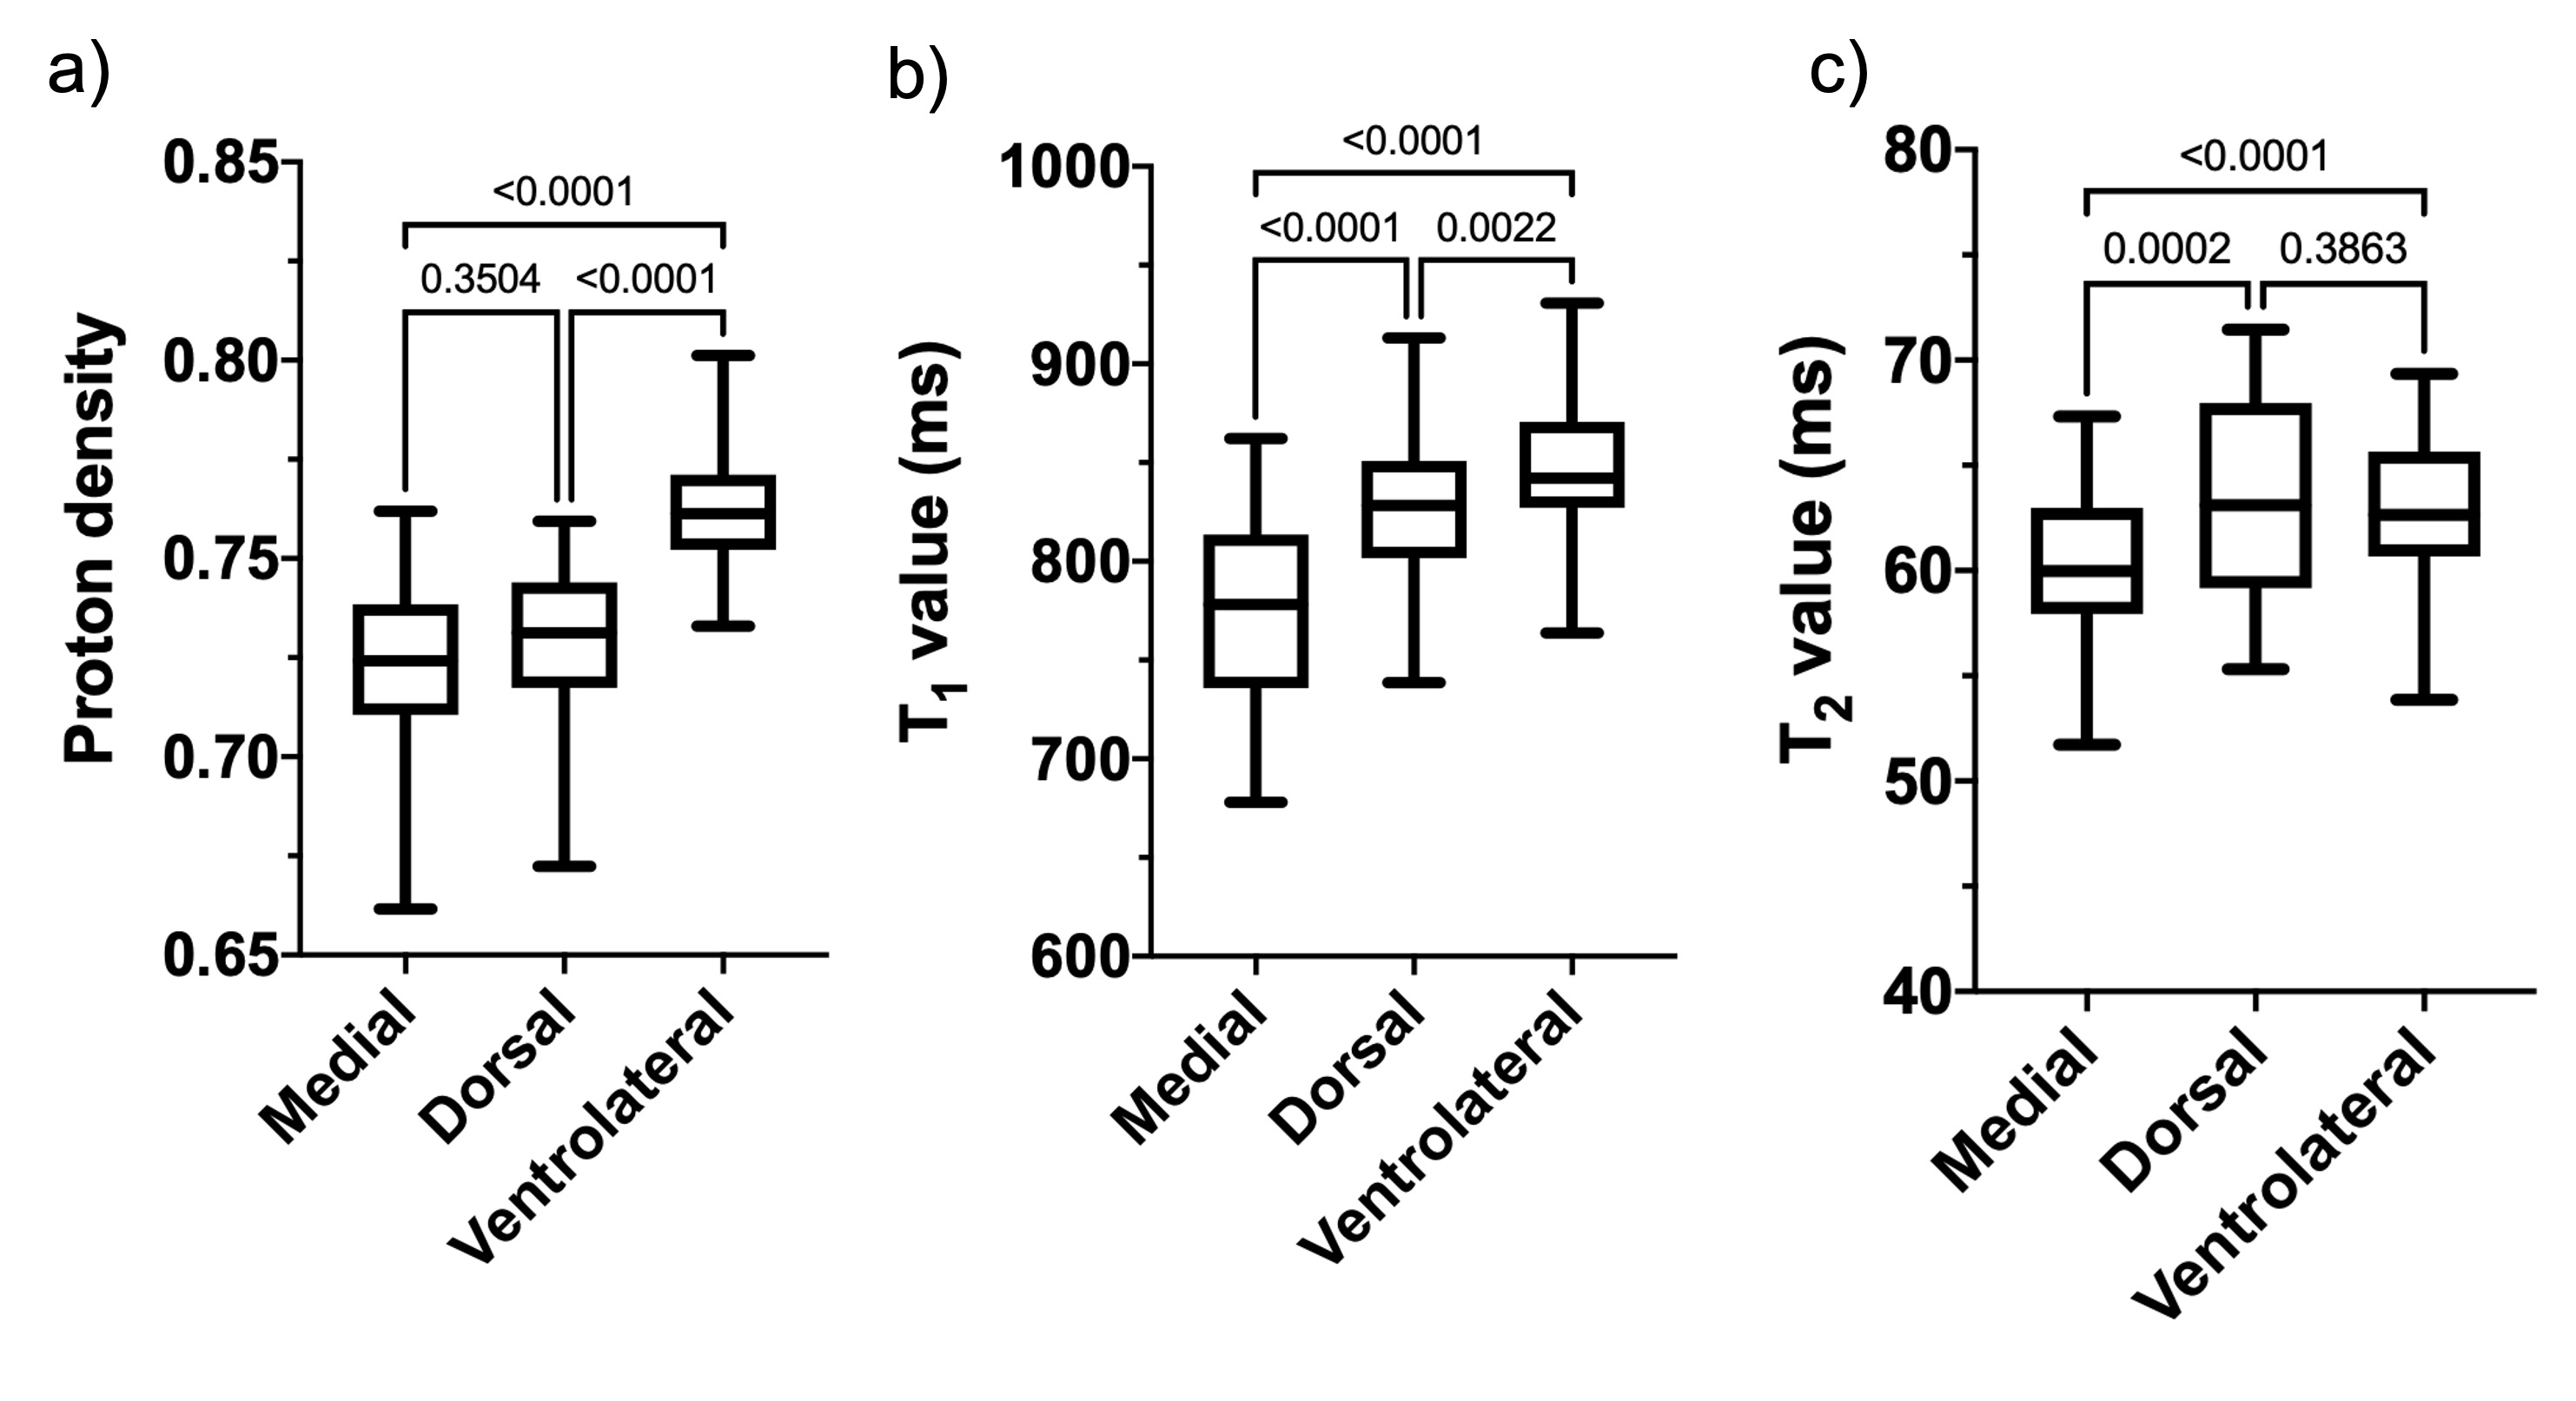
Figure 3. Proton density (a), T1 value (b), and T2 value (c) in each segment of the substantia nigra pars compacta.
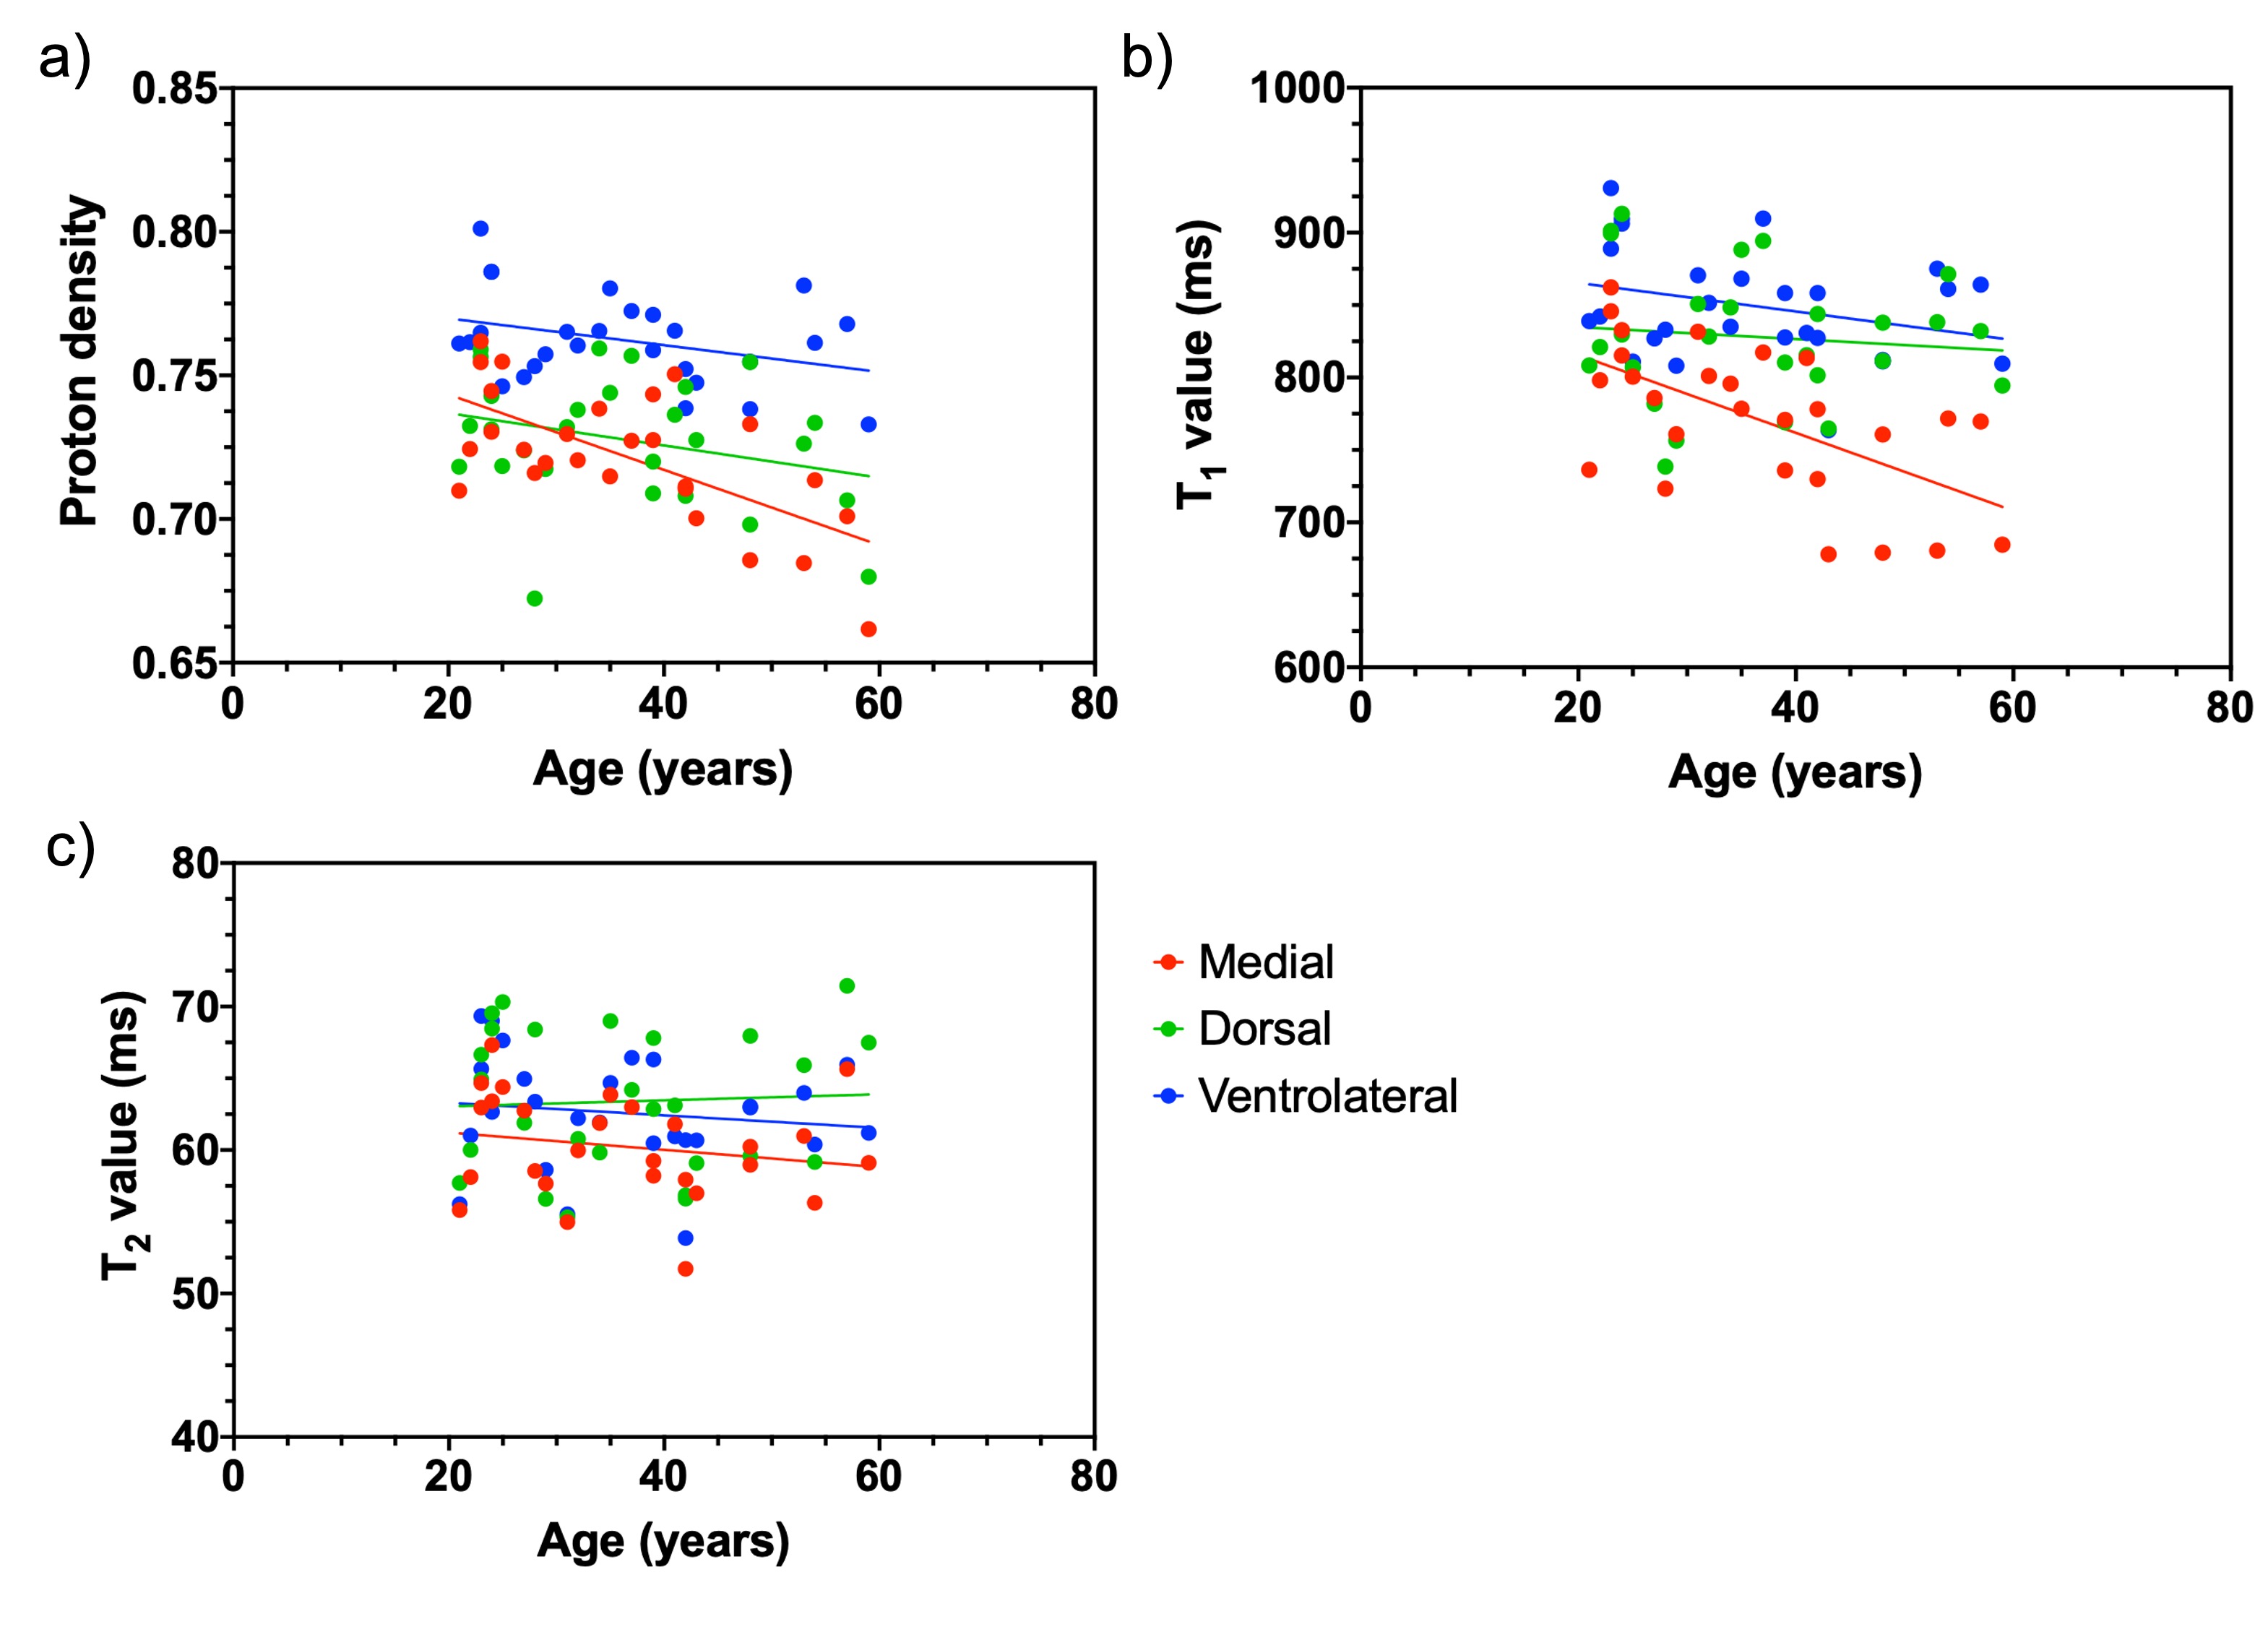
Figure 4. Relationship between age and proton density (a), T1 value (b), and T2 value (c) in each region of the substantia nigra pars compacta.
DOI: https://doi.org/10.58530/2022/3067