3065
Microstructural Deviation in Parkinson’s Disease and Multiple System Atrophy Detected by Spatial Normative Models1Institute of Medical Device and Imaging, National Taiwan University College of Medicine, Taipei, Taiwan, 2Department of Bioengineering, University of Pittsburgh, Pittsburgh, PA, United States, 3Department of Neurology, National Taiwan University Hospital, Taipei, Taiwan, 4AcroViz Technology Inc., Taipei, Taiwan, 5Molecular Imaging Center, National Taiwan University, Taipei, Taiwan
Synopsis
By applying spatial normative models based on a population-based cohort, we can quantify the microstructural deviation of white matter in patients with Parkinson’s disease (PD) and multiple system atrophy (MSA). We found that microstructural deviation of the frontal aslant tracts, cerebrospinal tracts, and parts of corpus callosum was more profound in MSA compared to that in PD. Also, the uncinate fasciculi were the common degenerative marker in these two diseases. Moreover, the microstructural deviation of WM tracts may reflect the association with the disease-related daily functional deficit in MSA and the timing of disease onset in PD.
Introduction
With the growth of large-scale biomedical databases, normative modeling in neuroimaging data is an emerging method to quantify neurobiological idiosyncrasy at an individual level with respect to a reference norm [1]. By using spatial normative modeling that specifically employs neuroimaging measures to estimate central tendency and variation of a given brain region with certain demographic factors such as age and sex, the extent to which an individual deviates from the population-based norm can be spatially quantified into “z-scores” [2]. In this study, we aimed to investigate the microstructural deviation in Parkinson’s disease (PD) and multiple system atrophy (MSA) by establishing spatial normative models based on the features derived from diffusion spectrum imaging (DSI) datasets. MSA is characterized by parkinsonism, cerebellar ataxia, and autonomic failure with neuropathological hallmarks different from PD. We hypothesized that the z-score profiles derived from normative models can differentiate abnormality of white matter (WM) between PD and MSA.Methods
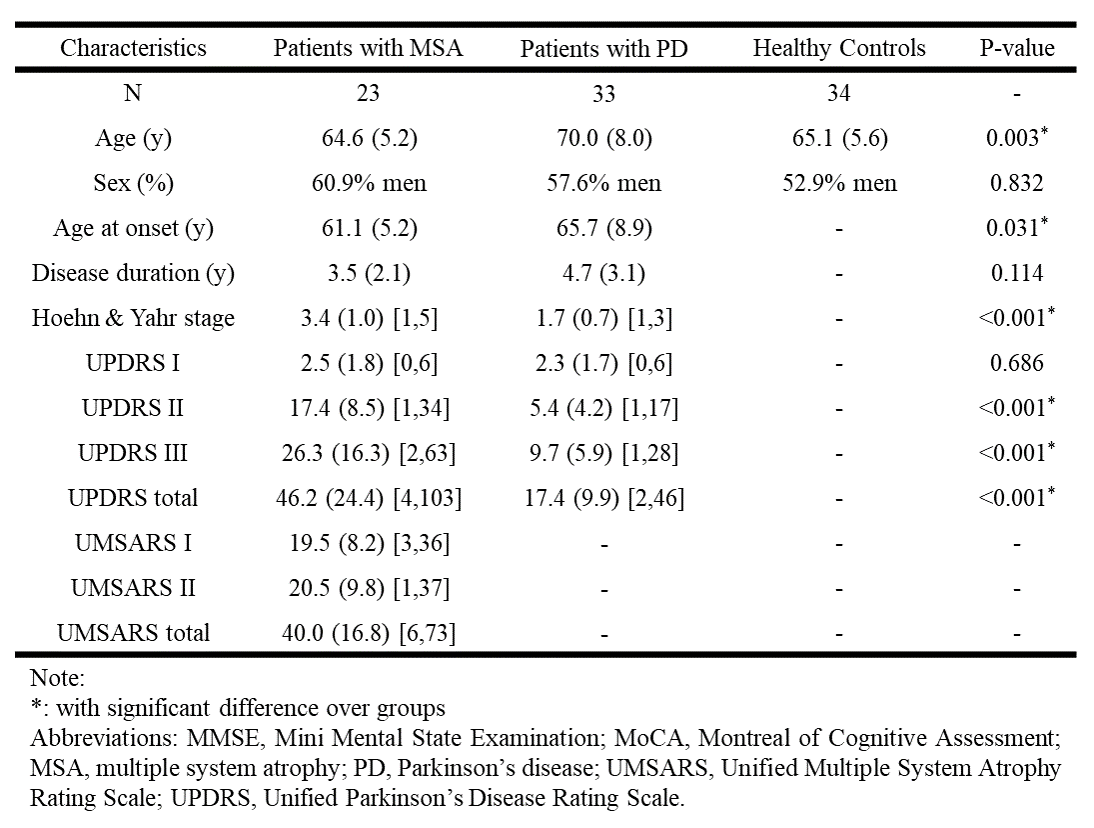
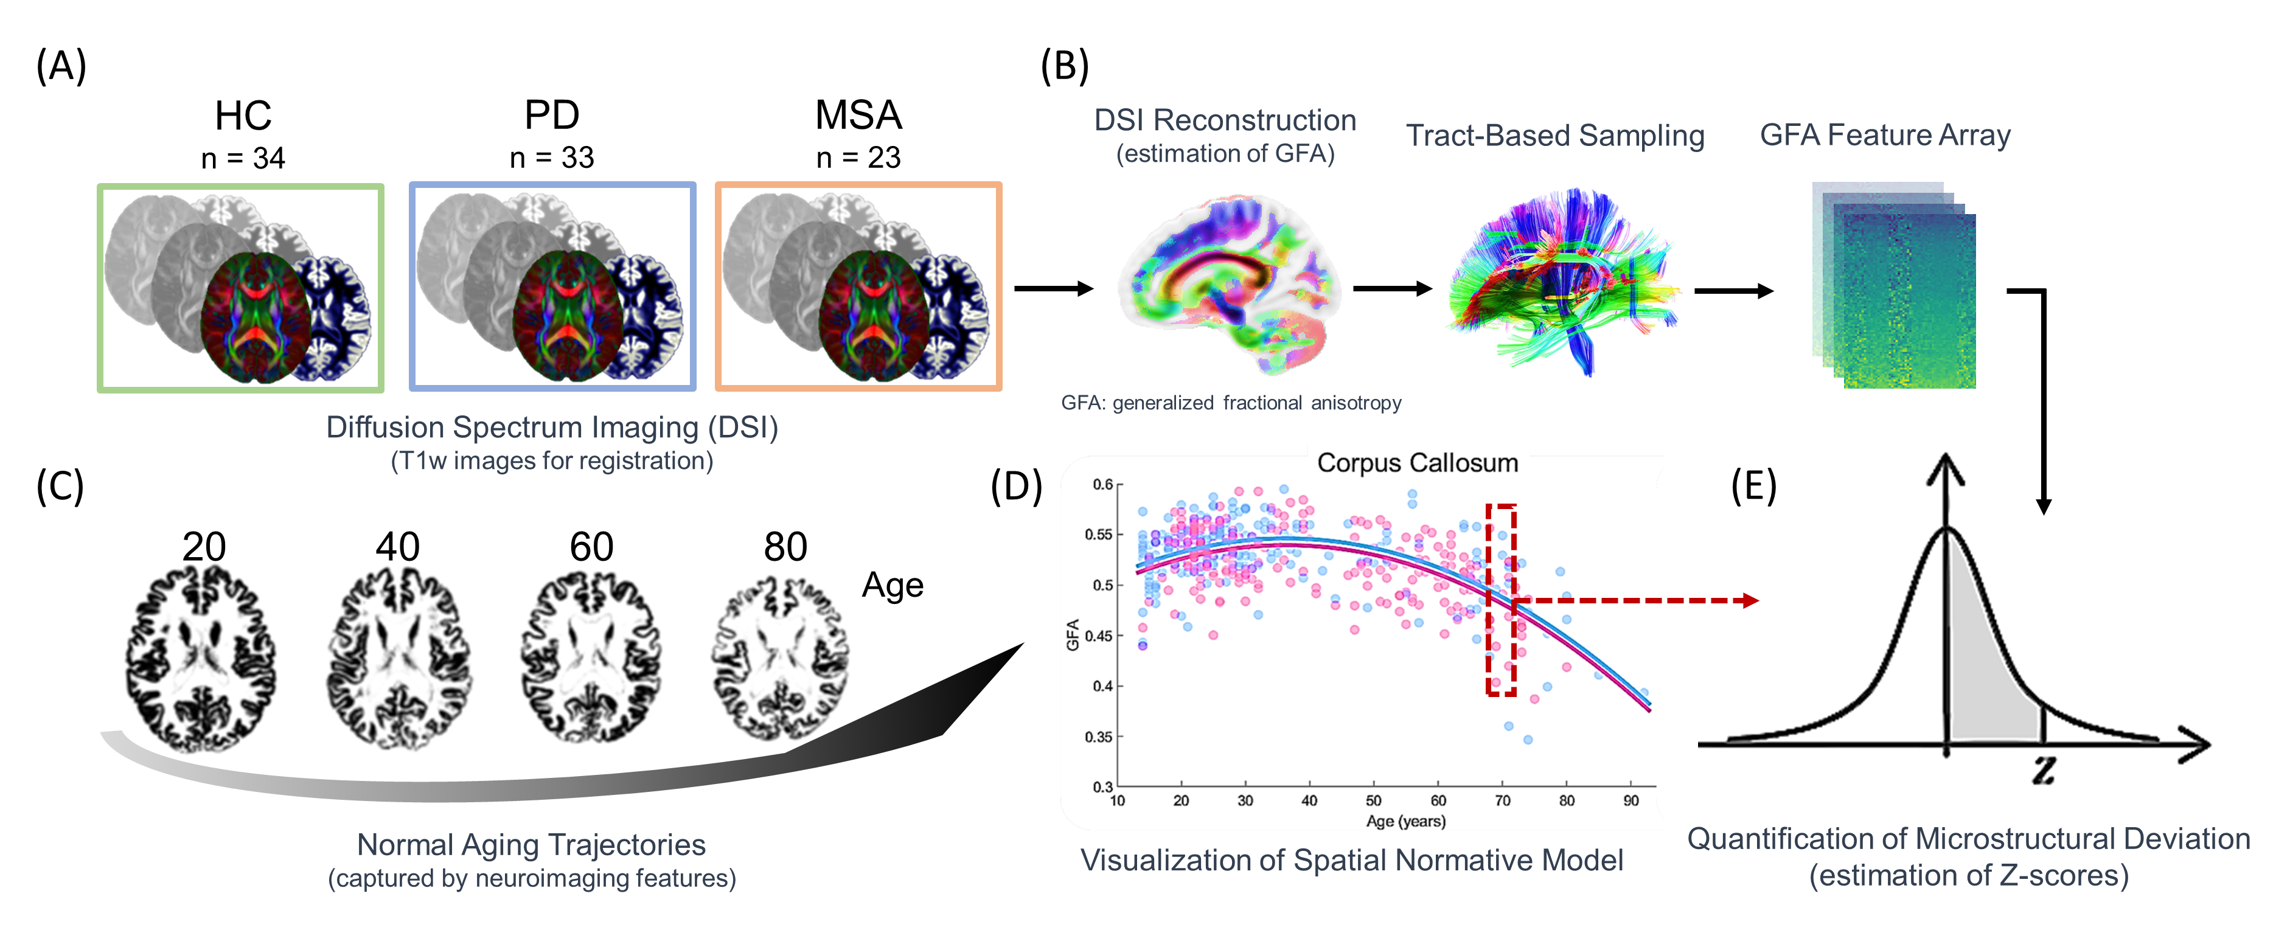
Patients with PD (N = 33) and MSA (N = 23) were recruited in this study (Figure 1). The symptoms were assessed using the Unified Parkinson’s Disease Rating Scale (UPDRS) and Hoehn and Yahr Scale for both diseases, and Unified Multiple System Atrophy Rating Scale (UMSARS) for patients of MSA. We also enrolled 34 healthy controls (HCs; Figure 2A) as a baseline. For spatial normative modeling of the cerebral WM, neuroimaging datasets of 482 cognitively normal participants (mean age = 36.9, SD = 19.1, range = 14–92; sex: 53.1% women) were obtained from the image database used in our previous studies [3], including T1-weighted imaging and DSI datasets. All brain images used in this study were acquired using the same 3-Tesla MRI scanner (Tim Trio; Siemens, Erlangen, Germany) with a 32-channel phased-array head coil. DSI was performed by using bmax = 4000 s/mm^2 and 102 diffusion-encoding gradient directions in the half-sphere of the 3D q-space. To quantify microstructural features of WM, DSI datasets were reconstructed by the regularized version of diffusion MAP-MRI framework into generalized fractional anisotropy (GFA) maps [4]. A following tract-specific analysis was conducted to sample the GFA maps and transformed them into feature arrays according to the predefined 45 WM tracts (Figure 2B) [5]. We further employed the Gaussian process regression approach to establish spatial normative models for each tract feature based on GFA feature arrays (Figure 2C & D). After that, the normative models were applied to patients with PD and MSA and the HCs to calculate the z-score profile for each brain region (Figure 2E). The z-score profiles between PD and MSA were compared using mass two-sample t-tests corrected by the Benjamini-Hochberg method. Also, the association of z-score profiles with clinical factors such as the age of onset, duration of illness, and symptom severity in different dimensions was tested.Results
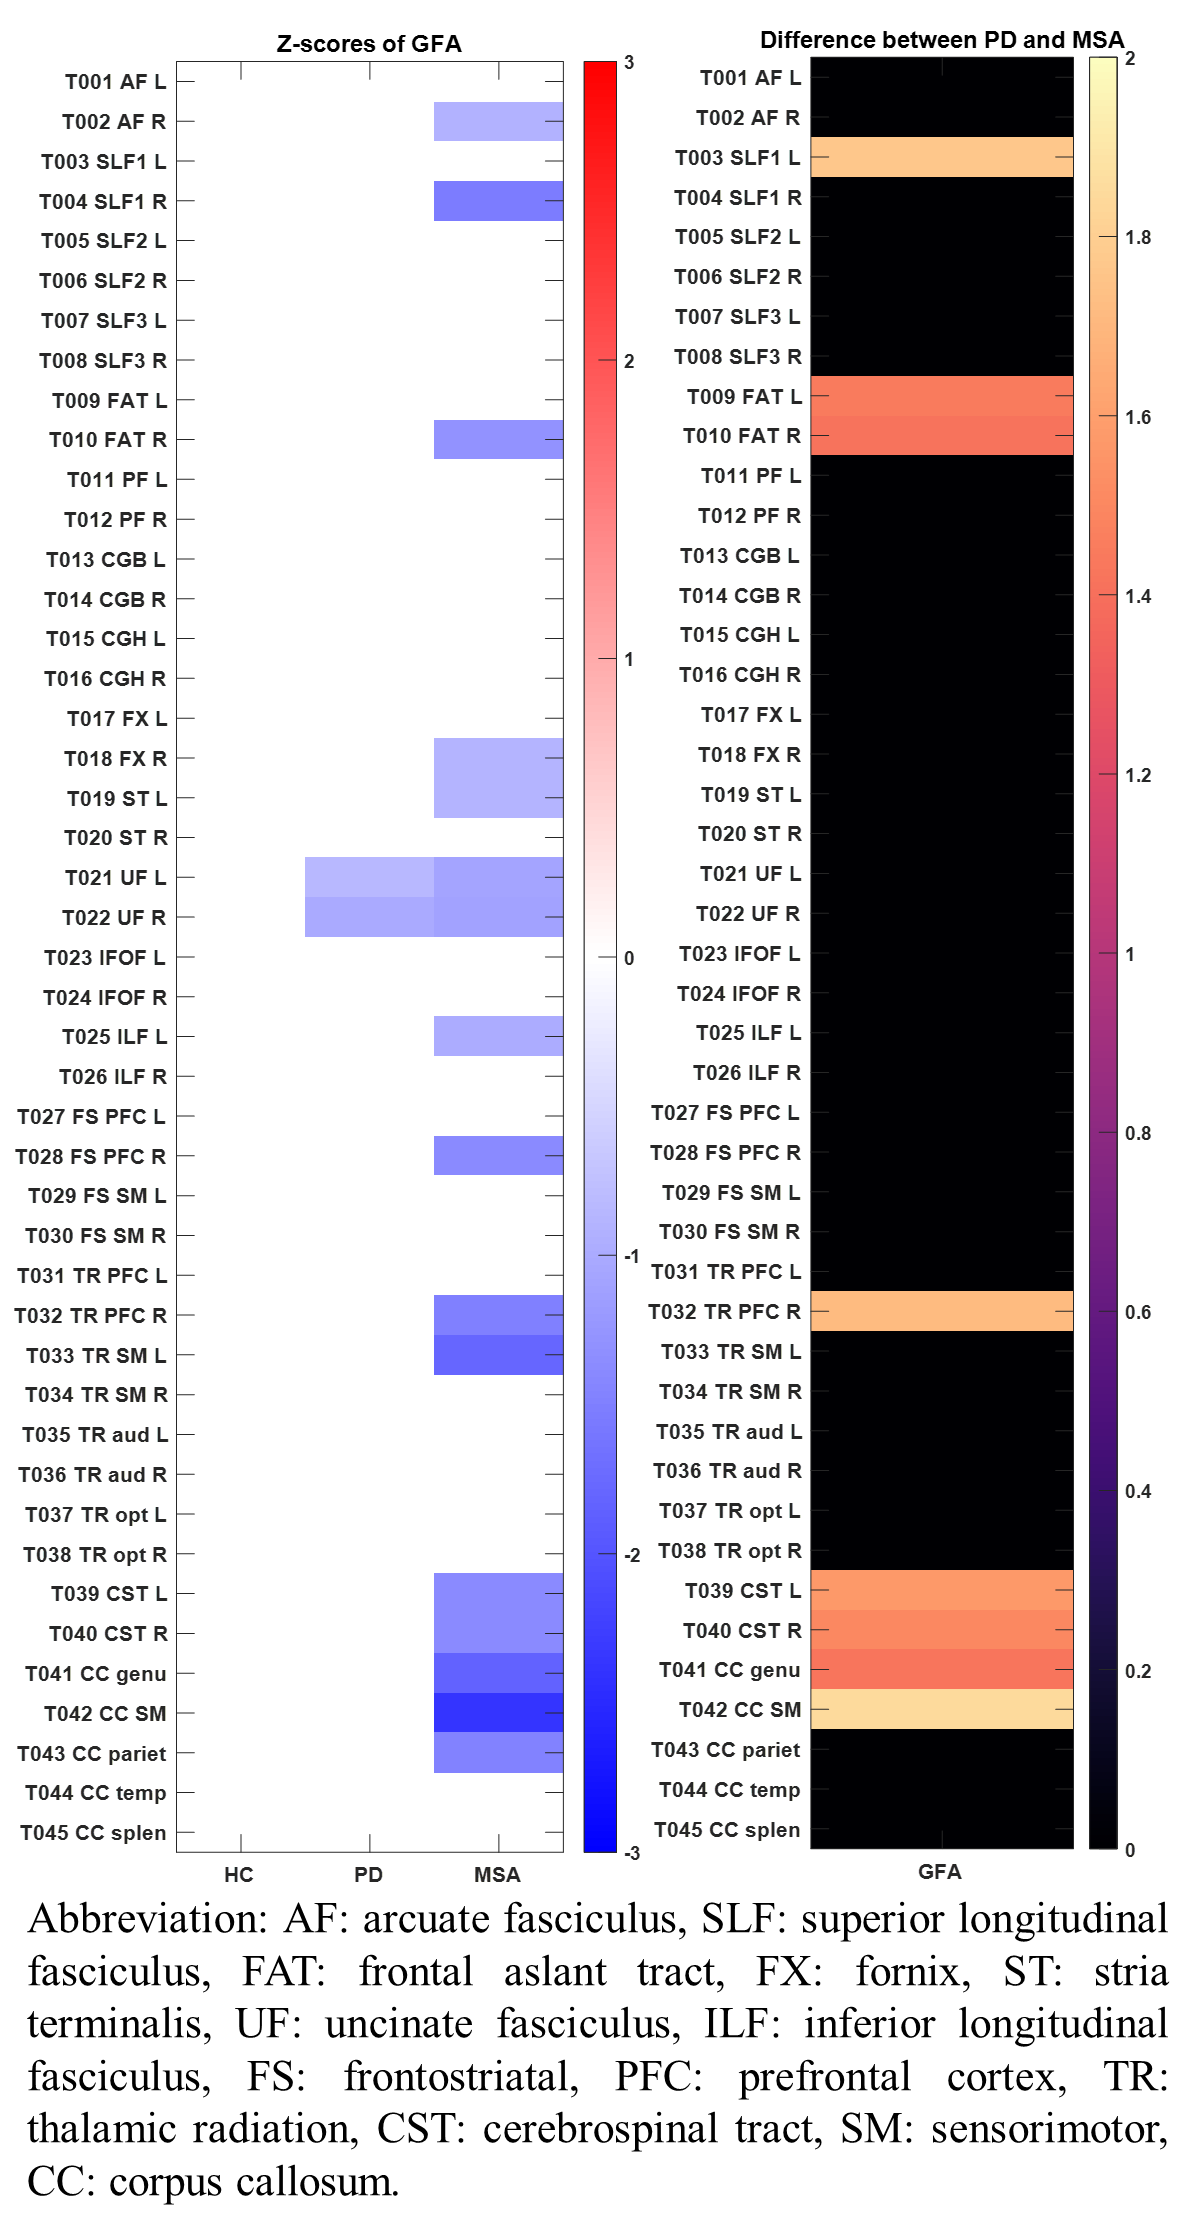
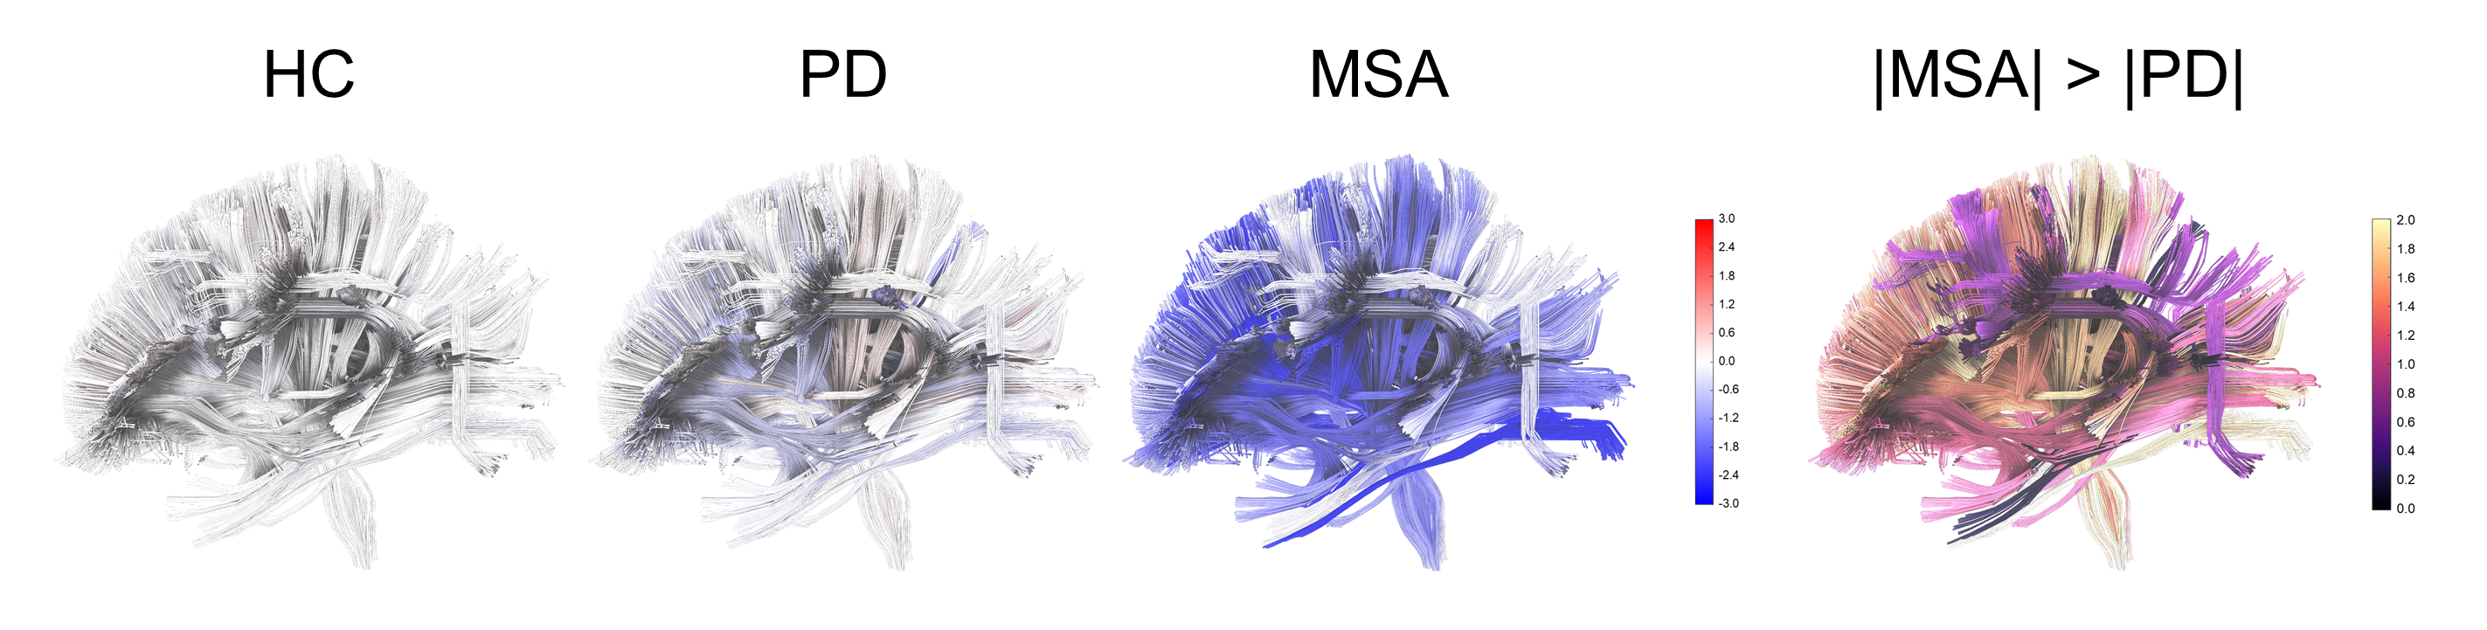
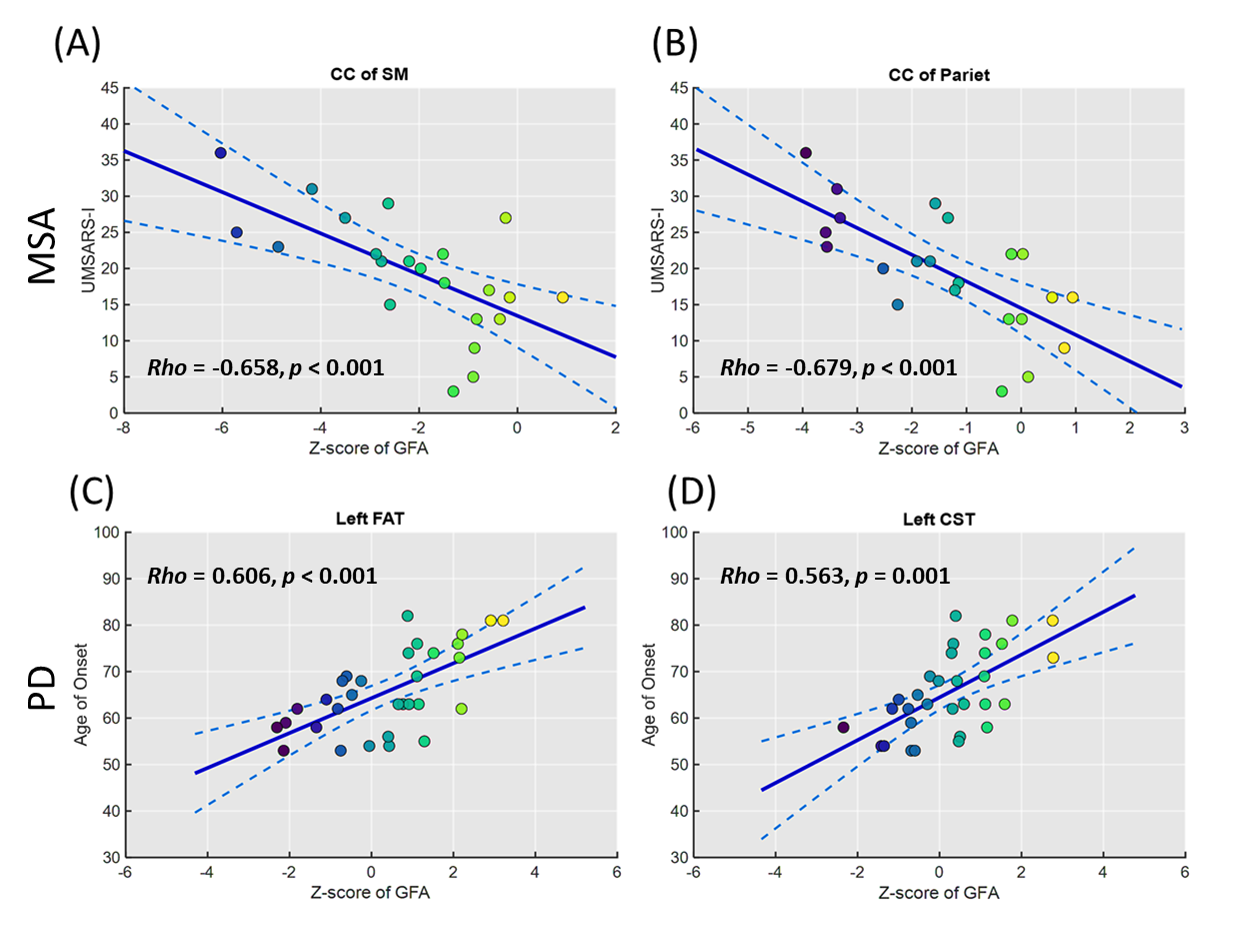
In the results of z-score profiles, 16 tract bundles were significantly impaired (all p < 0.001) in MSA compared to the norm including parts of the thalamic radiation and corpus callosum, uncinate fasciculi, and cerebrospinal tracts, while only 2 tract bundles (bilateral uncinate fasciculi) in PD significantly deviated (both p < 0.001) from the standard (Figure 3 & 4). Besides, the z-score profiles of GFA in the frontal aslant tracts, cerebrospinal tracts, and parts of the corpus callosum were significantly lower in MSA compared to those in PD, indicating more severe impairment of WM microstructural integrity in MSA. Moreover, in the MSA group, we identified significantly negative correlations of the scores of UMSARS subitem 1 with the z-scores of the corpus callous connecting to sensorimotor regions (rho: -0.658, p < 0.001) and parietal lobes (rho: -0.679, p < 0.001), respectively (Figure 5). No measures of symptom severity were significantly correlated with z-scores in PD; however, the age of onset was significantly correlated with the z-scores of the left frontal aslant tract (rho: 0.606, p < 0.001) and the left cerebrospinal tract (rho: 0.563, p = 0.001), respectively (Figure 5).Discussion and Conclusion
By using spatial normative modeling with DSI datasets, we identified several differential and common impaired tract bundles between PD and MSA. The microstructural deviation of WM was more apparent in MSA compared to that in PD, especially in the frontal aslant tracts, cerebrospinal tracts, and parts of the corpus callosum. On the other hand, the uncinate fasciculi might be the common degenerative marker in these two diseases. Also, the microstructural deviation of WM tracts may reflect the association with the disease-related daily functional deficit in MSA and the timing of disease onset in PD.Acknowledgements
This research was supported and approved by the National Taiwan University and National Taiwan University Hospital (Taiwan) under grant numbers: UN109-064. We are also grateful for the support in part from the grant awarded by the Ministry of Science and Technology of Taiwan (grant number: 106-2314-B-002-074-MY3 and 109-2314-B-002-120-MY3). The authors are grateful to the participants for their participation, the research assistants for assistance with subject recruitment and administration, and the technologists for performing MRI scanning.References
[1] Marquand, A.F., Rezek, I., Buitelaar, J., Beckmann, C.F., 2016. Understanding Heterogeneity in Clinical Cohorts Using Normative Models: Beyond Case-Control Studies. Biol Psychiatry 80, 552-561.
[2] Verdi, S., Marquand, A.F., Schott, J.M., & Cole, J.H., 2021. Beyond the average patient: how neuroimaging models can address heterogeneity in dementia. Brain awab165.
[3] Chen, C.L., Hsu, Y.C., Yang, L.Y., Tung, Y.H., Luo, W.B., Liu, C.M., ... & Tseng, W.Y.I. 2020. Generalization of diffusion magnetic resonance imaging-based brain age prediction model through transfer learning. Neuroimage, 217, 116831.
[4] Hsu, Y.C., Tseng, W.Y. (2018) An efficient regularization method for diffusion MAP-MRI estimation. 2018 ISMRM-ESMRMB Joint Annual Meeting.
[5] Chen, Y.J., Lo, Y.C., Hsu, Y.C., Fan, C.C., Hwang, T.J., Liu, C.M., Chien, Y.L., Hsieh, M.H., Liu, C.C., Hwu, H.G., Tseng, W.Y. (2015) Automatic whole brain tract-based analysis using predefined tracts in a diffusion spectrum imaging template and an accurate registration strategy. Hum Brain Mapp, 36:3441-58.
Figures