3061
The ratio of T1-Weighted to T2-Weighted Signal Intensity and IDH mutation in glioma1Neurosurgery, Asahikawa Medical University, Asahikawa, Japan, 2Neurosurgery, Japanese Red Cross Kitami Hospital, Asahikawa, Japan, 3Diagnostic and Interventional Radiology, Osaka International Cancer Institute, Osaka, Japan, 4Neurosurgery, Moriyama Hospital, Asahikawa, Japan, 5Biomedical Research and Innovation, National Hospital Organization Osaka National Hospital, Osaka, Japan, 6Neurosurgery, Osaka University Graduate School of Medicine, Suita, Japan
Synopsis
The authors investigated the correlation of the ratio of T1WI to T2WI signal intensity (rT1/T2) and IDH mutation status in lower-grade gliomas (LrGG). An exploratory study was conducted to determine an ideal cut-off of rT1/T2 for predicting IDH-mutation, followed by a validation study using two different cohorts. Mean rT1/T of IDH-wild type LrGG was higher than IDH-mutant and significantly predicted IDH mutation in the exploratory cohort. The domestic cohort validated this result, but the accuracy in the TCIA / TCGA cohort declined. The cause of this decline should be further investigated.
INTRODUCTION
Genetic characterization of WHO grade 2 and grade 3 gliomas, namely lower-grade gliomas (LrGG), is a crucial diagnostic workup to predict patient prognosis and determine the most appropriate pre-surgical treatment strategy. More specifically, the presence of IDH mutation in LrGG is known to be a favorable prognostic indicator. Therefore, the prediction of IDH mutation status for LrGG is clinically significant for LrGG patient care. Our previous study revealed that IDH-wildtype LrGG presented noticeably shorter T1- and T2-relaxation times than IDH-mutant LrGG1. However, there has been no clinically practical procedure to predict T1- and T2 relaxation times for LrGG. The ratio of T1WI to T2WI signal intensity (rT1/T2) on MR imaging was proposed as a quantitative imaging surrogate developed for myelin integrity of the brain2, 3. The purpose of this study is to test the hypothesis that the rT1/T2 serves as a quantitative MRI valuable biomarker for predicting the IDH mutation status in LrGG.METHODS
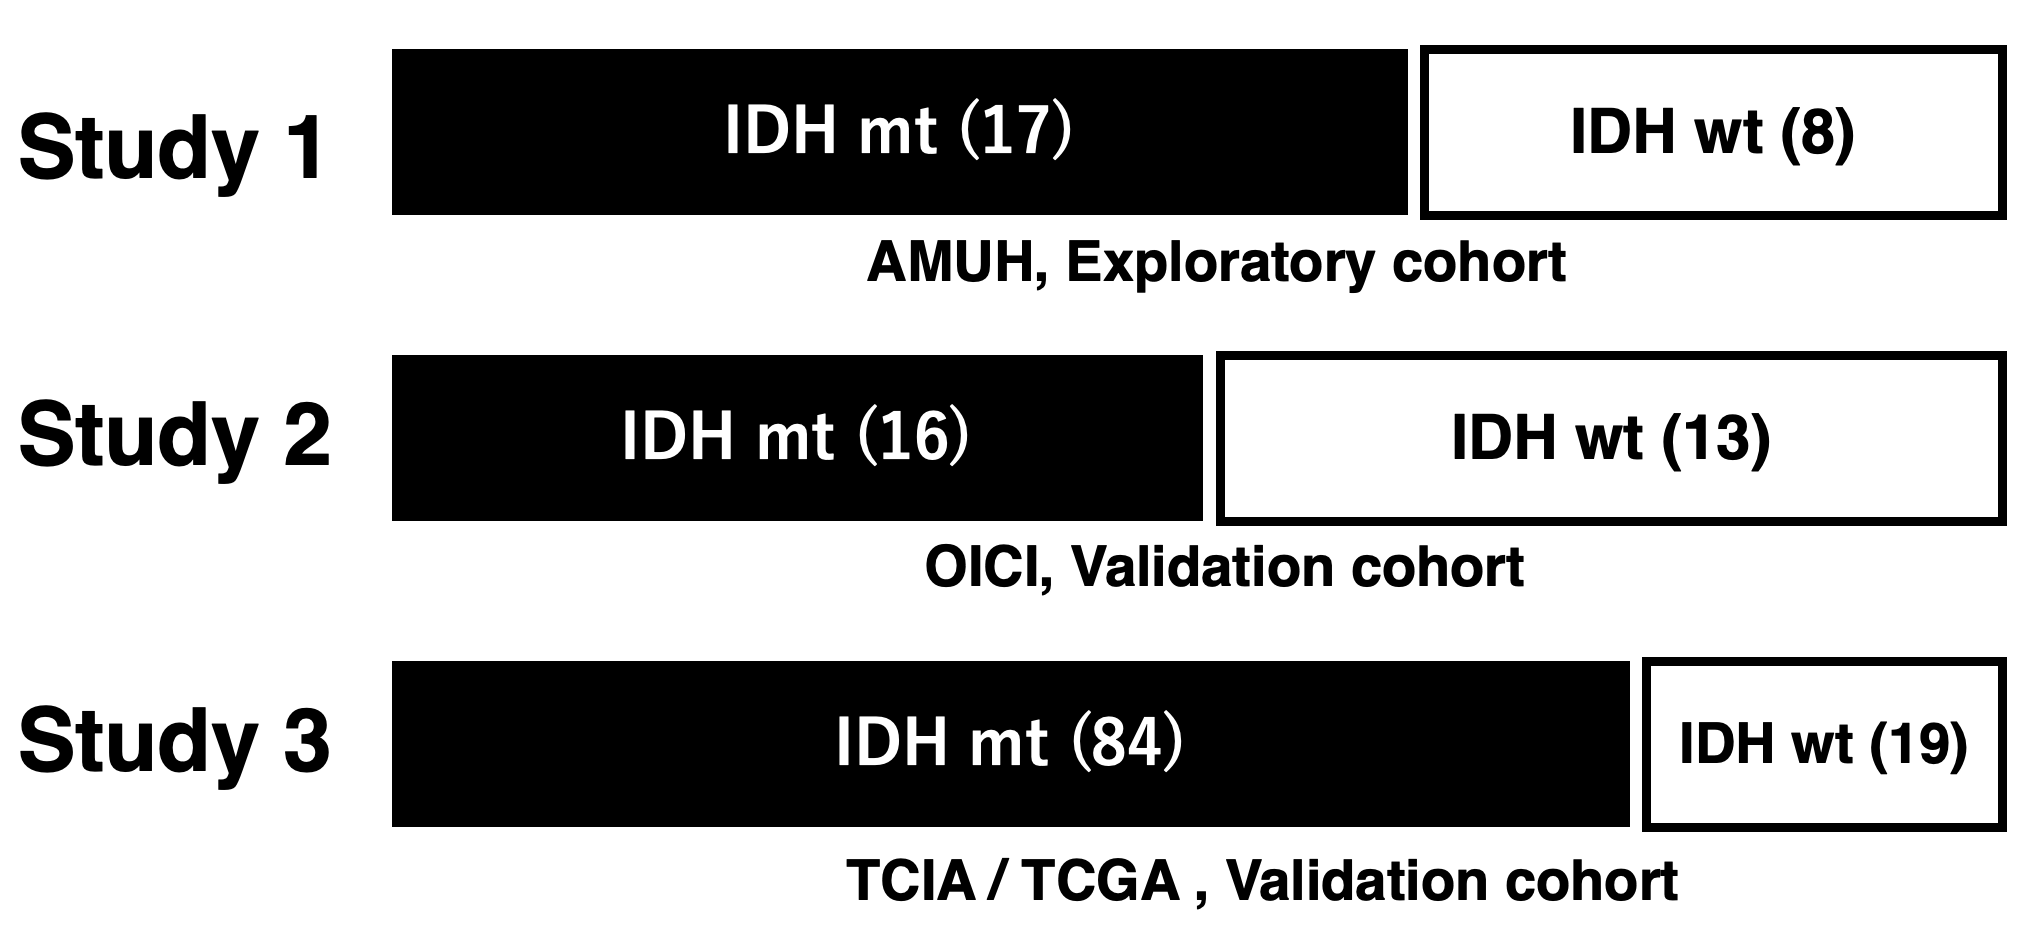
The study was conducted in two stages. The first step of the study consisted of an exploratory study to determine the ideal cut-off of rT1/T2 for detecting IDH-mutant LrGG. The second step was a validation study of the previously determined cut-off using two cohorts (Figure 1, 2).Exploratory cohort (Study 1: AMUH): Twenty-five patients at Asahikawa Medical University Hospital (AMUH) with histologically confirmed LrGG who underwent T1- and T2-weighted image as part of their preoperative workup were used as an exploratory cohort (IDH-wildtype: 8, IDH-mutant: 17). T1-weighted images were co-registered to T2-weighted images using a normalized information algorithm followed by visual confirmation of the registration. rT1/T2 images were calculated from T1- and T2-weighted images using a recommended signal correction. Voxels-of-interests (VOIs) were manually segmented by the first author, and VOIs were defined based on the high-intensity area on T2-weighted images, including pathological lesions. rT1/T2 within the VOI was measured, and mean rT1/T2 (mrT1/T2) was calculated. The relationship between the mrT1/T2 and the IDH mutation status was investigated by the Mann-Whitney U test and ROC curve analysis.
Validation cohort (Study 2: OICI, Study 3: TICA / TCGA): Twenty-nine LrGG patients (IDH-wildtype: 13, IDH-mutant: 16) from Osaka International Cancer Institute (OICI) and 103 patients from the Cancer Imaging Archive (TCIA) / Cancer Genome Atlas (TCGA) dataset (IDH-wildtype: 19, IDH-mutant: 84) were used as validation cohorts using the cut-off of the exploratory cohort.
RESULTS
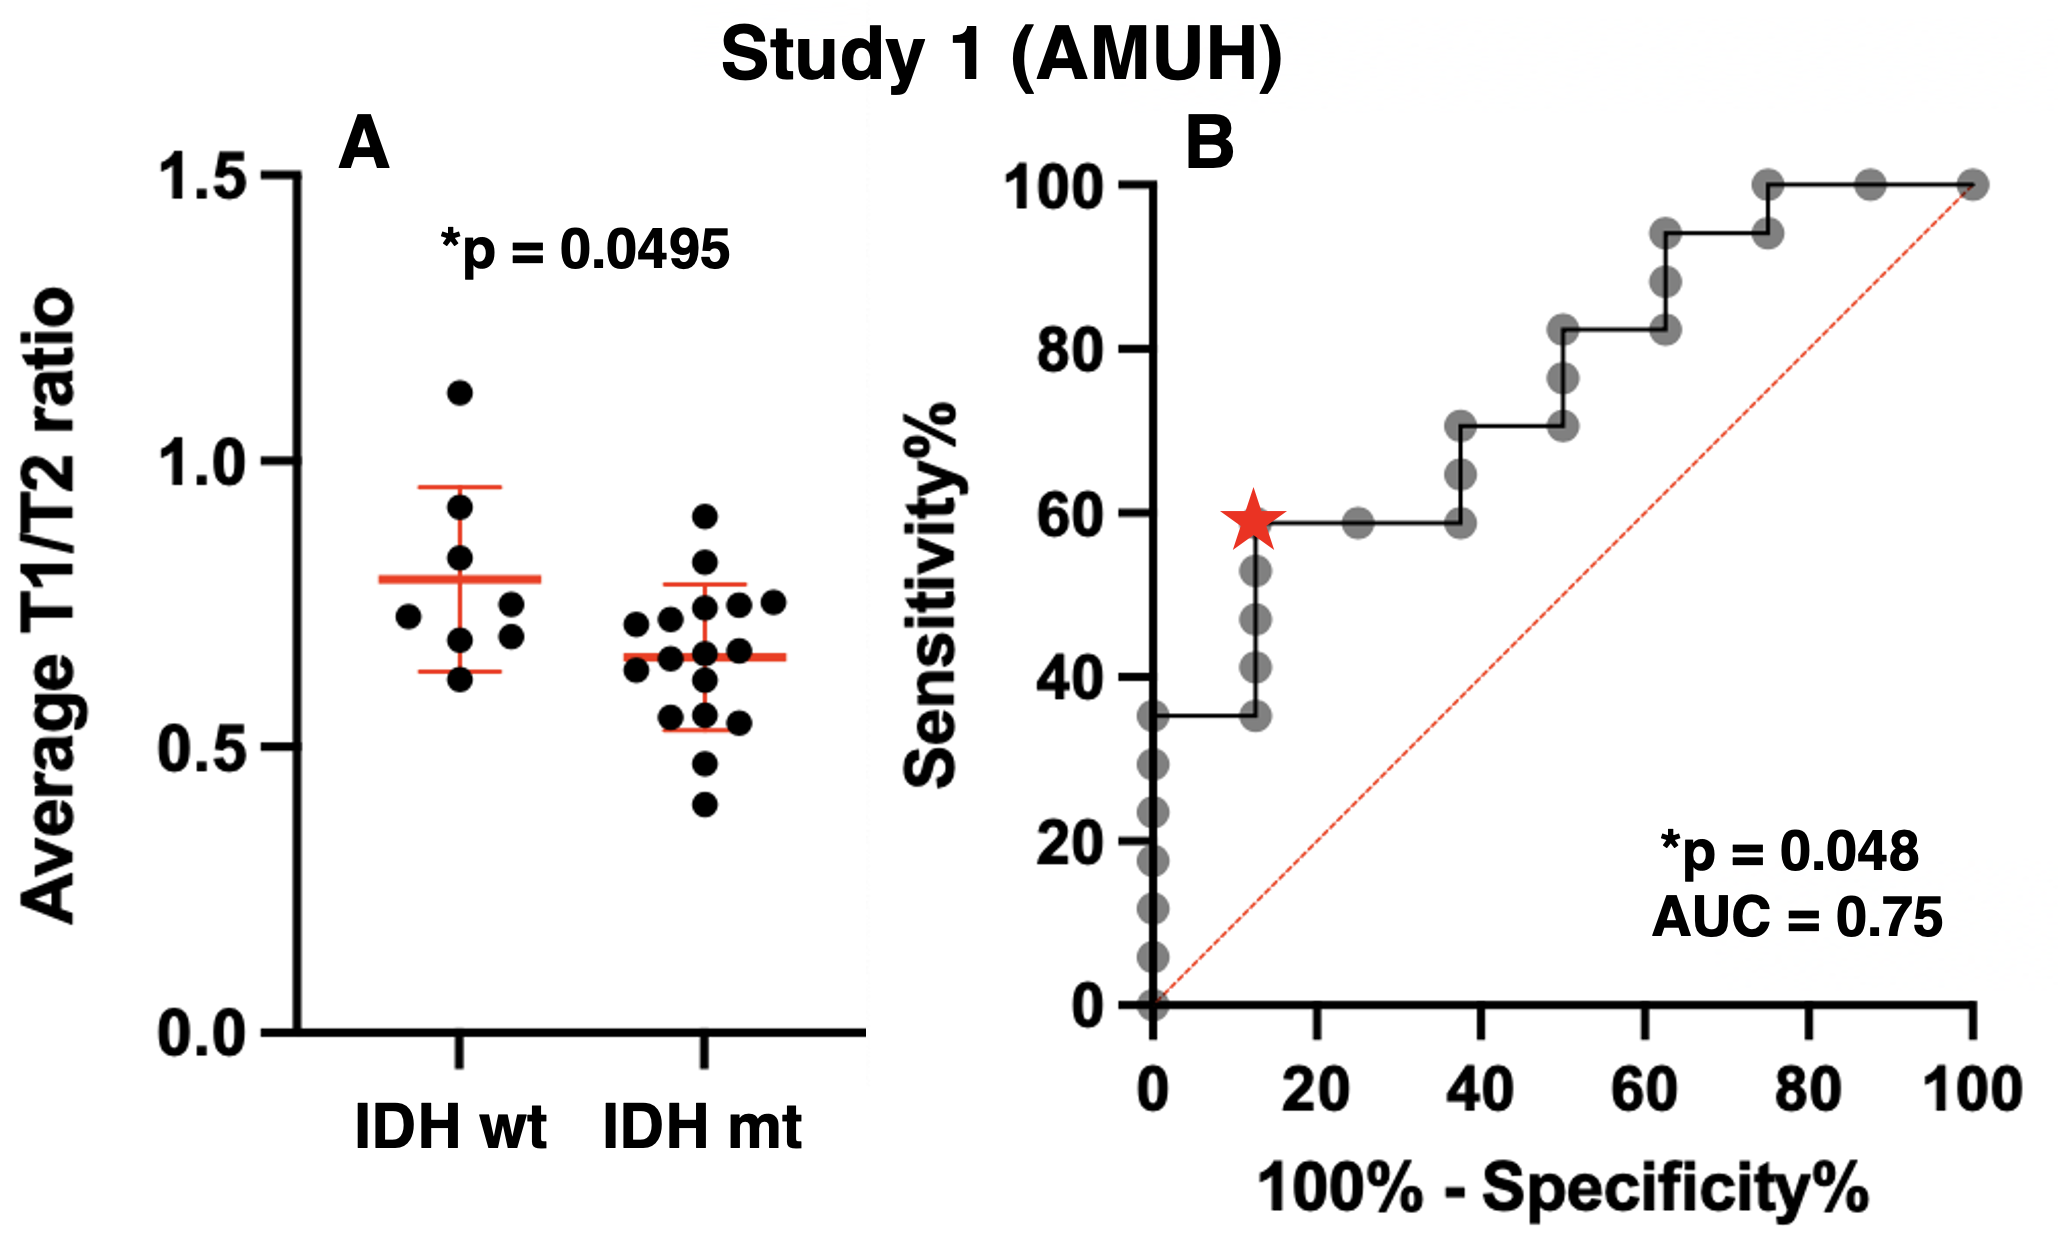
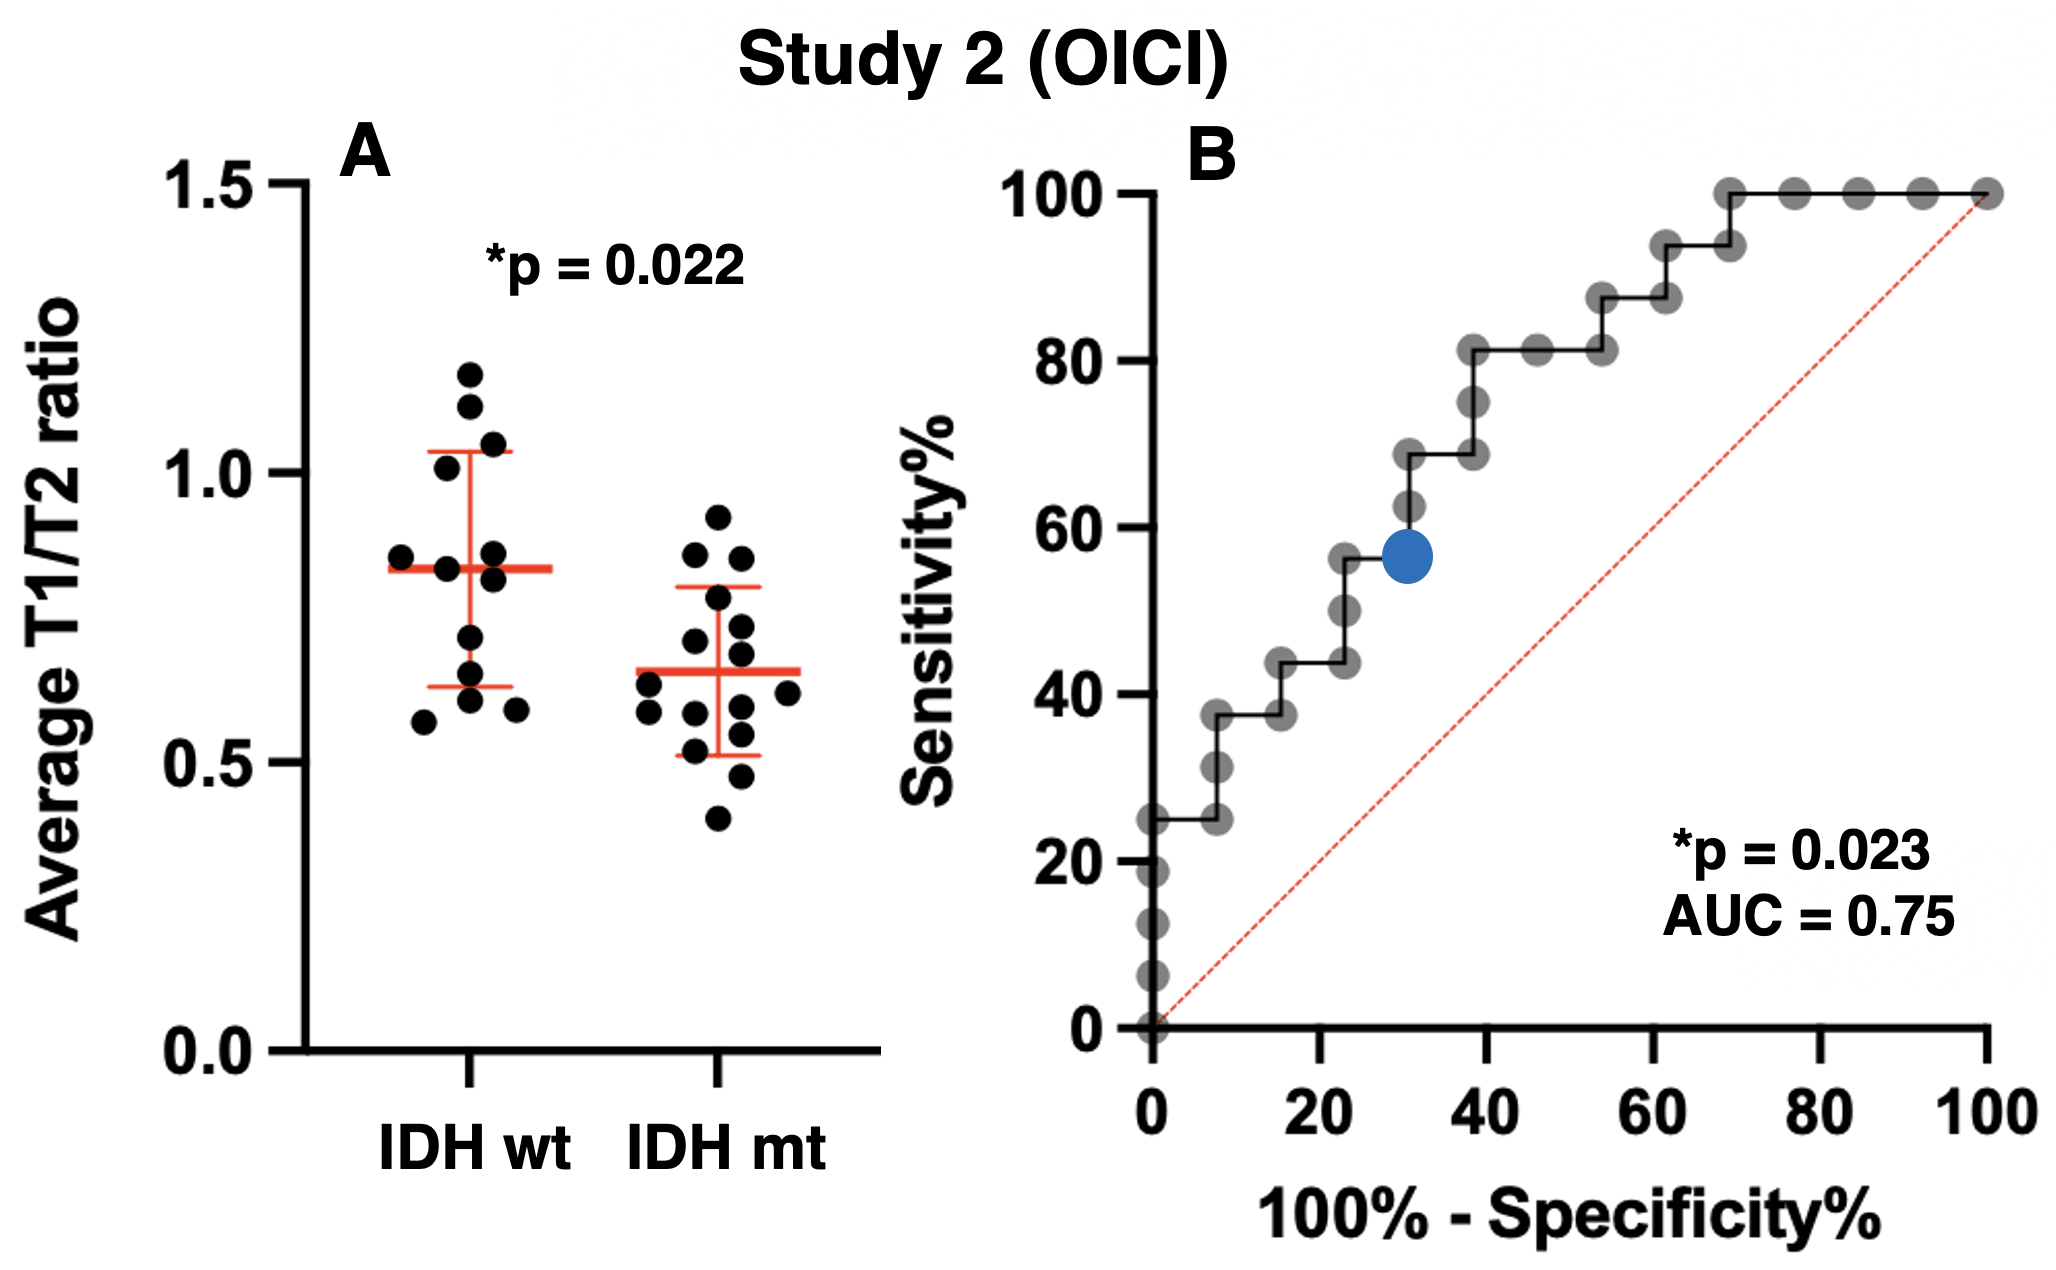
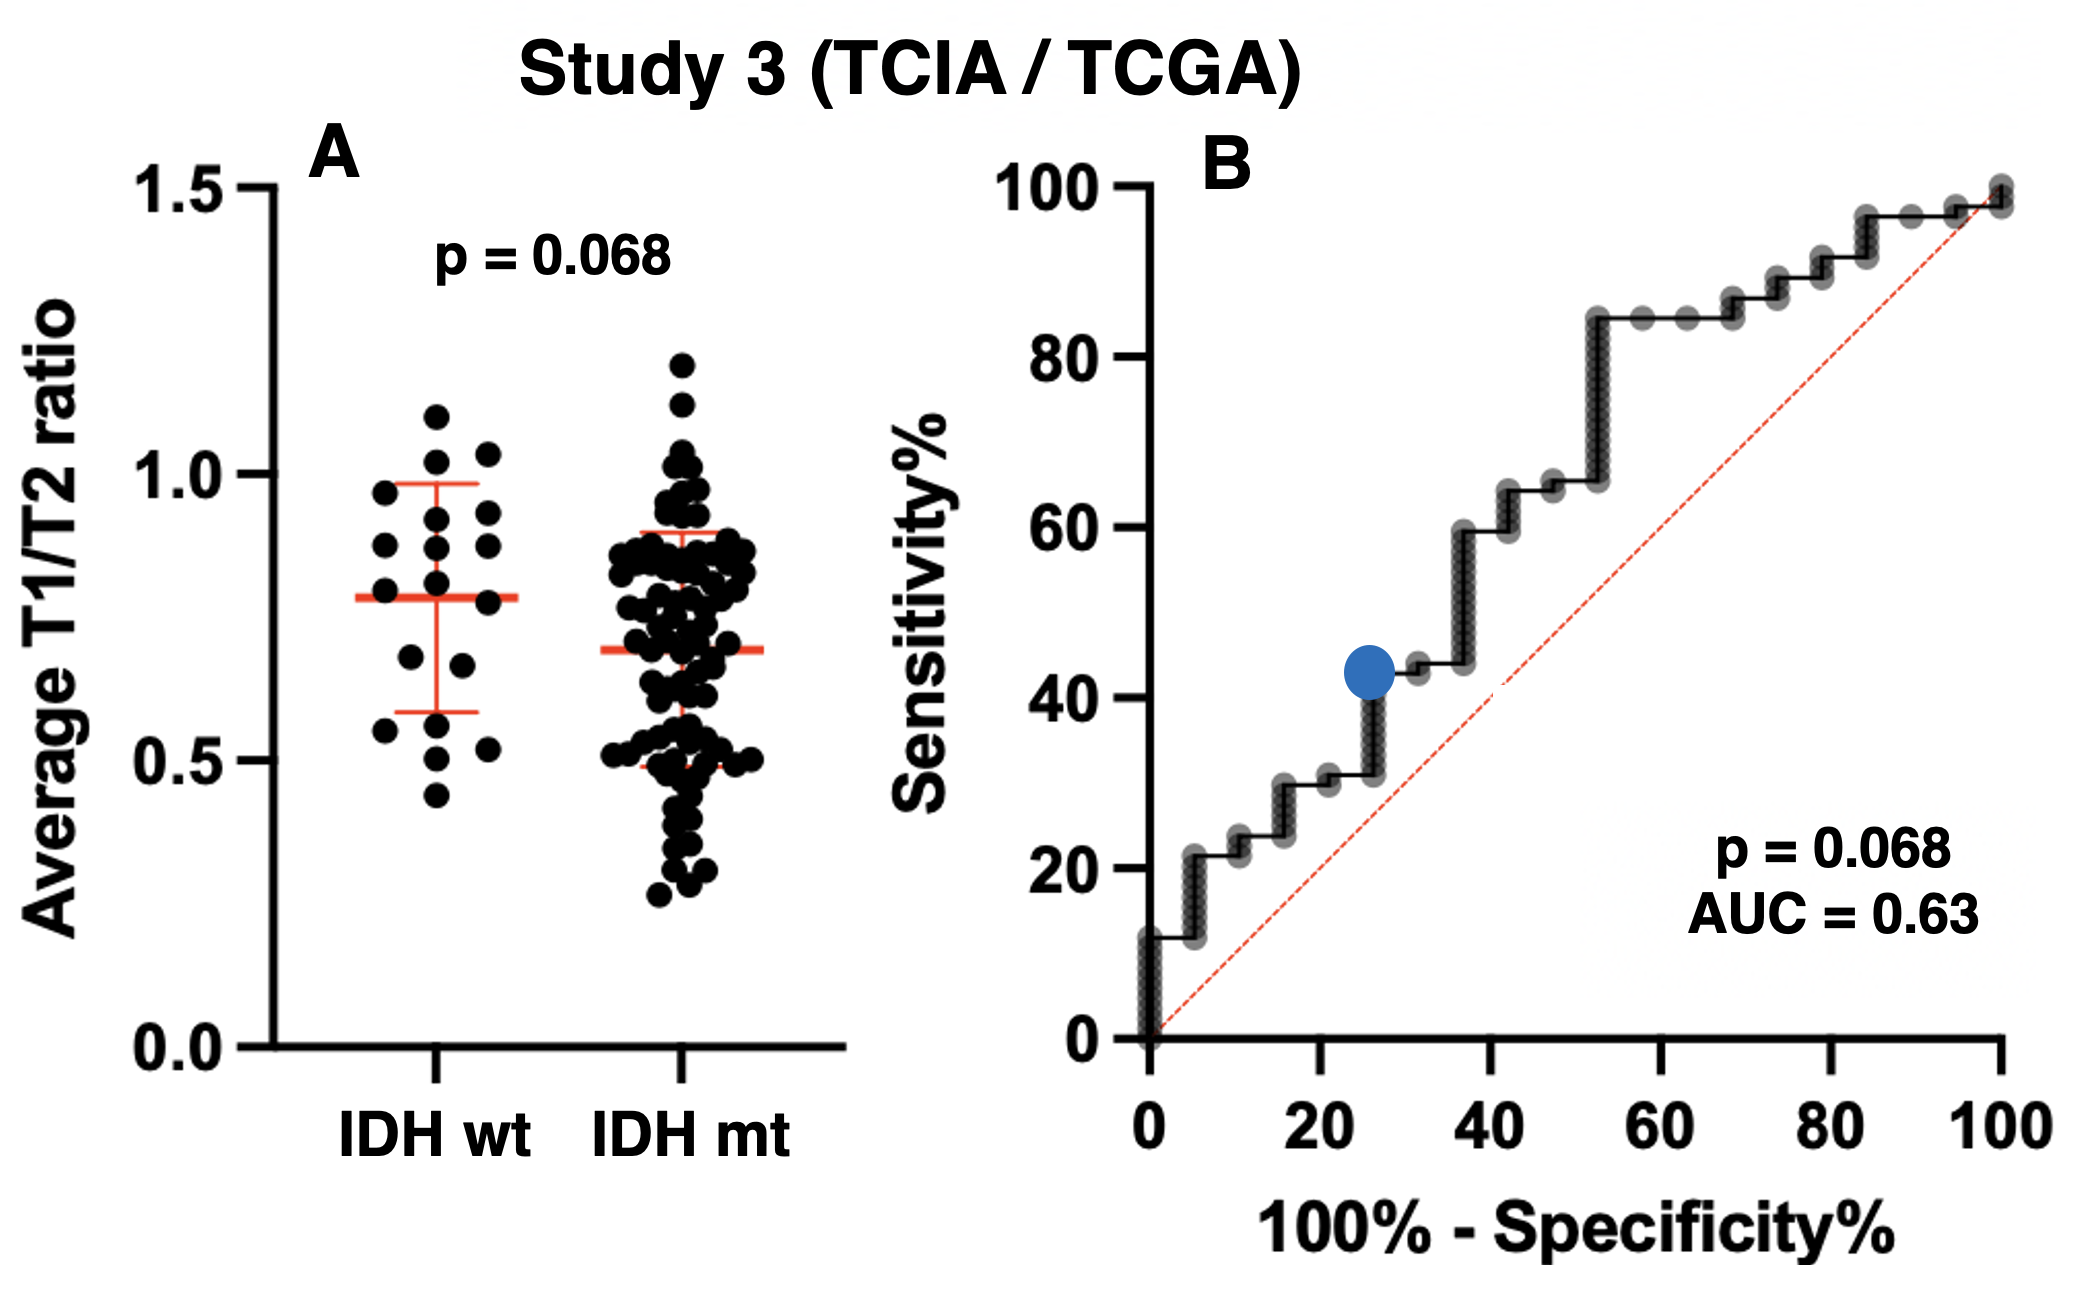
Exploratory cohort (Study1: AMUH): The difference of mrT1/T2 between two groups (IDH-wildtype vs IDH-mutant) was statistically significant (p = 0.0495 < 0.05) (Figure 3A). Moreover, ROC curve analysis showed that the ideal cut-off for detecting mutant IDH was mrT1/T2 < 0.666 ~ 0.677, with a sensitivity of 58.8% and a specificity of 87.5% (AUC = 0.75, p = 0.048) (Figure 3B).Validation cohort (Study2: OICI, Study3: TICA / TCGA): The difference of mrT1/T2 between two groups (IDH-wildtype vs. IDH-mutant) was statistically significant in OICI (p = 0.022 < 0.05) (Figure 4A) but not significant in TCIA / TCGA validation cohort (p = 0.068) (Figure 5A). The result was further validated regarding ROC analysis by the OICI validation cohort (AUC = 0.75, p = 0.023) with a sensitivity of 56.3% and a specificity of 69.2% (Figure 4B). On the other hand, the sensitivity was 42.9%, and the specificity was 68.4 % for the TCIA / TCGA validation cohort (AUC = 0.63, p = 0.068) (Figure 5B).
DISCUSSION
mrT1/T2 ratio of IDH-wildtype LrGG was higher than that of IDH-mutant. This finding is consistent with our previous finding that IDH-wildtype LrGG presented noticeably shorter T1- and T2-relaxation time than IDH-mutant1. Moreover, mrT1/T2 was able to discriminate between IDH-mutant and IDH-wildtype LrGG in the AMUH exploratory cohort. The ROC curve analysis also demonstrated high specificity in predicting IDH mutation using the cut-off of mrT1/T2 < 0.666 ~ 0.677. The result was validated by the domestic validation cohort (Study 2), which revealed that a cut-off of mrT1/T2 < 0.666 ~ 0.677 significantly predicted IDH mutation. On the other hand, diagnostic accuracy declined for the TCIA / TCGA validation cohort (Study 3). The cause of this decline should be further investigated.CONCLUSION
The current study revealed that mrT1/T2 of IDH-wildtype LrGG was higher than IDH-mutant LrGG and that mrT1/T2 could significantly discriminate between IDH-mutant and IDH-wildtype LrGG. The decline of the accuracy in the TCIA/TCGA validation cohort should be further investigated.Acknowledgements
This research was supported by the Japan Society for the Promotion of Science (Grant-in-Aid for Scientific research No.19K09526).References
1. Kinoshita M, Uchikoshi M, Sakai M, Kanemura Y, Kishima H, Nakanishi K. T2-FLAIR Mismatch Sign Is Caused by Long T1and T2 of IDH-mutant, 1p19q Non-codeleted Astrocytoma. Magn Reson Med Sci. 2021 Mar 1;20(1):119-123.
2. Glasser MF, Van Essen DC. Mapping human cortical areas in vivo based on myelin content as revealed by T1- and T2-weighted MRI. J Neurosci. 2011 Aug 10;31(32):11597-616.
3. Pareto D, Garcia-Vidal A, Alberich M, Auger C, Montalban X, Tintoré M, Sastre-Garriga J, Rovira À. Ratio of T1-Weighted to T2-Weighted Signal Intensity as a Measure of Tissue Integrity: Comparison with Magnetization Transfer Ratio in Patients with Multiple Sclerosis. AJNR Am J Neuroradiol. 2020 Mar;41(3):461-463.
Figures