3060
Decreased LC MRI Contrast and Relationship with Orthostatic Hypotension in Multiple System Atrophy1Shanghai Jiao Tong University School of Medicine, Shanghai, China, 2MR Collaborations, Siemens Healthineers Ltd., Shanghai, China, 3Ruijin Hospital / Lu Wan Branch Affiliated to Shanghai Jiao Tong University School of Medicine, Shanghai, China
Synopsis
MRI imaging with Neuromelanin contrast has been thrived in recent years. We adopted this method again to explore the LC contrast differences in multiple system atrophy (MSA). Three methods for quantifying LC contrast were used, which all had the ability to reproduce the results that LC contrast decreases in MSA. We further did subgroup analyses of MSA with orthostatic hypotension (MSA-OH) and MSA without orthostatic hypotension (MSA-nonOH). Interestingly, although LC contrast of the two subgroups were not significantly different, adverse correlations between LC contrast and autonomic dysfunction severity were found in MSA-OH and MSA-nonOH subgroups.
Introduction
Locus coeruleus (LC), locating on the dorsal part of the pons and lateral sides of the fourth ventricle, contains large neurons synthesizing noradrenaline (NA).[1] Previous studies have demonstrated the decreased MRI contrast of the LC in patients with MSA on neuromelanin-sensitive magnetic resonance imaging (NM-MRI)[2]. Orthostatic hypotension (OH) is a common non-motor symptom in multiple system atrophy (MSA) caused by autonomic dysfunction, and is linked with decreased quality of life[3]. But whether or not the LC degeneration has participated in pathogenesis of OH in MSA patients and how the LC MRI contrast may change as autonomic dysfunction goes more severe remain elusive.Purpose
This study aimed to assess if there are significant differences of LC contrast between MSA with OH (MSA-OH) and MSA without OH (MSA-nonOH) subgroups.Methods
20 patients who were diagnosed as MSA during hospital stay were consecutively recruited to this study. 9 healthy controls (HC) and 6 PD patients were also recruited during the study. Before MRI acquisition, the Scales for Outcomes in Parkinson’s disease – Autonomic (SCOPA-AUT) were assessed by experienced researchers. LC contrast was quantified using 2D GRE sequence with magnetization transfer contrast (MTC) preparation pulse imaging. LC and reference regions including middle cerebellum peduncles (MCP), pons and potine tegmentum (PT) were manually drawn and the signal intensity (SI) was then extracted from these ROIs . LC to MCP, pons and PT contrast ratio were then calculated as LCcontrast ratio = [(SILC – SIref)/SIref], respectively. Comparisons of LC contrast among groups and subgroups were made by using Kruskal-Wallis test. Pearson’s correlations between LC contrast and SCOPA-AUT rating scales were also performed.Results
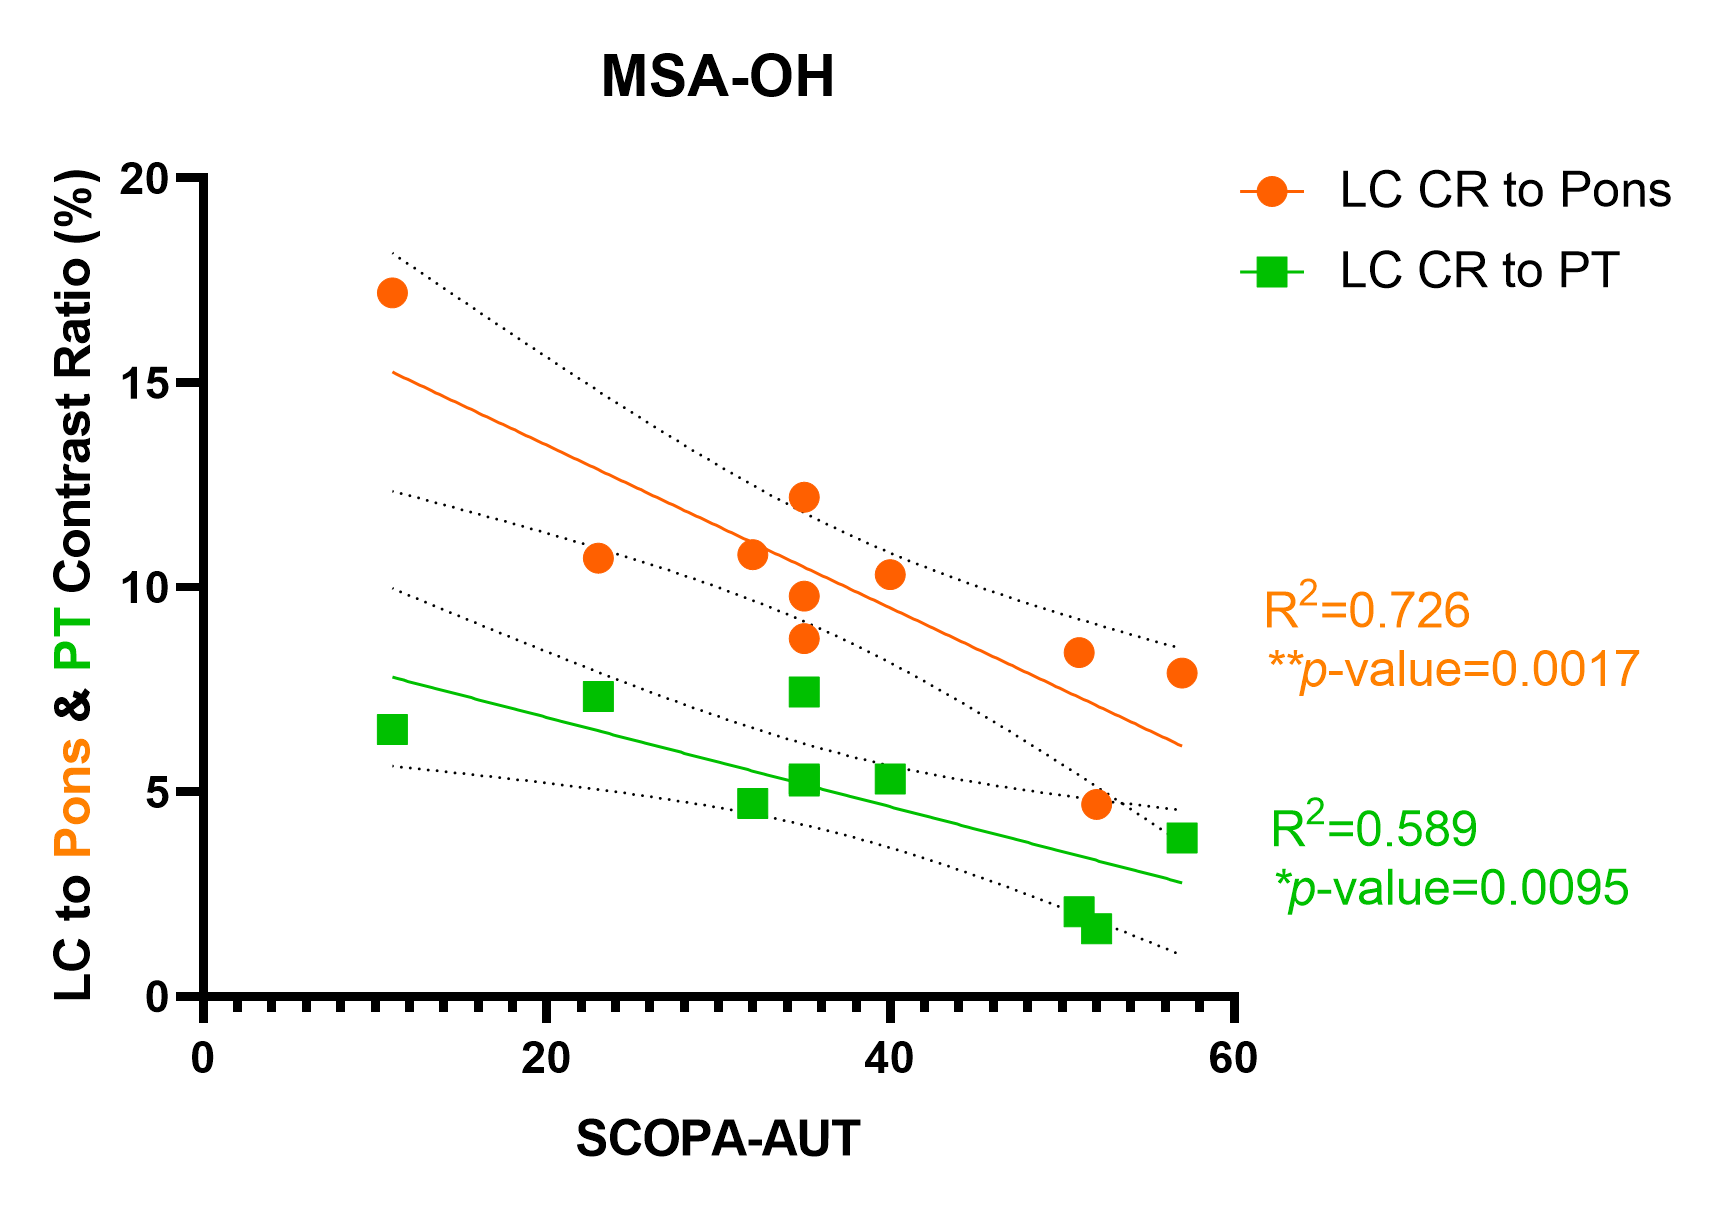
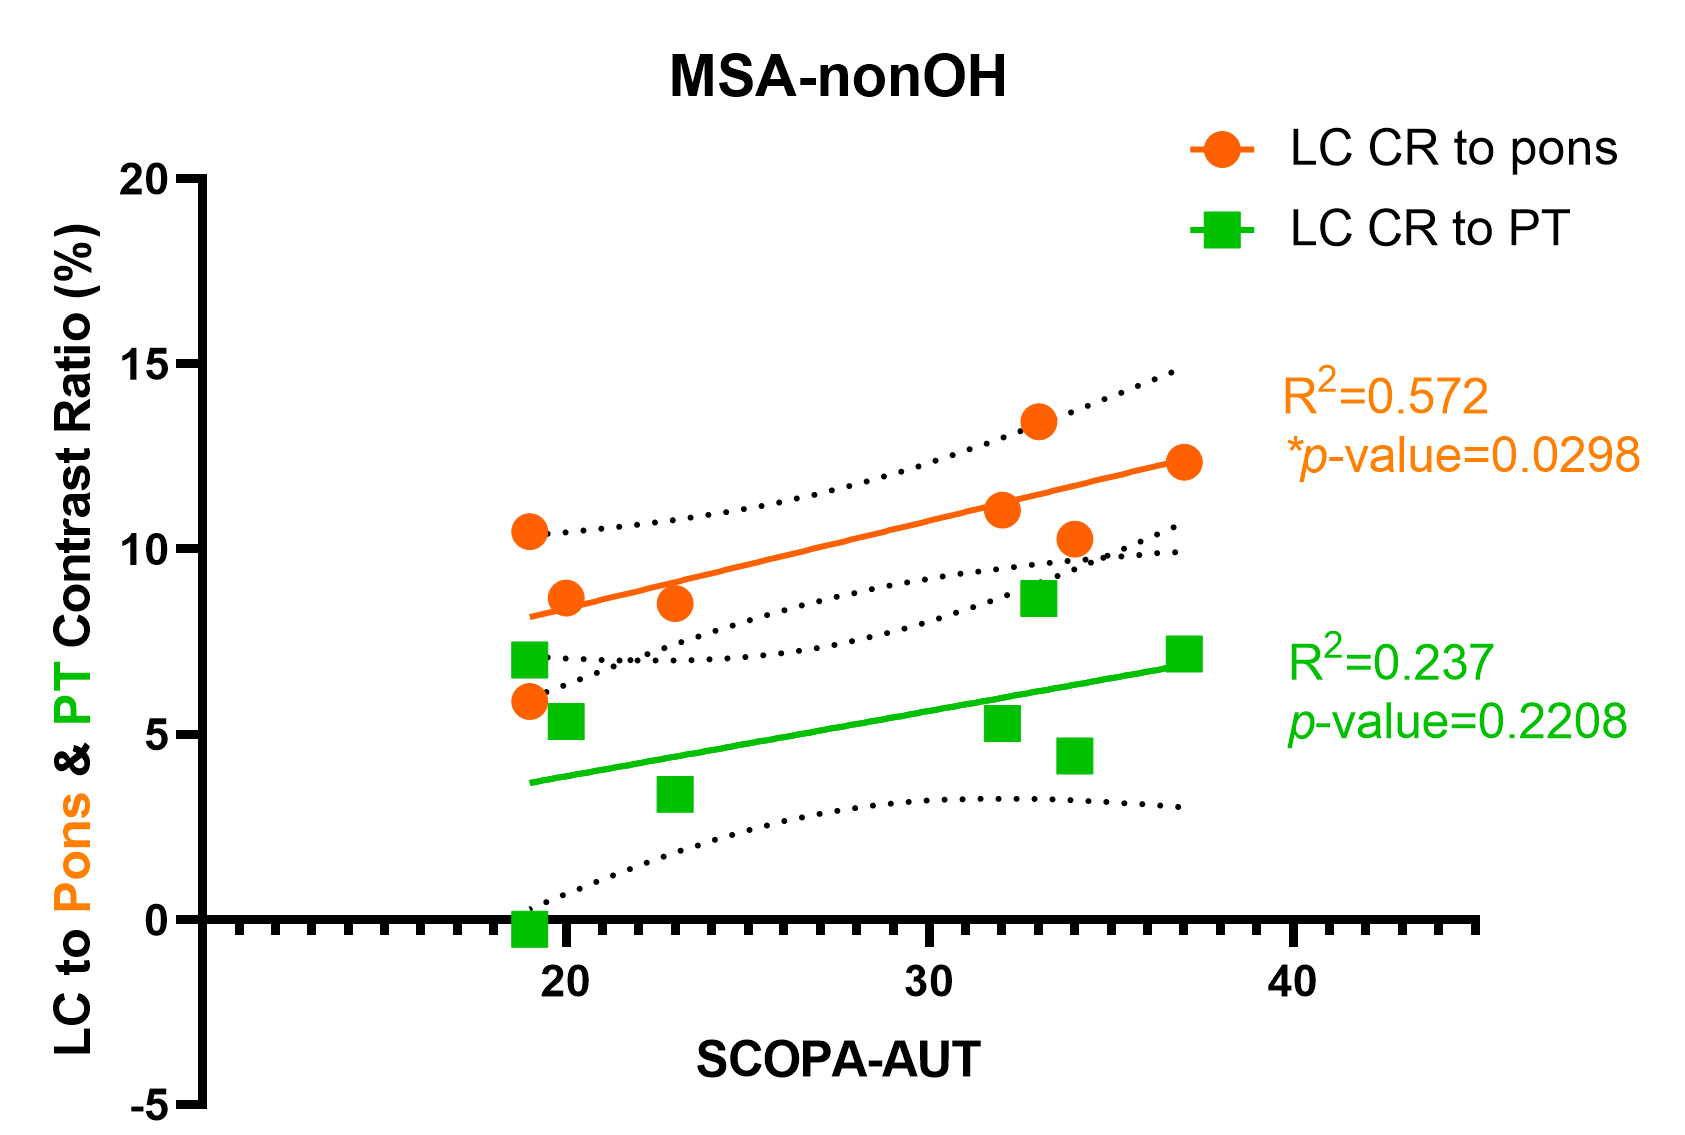
LC to MCP contrast ratio and contrast ratio of LC to pons was significantly reduced in MSA patients compared with HC (P<0.0001, P<0.0001, respectively) and PD (P=0.001, P=0.006, respectively). LC to PT contrast ratio of MSA was only significantly lower than HC (P=0.0004), but the difference was not significant when compared with PD (P=0.49). In MSA-OH subgroup, the LC to pons contrast ratio had significant negative correlation with SCOPA-AUT rating scales (R2=0.726, P=0.0017), but it manifested significant positive correlation with SCOPA-AUT rating scales (R2=0.572, P=0.03) in MSA-nonOH subgroup. LC to PT contrast ratio also demonstrated significant negative correlation with SCOPA-AUT scales (R2=0.589, P=0.0095) in MSA-OH patients. There was also positive correlation between LC to PT contrast ratio and SCOPA-AUT scales (R2=0.237) within MSA-nonOH subgroup, but the result was not significant (P=0.221). However, no significant differences of LC contrast ratio to MCP, pons, and PT were seen between MSA-OH and MSA-nonOH subgroups.Discussion
By adapting NM-MRI technique, we performed three methods for quantifying LC contrast, which all have the ability to reproduce the decreased LC contrast in MSA, compared with PD and HC as previously reported[2]. We further analyzed correlations between LC contrast and rating scales of autonomic dysfunction in MSA-OH and MSA-nonOH. We reported that LC contrast changes in reverse trends in MSA-OH and MSA-nonOH patients respectively as the autonomic dysfunction getting more severe (representing a higher SCOPA-AUT scale).Conlusion
MSA patients have significantly reduced LC MRI contrast compared to HC and PD. In MSA-OH, patients with more severe autonomic dysfunction tend to manifest lower LC contrast. In MSA-nonOH, LC contrast tends to be higher as autonomic dysfunction develops more severe.Acknowledgements
Thanks for the support from my teachers, parents and friends.References
[1] Poe GR, Foote S, Eschenko O, et al. Locus coeruleus: a new look at the blue spot. Nat Rev Neurosci. 2020 Nov;21(11):644-659.
[2] Matsuura K, Maeda M, Yata K, et al. Neuromelanin magnetic resonance imaging in Parkinson's disease and multiple system atrophy. Eur Neurol. 2013;70(1-2):70-7.
[3] Koga S, Dickson DW. Recent advances in neuropathology, biomarkers and therapeutic approach of multiple system atrophy. J Neurol Neurosurg Psychiatry. 2018;89(2):175-184.
Figures