3059
Altered intrinsic functional connectivity across nine brain networks in early stages of idiopathic Parkinson’s disease1Department of Diagnostic Radiology, Singapore General Hospital, Singapore, Singapore, 2Duke-NUS Medical School, Singapore, Singapore, 3Graduate Institute of Medicine, Yuan Ze University, Taoyuan, Taiwan, 4Department of Neurology, National Neuroscience Institute – SGH Campus, Singapore, Singapore
Synopsis
Parkinson’s disease (PD) is a common neurodegenerative disease. Besides motor deficits, autonomic and cognitive dysfunctions might be caused by global abnormalities beyond the dopaminergic system. We performed resting-state fMRI to measure functional connectivity between the central autonomic network and eight other critical resting networks in both early PD and healthy control groups. Using general linear models, we identified functional impairments in the inter- and intra-network connections in relation to various brain functions. These findings could shed light on the neural mechanisms behind the complex clinical manifestations evident even in the early stages of PD.
Introduction
Parkinson’s disease (PD) is a common movement disorder, with the pathological hallmark of dopaminergic neurodegeneration that also causes different autonomic and cognitive symptoms.1,2 Mounting evidence from fMRI studies implicate resting-state networks beyond the dopaminergic system in non-motor symptoms in PD2, but there are no conclusive findings. Notably, the central autonomic (CA) network plays the key role in regulating both the sympathetic and parasympathetic systems has recently emerged. Impairments in the CA and other resting networks have been associated with cognitive and autonomic dysfunctions in PD patients2, e.g., constipation at prodromal and early PD.3 However, limited resting-state fMRI (rsfMRI) studies in PD report aberrant functional communications between the CA and other resting-state networks and their association with motor/non-motor symptoms. Therefore, the present study performed ROI-to-ROI analysis to investigate functional connectivity (FC) between the cerebral regions of interest (ROI) involved in nine resting-state networks, including CA4, CereBellar (CB), Dorsal Attention (DA), Default Mode (DM), Frontal Parietal (FP), Language (Lan), Salience (Sal), SensoriMotor (SM), and Visual (Vis) networks in early PD and healthy groups. We also explored the presence of FC among the nine networks relevant to clinical motor/non-motor manifestations in PD.Methods and Materials
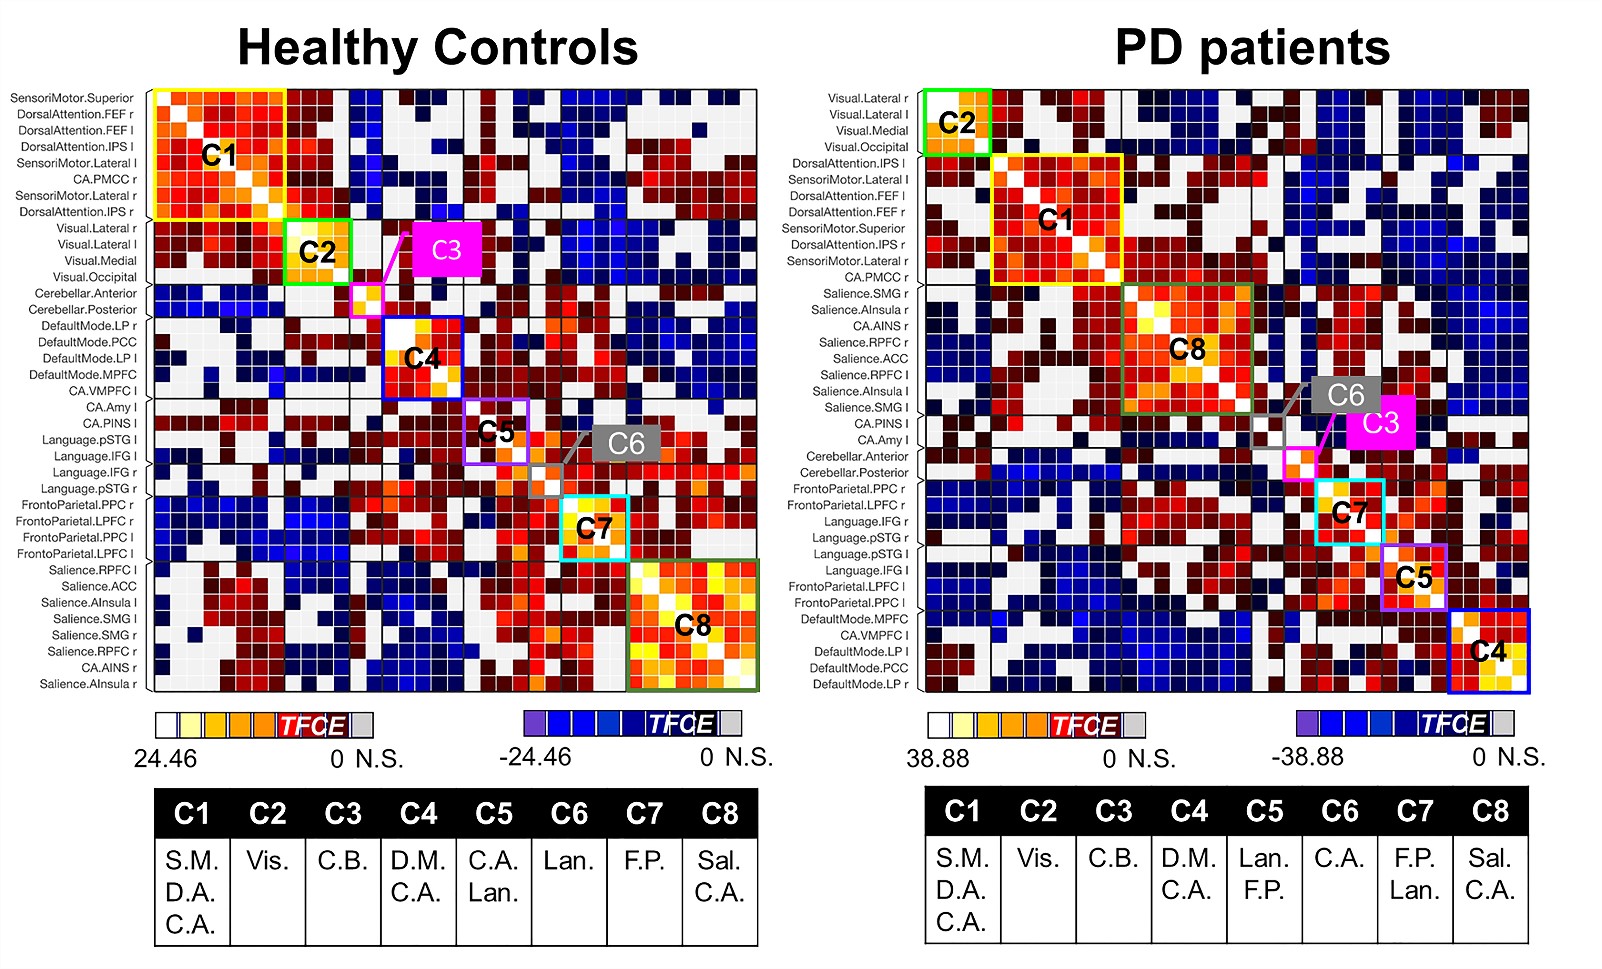
Seventy-eight early-stages PD patients and 42 healthy controls were enrolled into this study (Table 1). They underwent motor [Hoehn and Yahr (H&Y) and United Parkinson Disease Rating Scale part III (UPDRS III)] and non-motor (Frontal Assessment Battery, Mini Mental State Examination, Montreal Cognitive Assessment, Non-Motor Symptom assessments, and brain MRI using a resting-state fMRI (rsfMRI) protocol on a 3T scanner (Skyra, Siemens Healthcare, Erlangen, Germany) with a 32-channel head coil. rsfMRI data was acquired by the 2D multi-slice gradient echo-planar-imaging sequence: TR/TE=3000/30ms, FA=90°, in-plane resolution=2.13x2.13x3.3mm3, number of slices=44, number of measurements=150. All subjects were instructed to rest quietly, keep their eyes open, fixate on a cross, and not to fall asleep.To avoid the influence of dopaminergic therapy on rsfMRI data, patients omitted their medications overnight before brain MRI in the morning, and were therefore in the “OFF” state. The rsfMRI data preprocessing and ROI-to-ROI analysis were conducted using CONN toolbox.5 The data preprocessing included the removal of the first five rsfMRI measurements, quality control for motion with the exclusion criteria of undesired mean framewise displacement of rsfMRI fluctuations larger than 0.5mm, slice timing correction, motion correction, co-registration between rsfMRI and structural T1-weighted images, tissue segmentation, spatial normalization onto the MNI152 template, and spatial smoothing by a 6-mm FWHM. The preprocessed rsfMRI signals were then adjusted by nuisance regression. Finally, the resulting rsfMRI signals were filtered using a bandpass filter of 0.008–0.09 Hz. The ROI-to-ROI analysis using the Fisher-transformed bivariate Pearson correlation between the filtered rsfMRI timeseries from a pair of ROIs in nine resting-state networks produced an ROI-to-ROI FC matrix comprising of Fisher-transformed correlation coefficients for each subject. There were 666 connections from 37 ROIs in total in each FC matrix (Fig. 1). Between-group comparisons of FC matrices was performed using general linear model (GLM) with Threshold Free Cluster Enhancement (TFCE) at a given threshold p < 0.05. The degree of correlations between FC of ROIs and various clinical PD assessments were evaluated using multivariate GLM with the same TFCE threshold, controlling for gender effects.Results
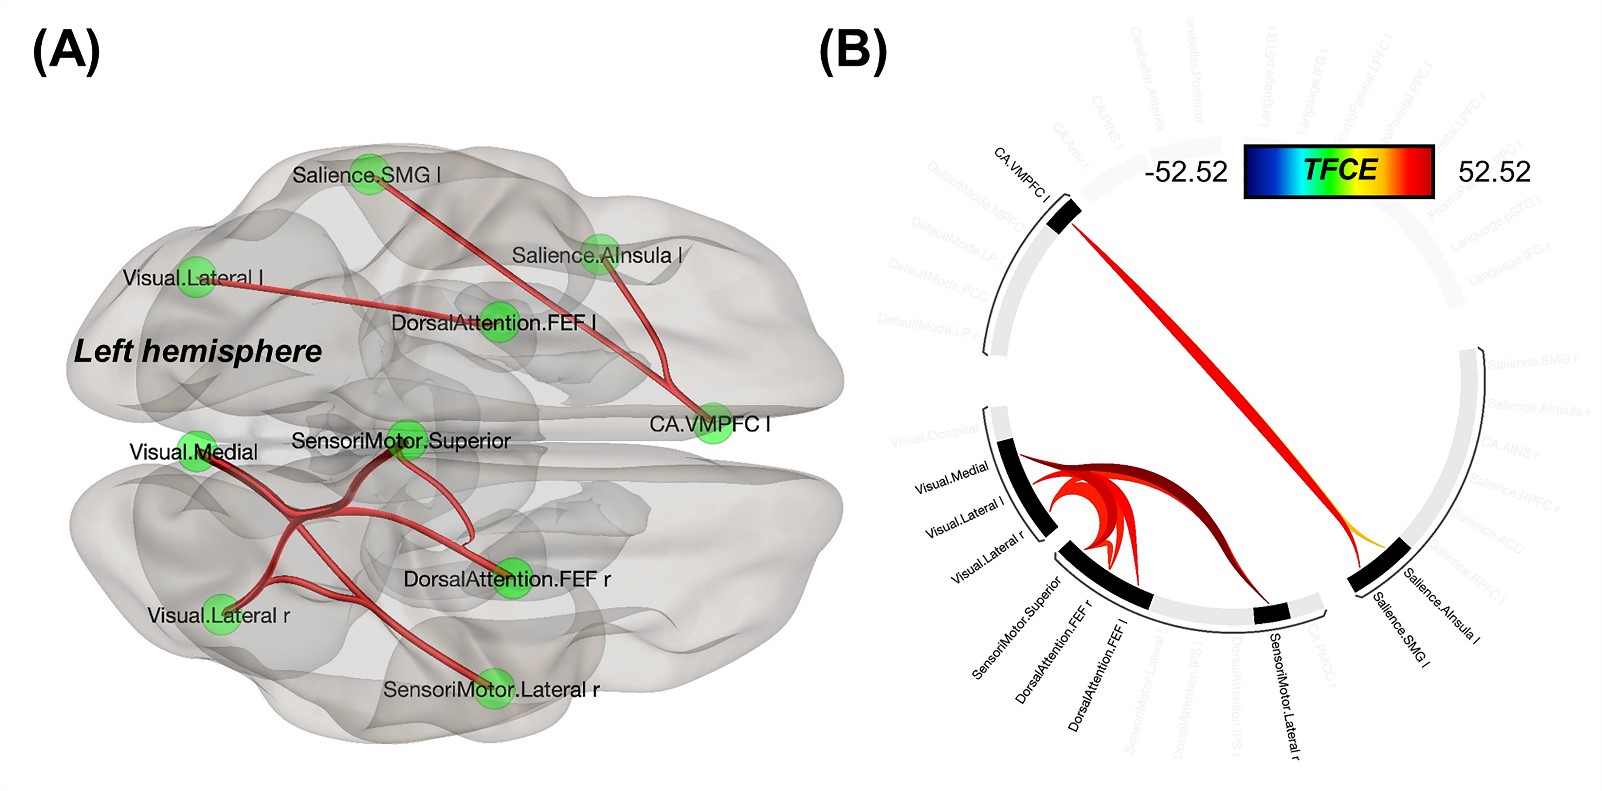
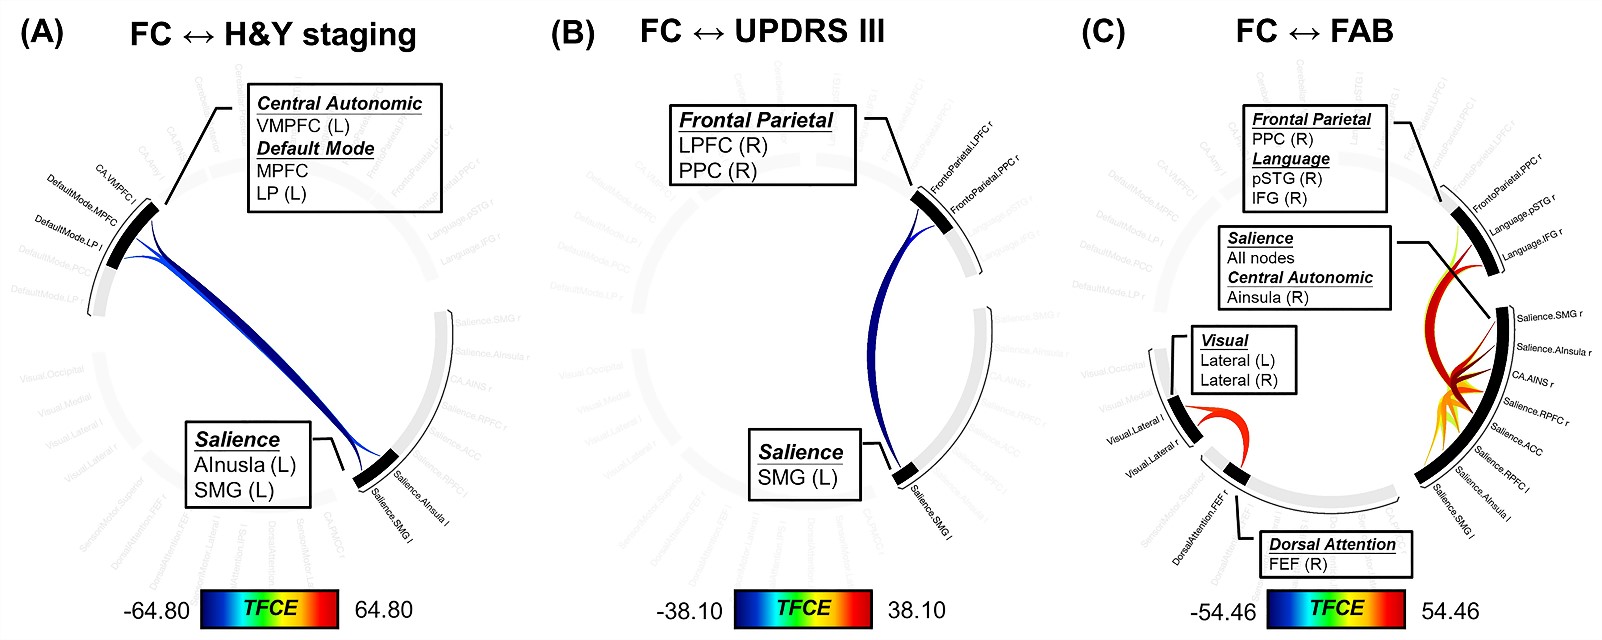
Compared to patients, increased FC was found in several inter-network connections in healthy controls: the ventromedial prefrontal cortex in CA to two Sal regions, and connections between the frontal eye fields in the DA, Vis, and SM networks (Fig. 2). Multivariate GLM revealed negative correlations between FC and H&Y and/or UPDRS III scores: reduced FC on the CA-to-Sal and DM-to-Sal connections were associated with elevated H&Y scores (Fig. 3A), reduced FC on the two FP-to-Sal connections (i.e., lateral prefrontal cortex and posterior parietal cortex in the right FP network linked to the left supramarginal gyrus in Sal) were associated with increased UPDRS III (Fig.3B). FC also positively correlated to the FAB scores in patients for the following: decreased FC on the intra-Sal, CA-to-Sal (anterior insula to anterior cingulate cortex), FP-to-Sal, Lan-to-Sal, and DA-to-Vis connections were associated with worse FAB scores (Fig. 3C). There was no FC in relation to the rest of the clinical assessments.Discussion
Collectively, we revealed that early-stage off-medication PD patients had reduced intrinsic FC on the CA-to-Sal interconnections and the DA-SM-Vis interconnections. Given that brain regions in the CA-to-Sal interconnections are responsible for emotional processing and autonomic response to arousal6, these could be a neural substrate of anxiety in PD.7 As the DA-SM-Vis regions implicate visual attention and oculomotor control8,9, our findings are in the agreement with oculomotor deficits in PD reported by Zhang et al.8 Interestingly, we found FC on the inter-network connections beyond the SM in relation to motor symptoms. In fact, the ventromedial prefrontal cortex and a triple network model of DM/Sal/FP10 implicate executive function, and the subtle fine motor skill disability due to executive dysfunctions11,12 was suggested to be an early PD motor symptom.11 Finally, positive correlations between FC and FAB suggested that weaker functional communications among these networks could lead to poor frontal lobe functions.13Conclusion
Aberrant FC across nine resting networks offers further insights into functional mechanisms behind the complicated motor/non-motor manifestations in early-stage off-medication PD patients.Acknowledgements
No acknowledgement found.References
1. Roy HA, Green AL. The Central Autonomic Network and Regulation of Bladder Function. Front Neurosci 2019;13:535.
2. Prell T. Structural and Functional Brain Patterns of Non-Motor Syndromes in Parkinson's Disease. Front Neurol 2018;9:138.
3. Mulak A, Bonaz B. Brain-gut-microbiota axis in Parkinson's disease. World J Gastroenterol 2015;21(37):10609-10620.
4. Sie JH, Chen YH, Chang CY, Yen NS, Chu WC, Shiau YH. Altered Central Autonomic Network in Baseball Players: A Resting-state fMRI Study. Sci Rep 2019;9(1):110.
5. Whitfield-Gabrieli S, Nieto-Castanon A. Conn: a functional connectivity toolbox for correlated and anticorrelated brain networks. Brain Connect 2012;2(3):125-141.
6. Hilz MJ, Devinsky O, Szczepanska H, Borod JC, Marthol H, Tutaj M. Right ventromedial prefrontal lesions result in paradoxical cardiovascular activation with emotional stimuli. Brain 2006;129(Pt 12):3343-3355.
7. Carey G, Lopes R, Viard R, et al. Anxiety in Parkinson's disease is associated with changes in the brain fear circuit. Parkinsonism Relat Disord 2020;80:89-97.
8. Zhang Y, Yan A, Liu B, et al. Oculomotor Performances Are Associated With Motor and Non-motor Symptoms in Parkinson's Disease. Front Neurol 2018;9:960.
9. Pinkhardt EH, Jurgens R, Lule D, et al. Eye movement impairments in Parkinson's disease: possible role of extradopaminergic mechanisms. BMC Neurol 2012;12:5.
10. Menon V. Large-scale brain networks and psychopathology: a unifying triple network model. Trends Cogn Sci 2011;15(10):483-506.
11. Iakovakis D, Chaudhuri KR, Klingelhoefer L, et al. Screening of Parkinsonian subtle fine-motor impairment from touchscreen typing via deep learning. Scientific Reports 2020;10(1):12623.
12. Piek JP, Dyck MJ, Nieman A, et al. The relationship between motor coordination, executive functioning and attention in school aged children. Archives of Clinical Neuropsychology 2004;19(8):1063-1076.
13. Dubois B, Slachevsky A, Litvan I, Pillon B. The FAB: a Frontal Assessment Battery at bedside. Neurology 2000;55(11):1621-1626.
Figures
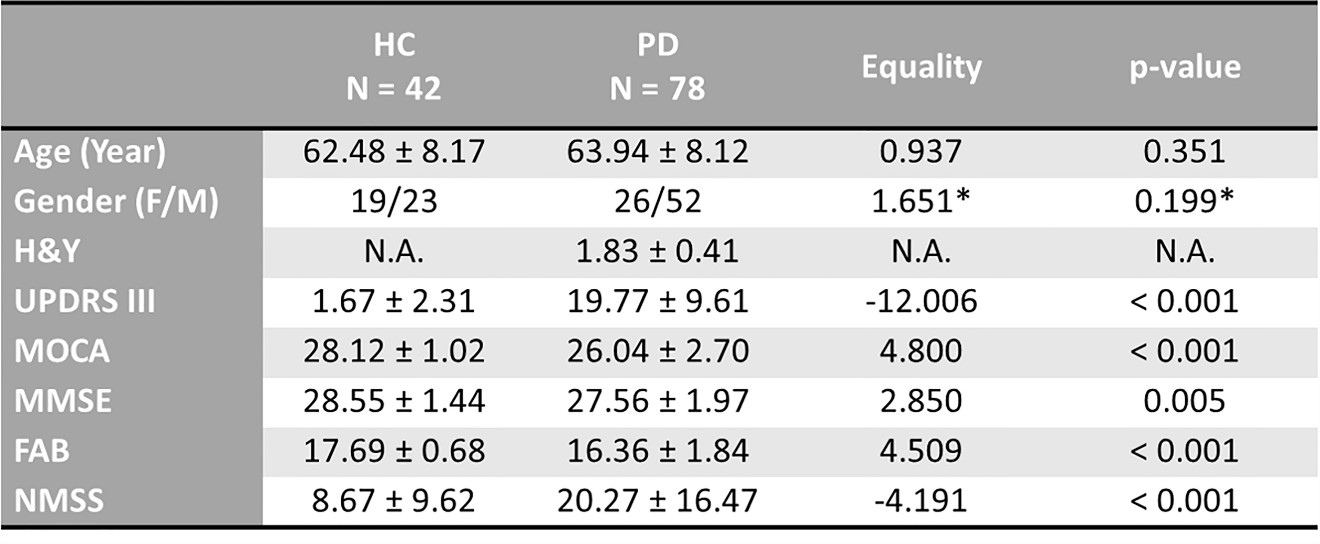
TABLE 1. Demographics of study groups
Note: *The equality of gender population between the study groups was examined by Chi square test, and the rest of the demographical items were examined by two-sample t-test. FAB = Frontal Assessment Battery; H&Y = Hoehn and Yahr scale; HC = Healthy Control; MMSE = Mini Mental State Examination; MOCA = Montreal Cognitive Assessment; NMSS = Non-Motor Symptoms; UPDRS III = United Parkinson Disease Rating Scale part III.