3056
Anatomical changes and iron deposition of Parkinson's disease, multiple system atrophy, and progressive supranuclear palsy on 7 Tesla MRI1Department of Neurology, Beijing Tiantan Hospital,Captital Medical University, Beijing, China, 2China National Clinical Research Center for Neurological Diseases, Beijing, China, 3Tiantan Neuroimaging Center of Excellence, Beijing Tiantan Hospital, Capital Medical University, Beijing, China, 4MR Collaboration, Siemens Healthineers Ltd., Beijing, China
Synopsis
Ultra-high field MRI enables visualization of anatomical alterations and quantification of iron deposition in the subcortical nucleus. To investigate whether 7T MRI could provide the diagnostic opportunity for Parkinson-plus syndromes, we recruited PD, MSA-P, MSA-C and PSP patients who underwent multi-modal scans including 3D MPRAGE and 3D multi-echo T2*-weighted MRI. All six patients with MSA-C showed visible nigrosome-1. The distances from SN to RN were significantly shorter in PSP than PD. The R2* values in SN, RN and putamen were significantly higher in MSA-P than PD. Our pilot study provided first-of-its-kind evidence that 7T MRI could help diagnose Parkinson-plus syndromes.
Introduction
Ultra-high field (UHF) magnetic resonance imaging (MRI) can visualize anatomical alterations of the substantia nigra (SN) in Parkinson’s disease (PD), which can be used to differentiate healthy subjects from PD patients1. However, it is unknown whether seven-tesla (7T) MRI could provide the diagnostic opportunity for Parkinson-plus syndromes, especially in the Chinese population. To address this question, we investigated the anatomical change and iron deposition in the subcortical nucleus of PD, multiple system atrophy with predominant parkinsonism (MSA-P), multiple system atrophy with predominant cerebellar ataxia (MSA-C) and progressive supranuclear palsy (PSP) at 7T MRI.Methods
Twenty-one PD patients, six MSA-P patients, six MSA-C patients and three PSP patients were recruited. The study was approved by the local Ethical Standards Committee, and written informed consent was obtained from all participants. All the subjects underwent 7T MR(MAGNETOM Terra, Siemens Healthcare, Erlangen, Germany) scans with three-dimensional (3D) MPRAGE (sagittal scan, 0.7mm isotropic resolution, TI/TR = 1050/2200ms, acceleration = 2, scan time = 6:12) and 3D multi-echo T2*-weighted (transverse scan, 4-echo 3D GRE, acquisition voxel = 0.4×0.4×0.5mm3, 88 axial slices, TE = 8/15/22/29 ms, TR = 42ms, flip angle = 16°, acceleration = 3, scan time = 8:24) sequences.Manual tracings of the regions of interest (ROIs) including SN, red nucleus (RN), subthalamic nucleus (STN) and putamen and the 3D reconstructions were performed using the 3D Slicer software (http://www.slicer.org). Two experienced neurologists independently performed ROI 3D reconstructions. The interrater reliability of the 3D reconstructions was evaluated by calculating the dice values using Matlab (version R2021a, MathWorks, Inc., Natick, MA, USA). As brain size varies across subjects, we normalized individual ROIs volume with respect to total intracranial volume (TIV). The TIV was calculated using MPRAGE with intensity non-uniformity correction (strong option) within the CAT software (http://www.neuro.uni-jena.de/cat/). The presence or absence of the nigral hyperintense structure (nigrosome-1) were also independently assessed by two experienced neurologists who were blinded to the clinical diagnosis. The R2* map was calculated using the linear least-squares regression method from multi-echo images in Matlab.
Results
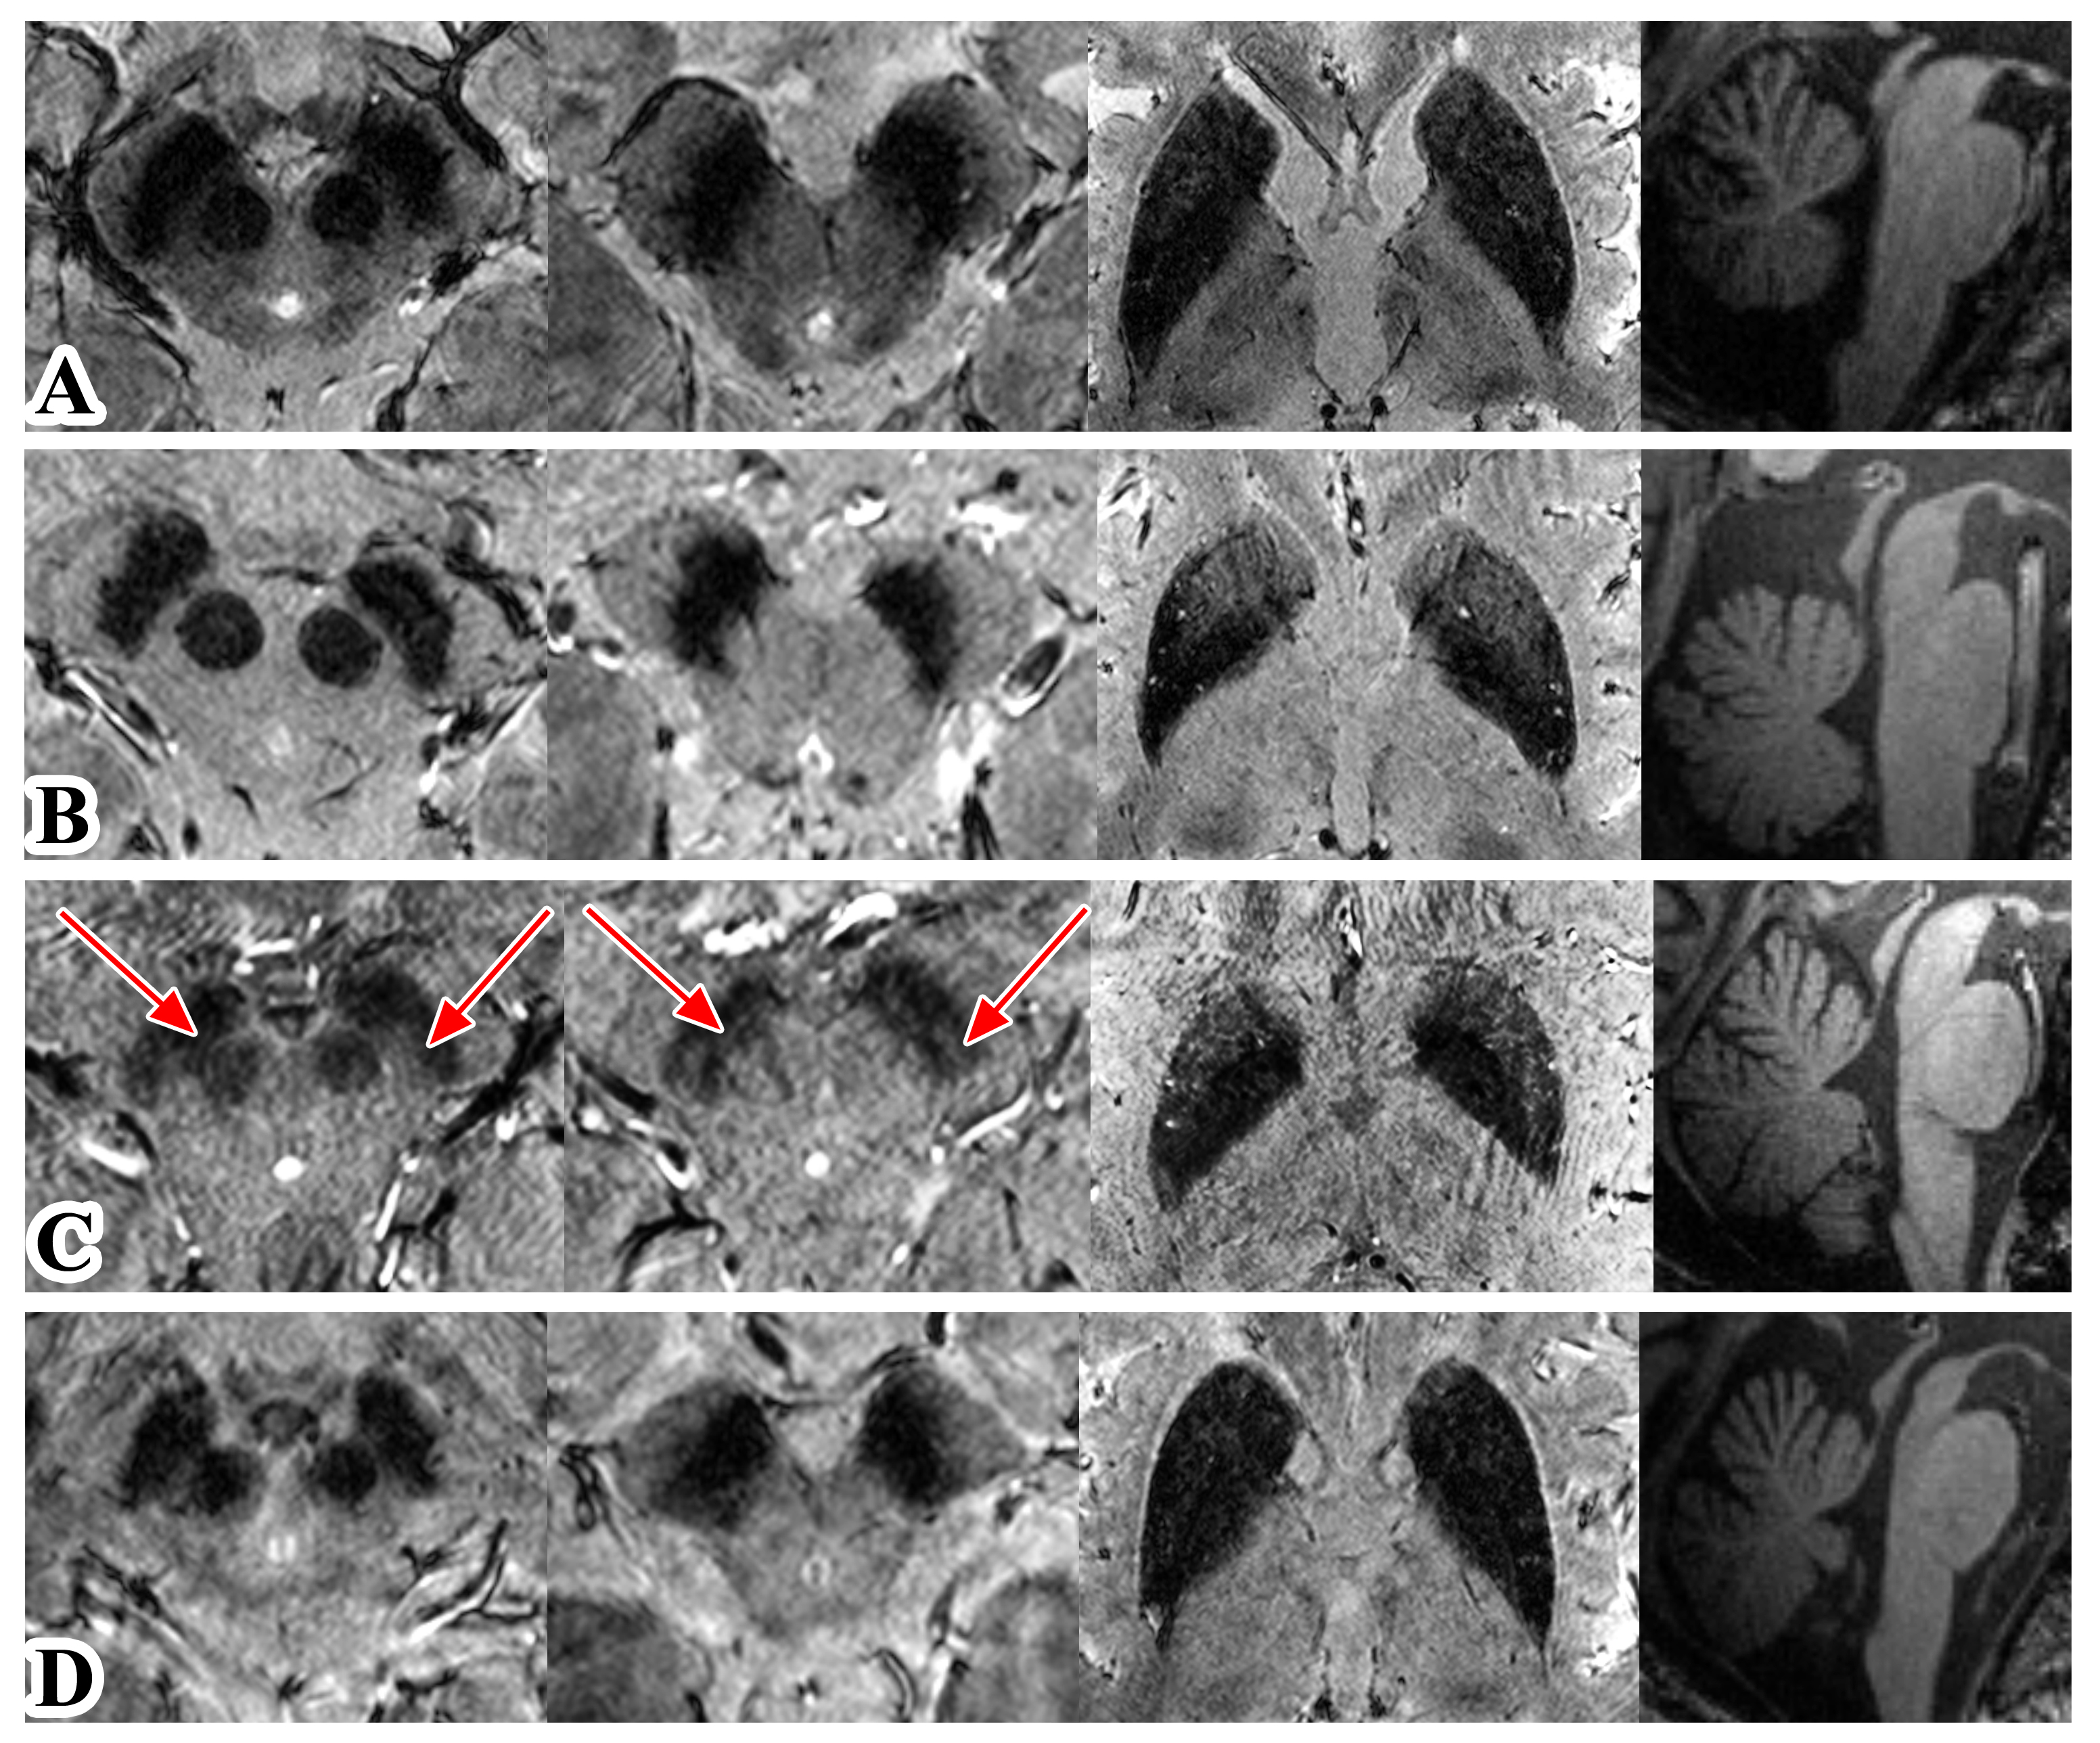
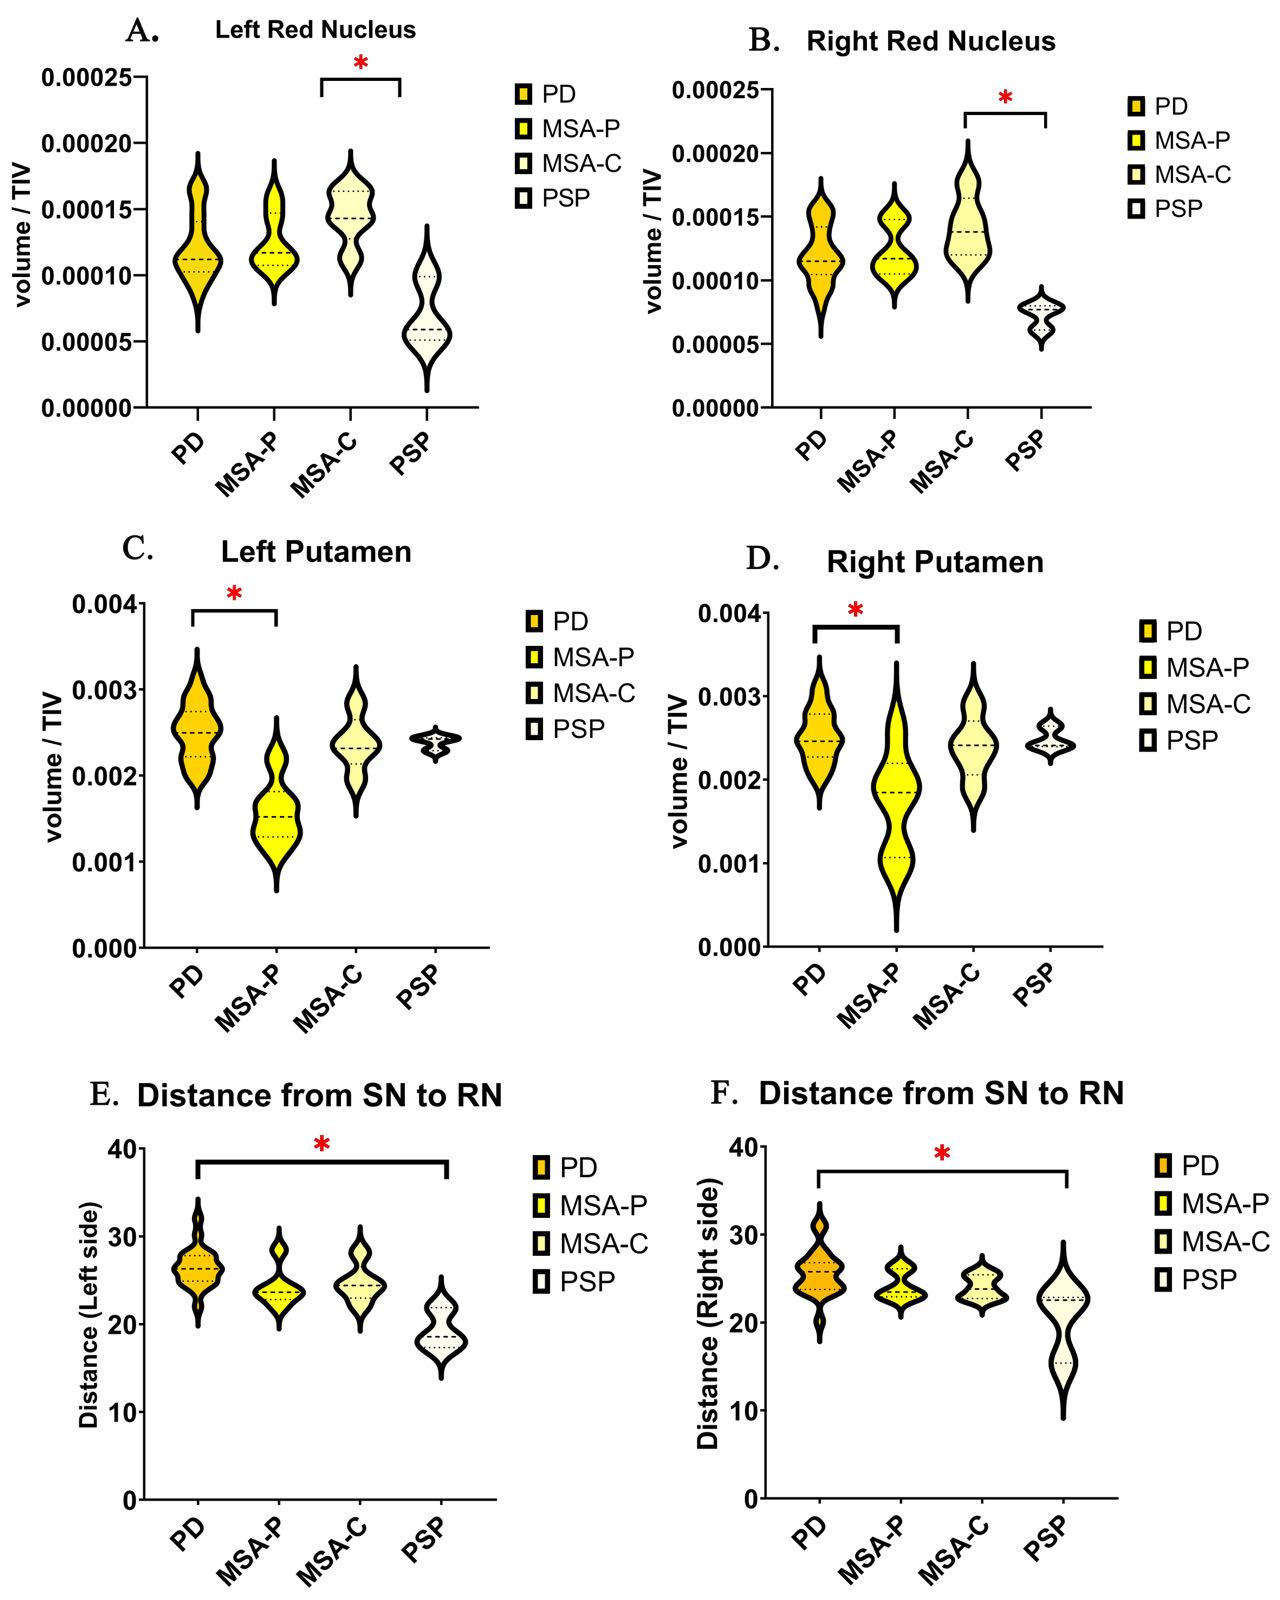
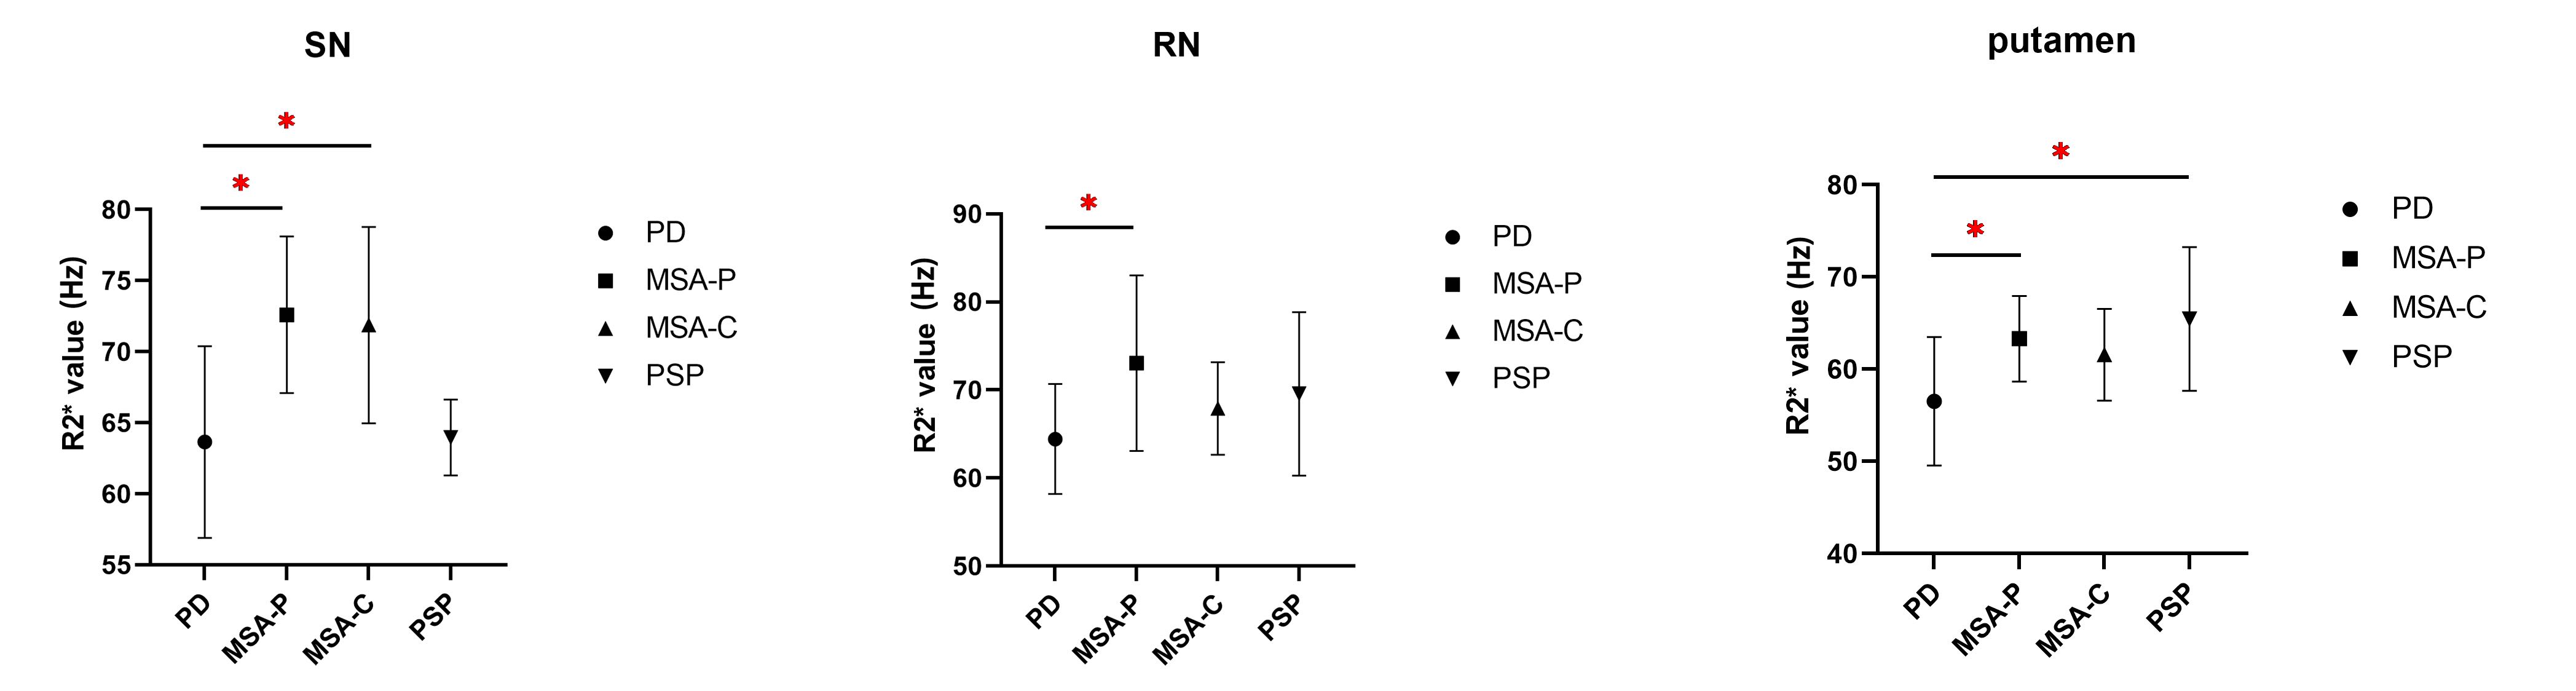
The dice value of ROIs (SN, RN, STN and putamen) manually traced by two neurologists was 0.87, 0.86, 0.78 and 0.89, respectively. Nigrosome-1 loss was observed in all patients with PD, MSA-P, and PSP. However, all six patients with MSA-C showed visible nigrosome-1 (Figure 1). Besides, the RN volumes were significantly smaller in PSP than MSA-C (left side: p=0.019, right side: p=0.014) (Figure 2A and B). The putamen volumes were significantly smaller in MSA-P than PD (left side: p=0.002, right side: p=0.030) (Figure 2C and D). The distances from SN to RN were significantly shorter in PSP than PD (left side: p=0.012, right side: p=0.037) (Figure 2E and F). Moreover, the R2* values in SN (p=0.018), RN (p=0.024) and putamen (p=0.036) were significantly higher in MSA-P than PD (Figure 3).Discussion
To our best knowledge, this is the first study using 3D T2*-weighted scans in 7T MRI to investigate anatomical changes and iron deposition in Parkinson-plus syndromes. Consistent with previous studies2,3, nigrosome-1 was also lost in PD, MSA-P and PSP patients in our study. However, although only one of five MSA-C patients showed intact nigrosome-1 in the previous study3, we find the nigral hyperintense structure is visible in all of six MSA-C patients in our Chinese cohort. This might be related to the higher sensitivity to detect nigrosome-1 in this thin-slice 3D scans (0.5 mm slice thickness) compared to 2D scans (1.2 mm slice thickness) used in previous study3. Besides, the difference in cohort may also lead to different results. In our study, the presence of nigrosome-1 showed great potential to differentiate MSA-C from PD, MSA-P and PSP in the Chinese cohort. Besides, the reduced distance between SN and RN might be associated with the severe degeneration of dorsal SN in PSP, which was corresponded to previous histological study4. The reduced volume of RN is also an important characteristic of PSP. MSA-P showed smaller volume and higher R2* value in putamen compared to PD, suggesting the distinct extent of putaminal atrophy and iron deposition in PD and MSA-P can be potentially useful for differentiation diagnosis.Conclusion
Using UHF MRI, preliminary results of this Chinese study demonstrated the anatomical changes and iron deposition in a Chinese Parkinson-plus syndromes cohort. The findings suggested that the presence of nigrosome-1, the volume of putamen and RN as well as the R2* value in putamen, SN and RN may provide novel neuroimaging biomarkers for differential diagnosis of PD, MSA-P, MSA-C and PSP. Future larger cohort studies will help to fully evaluate and understand these characteristics.Acknowledgements
We thank the Siemens Healthineers for providing technical support. We also thank all participants for their cooperation.References
1. Kwon DH, Kim JM, Oh SH, et al. Seven-Tesla magnetic resonance images of the substantia nigra in Parkinson disease. Annals of neurology. Feb 2012;71(2):267-77. doi:10.1002/ana.22592
2. Frosini D, Ceravolo R, Tosetti M, Bonuccelli U, Cosottini M. Nigral involvement in atypical parkinsonisms: evidence from a pilot study with ultra-high field MRI. Journal of neural transmission (Vienna, Austria : 1996). May 2016;123(5):509-13. doi:10.1007/s00702-016-1529-2
3. Kim JM, Jeong HJ, Bae YJ, et al. Loss of substantia nigra hyperintensity on 7 Tesla MRI of Parkinson's disease, multiple system atrophy, and progressive supranuclear palsy. Parkinsonism & related disorders. May 2016;26:47-54. doi:10.1016/j.parkreldis.2016.01.023
4. Kiyomitsu O, Kuniaki, T. , Mineo, Y. , Kenji, I. Substantia nigra in progressive supranuclear palsy, corticobasal degeneration, and parkinsonism dementia complex of Guam specific pathological features. J Neuropathol Exp Neurol. 2001;60
Figures