3055
Deep Learning with Anatomical Attention Mechanism for Distinguishing Parkinson’s Disease from Normal Controls in MR imaging1Shanghai Key Laboratory of Magnetic Resonance, East China Normal University, Shanghai, China, 2Department of Radiology, Ruijin Hospital, Shanghai Jiao Tong University School of Medicine, Shanghai, China, 3Philips Healthcare, Shanghai, China, 4Department of Biomedical Engineering, Wayne State University, Detroit, MI, United States
Synopsis
We proposed an automatic cascaded framework based on deep learning to segment deep brain nuclei and distinguish Parkinson’s disease from normal controls using quantitative susceptibility mapping (QSM) images. A 3D CA-Net model integrating channel attention, spatial attention and scale attention module was utilized to segment 5 brain nuclei from QSM and T1W data. Then, the QSM images and the segmented brain nuclei ROIs were fed into the SE-ResNeXt50 with anatomical attention mechanism to get the predicted PD probability. The proposed method provided good interpretability and achieved AUC values of 0.97 and 0.90 on training and testing cohort, respectively.
INTRODUCTION
Parkinson’s disease (PD) diagnosis is still challenging clinically. The iron distribution in deep brain nuclei as shown in quantitative susceptibility mapping (QSM) images could provide the pathophysiological related information underlying PD. The previous researches1 about PD diagnosis were not fully automatic and lacked interpretability. In recent years, different types of attention mechanism have been integrated into convolutional neural network and used in medical image applications2. Attention mechanism helps CNN model focus on the most relevant region in the feature maps while ignoring irrelevant background. Meanwhile, the use of anatomical prior information can improve the performance and interpretability of the model. So, in this study, we proposed an CNN-based automatic cascaded framework with multiple attention mechanisms to segment brain nuclei and distinguish PD from normal controls (NC) in QSM images.METHODS
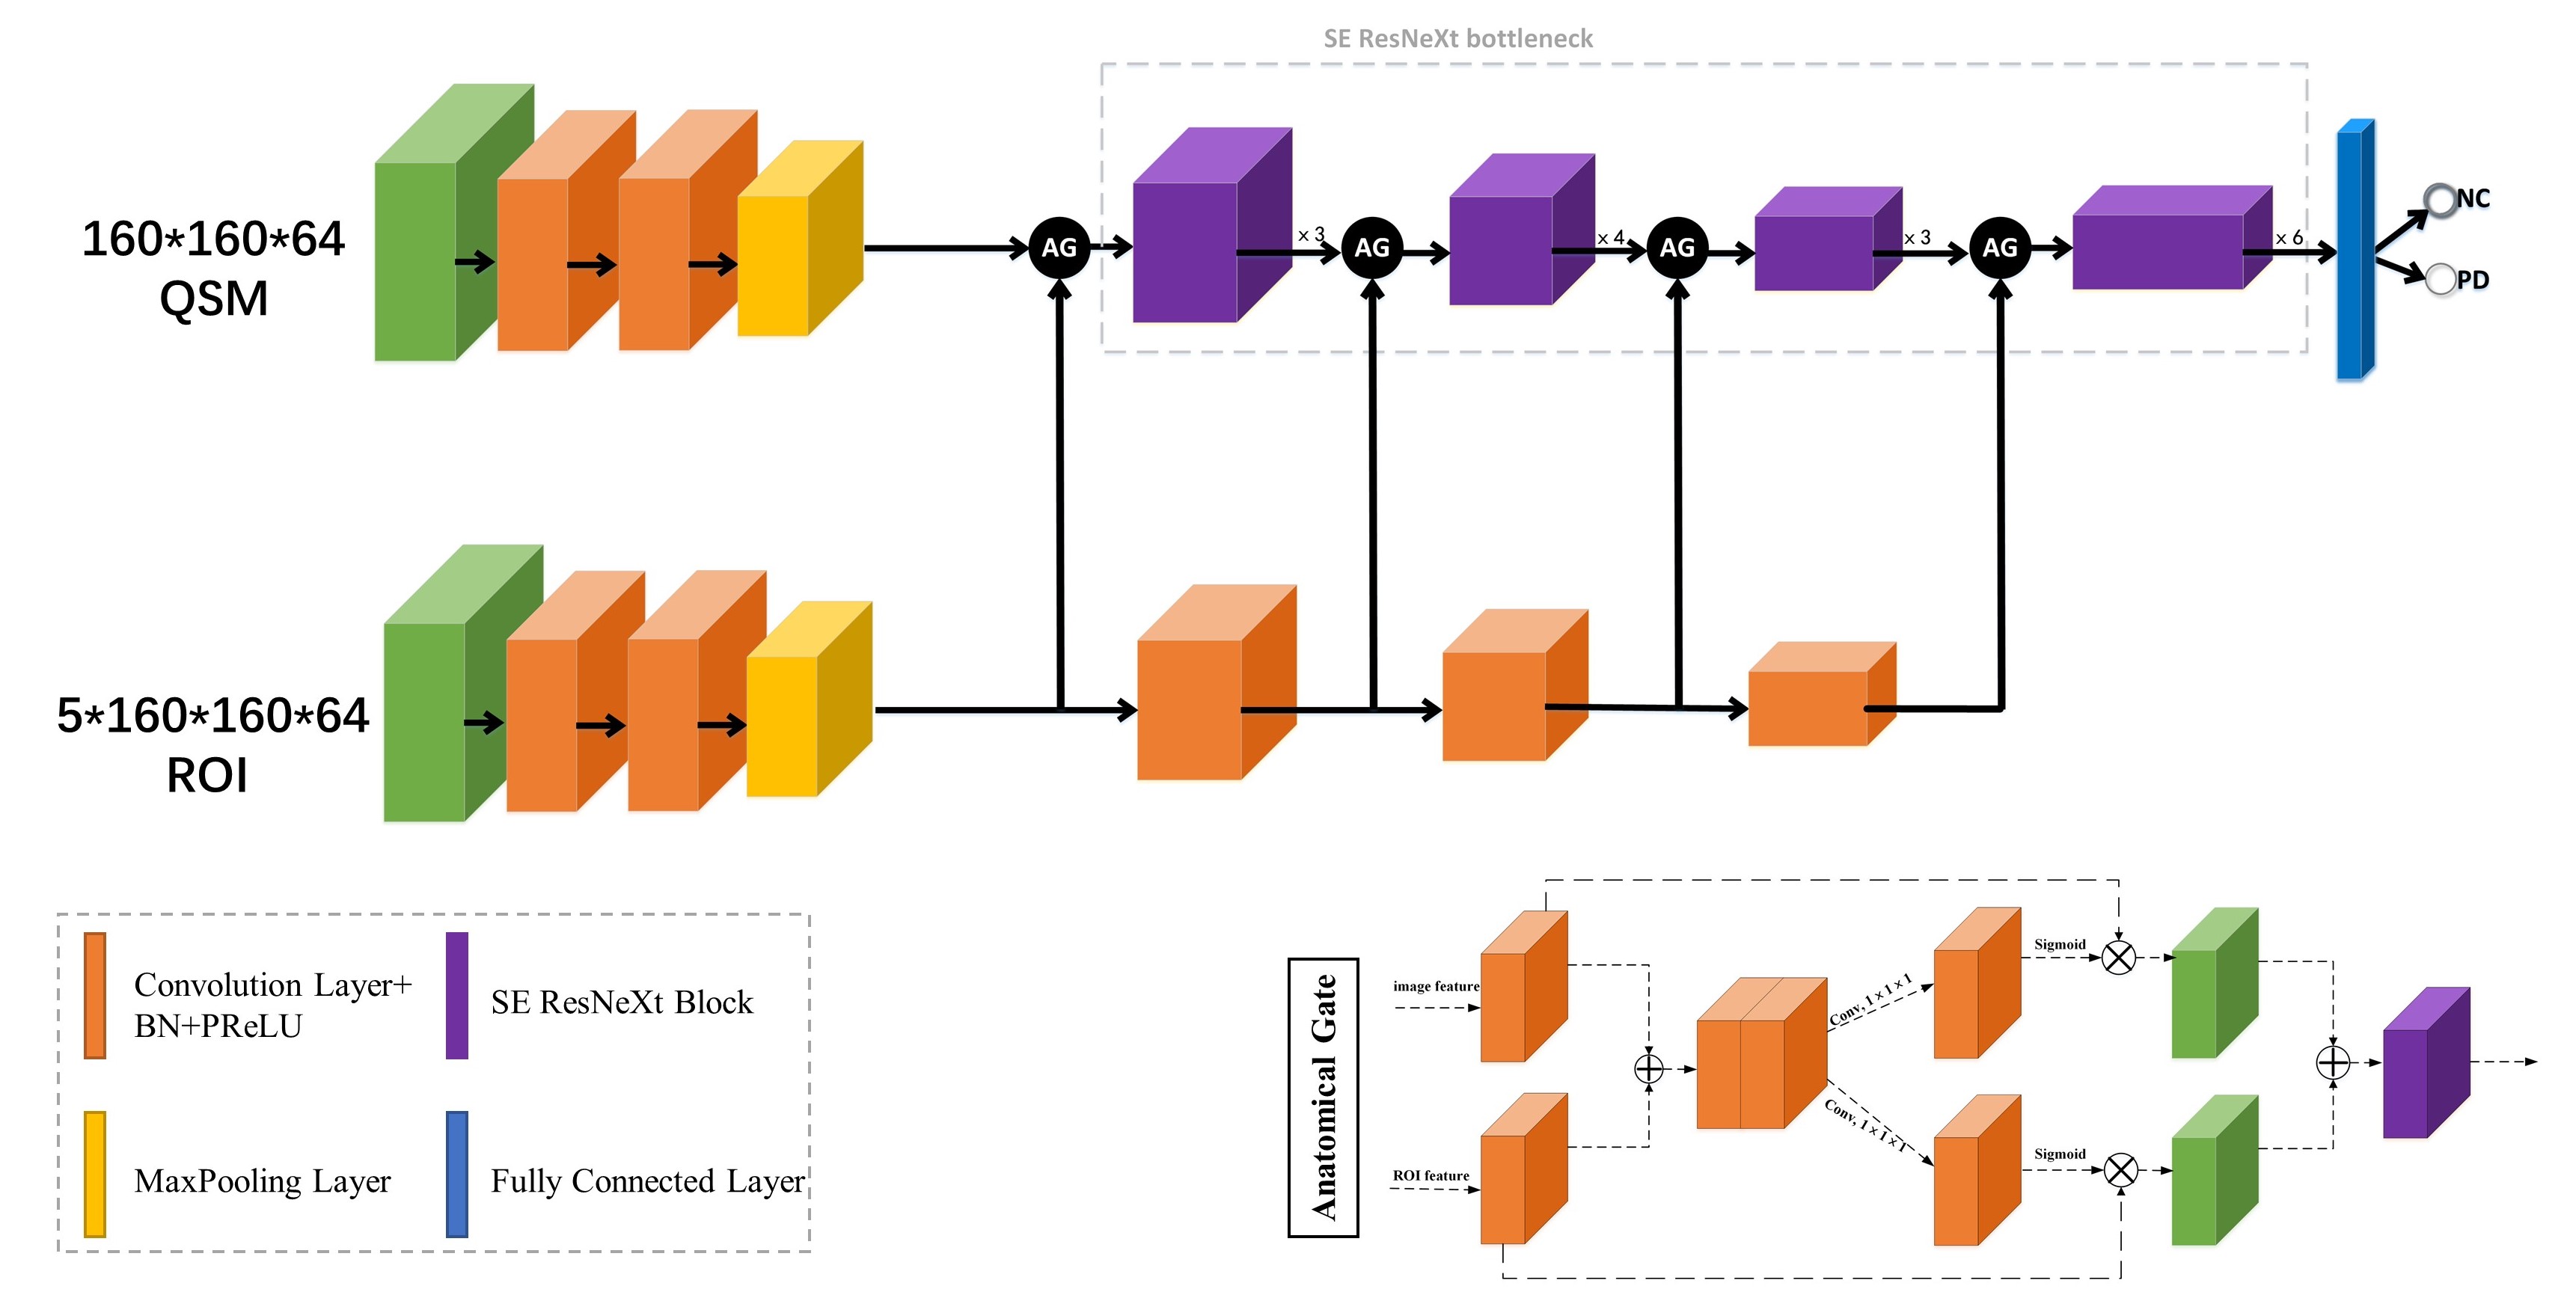
We prospectively recruited 92 PD patients and 287 NC from Ruijin Hospital. All of the subjects were scanned on Philips 3T scanner using a seven-echo 3D GRE sequence. The dataset was randomly split into training cohort (74 PD/230NC) and testing cohort (18 PD/57NC). The caudate nucleus (CN), globus pallidus (GP), putamen (PUT), red nucleus (RN), and substantia nigra (SN) in both hemispheres were manually delineated by a radiologist with 5 years of experience in neuroimage and used as the ground truth of the segmentation model. QSM and T1W images were cropped to 160ⅹ160ⅹ64 and normalized by z-score before input into CNN models. Brain nuclei exhibit clearer edges on QSM and T1W images, so QSM and T1W images were both fed into the segmentation model, namely 3D CA-Net model3, to simultaneously segment all the five nuclei. The SE-ResNeXt50 adopted in this work for PD diagnosis combined the ResNeXt504 and SE-Net5. The proposed deep model (shown in Fig.1) consists of SE-ResNeXt50 branch and anatomical attention branch with the cropped QSM images and corresponding segmented brain nuclei results as the input data to get the predicted result of PD disease. The anatomical gate (AG)6 was applied to fuse feature maps on channel dimension generated by two branches; then, the fused feature maps went through two parallel 1ⅹ1ⅹ1 convolutional layers followed by sigmoid layer to get the two weighted maps and multiplied with original feature maps; finally, the two weighted feature maps were added together to get the anatomical-guided feature maps. We used Adam as optimizer, with initial learning rate of 10-4 and batch size of 16 to minimize the focal loss7, and 5-fold cross validation in the training cohort was utilized for model training and selection. The model performance was evaluated with the independent testing cohort.RESULTS
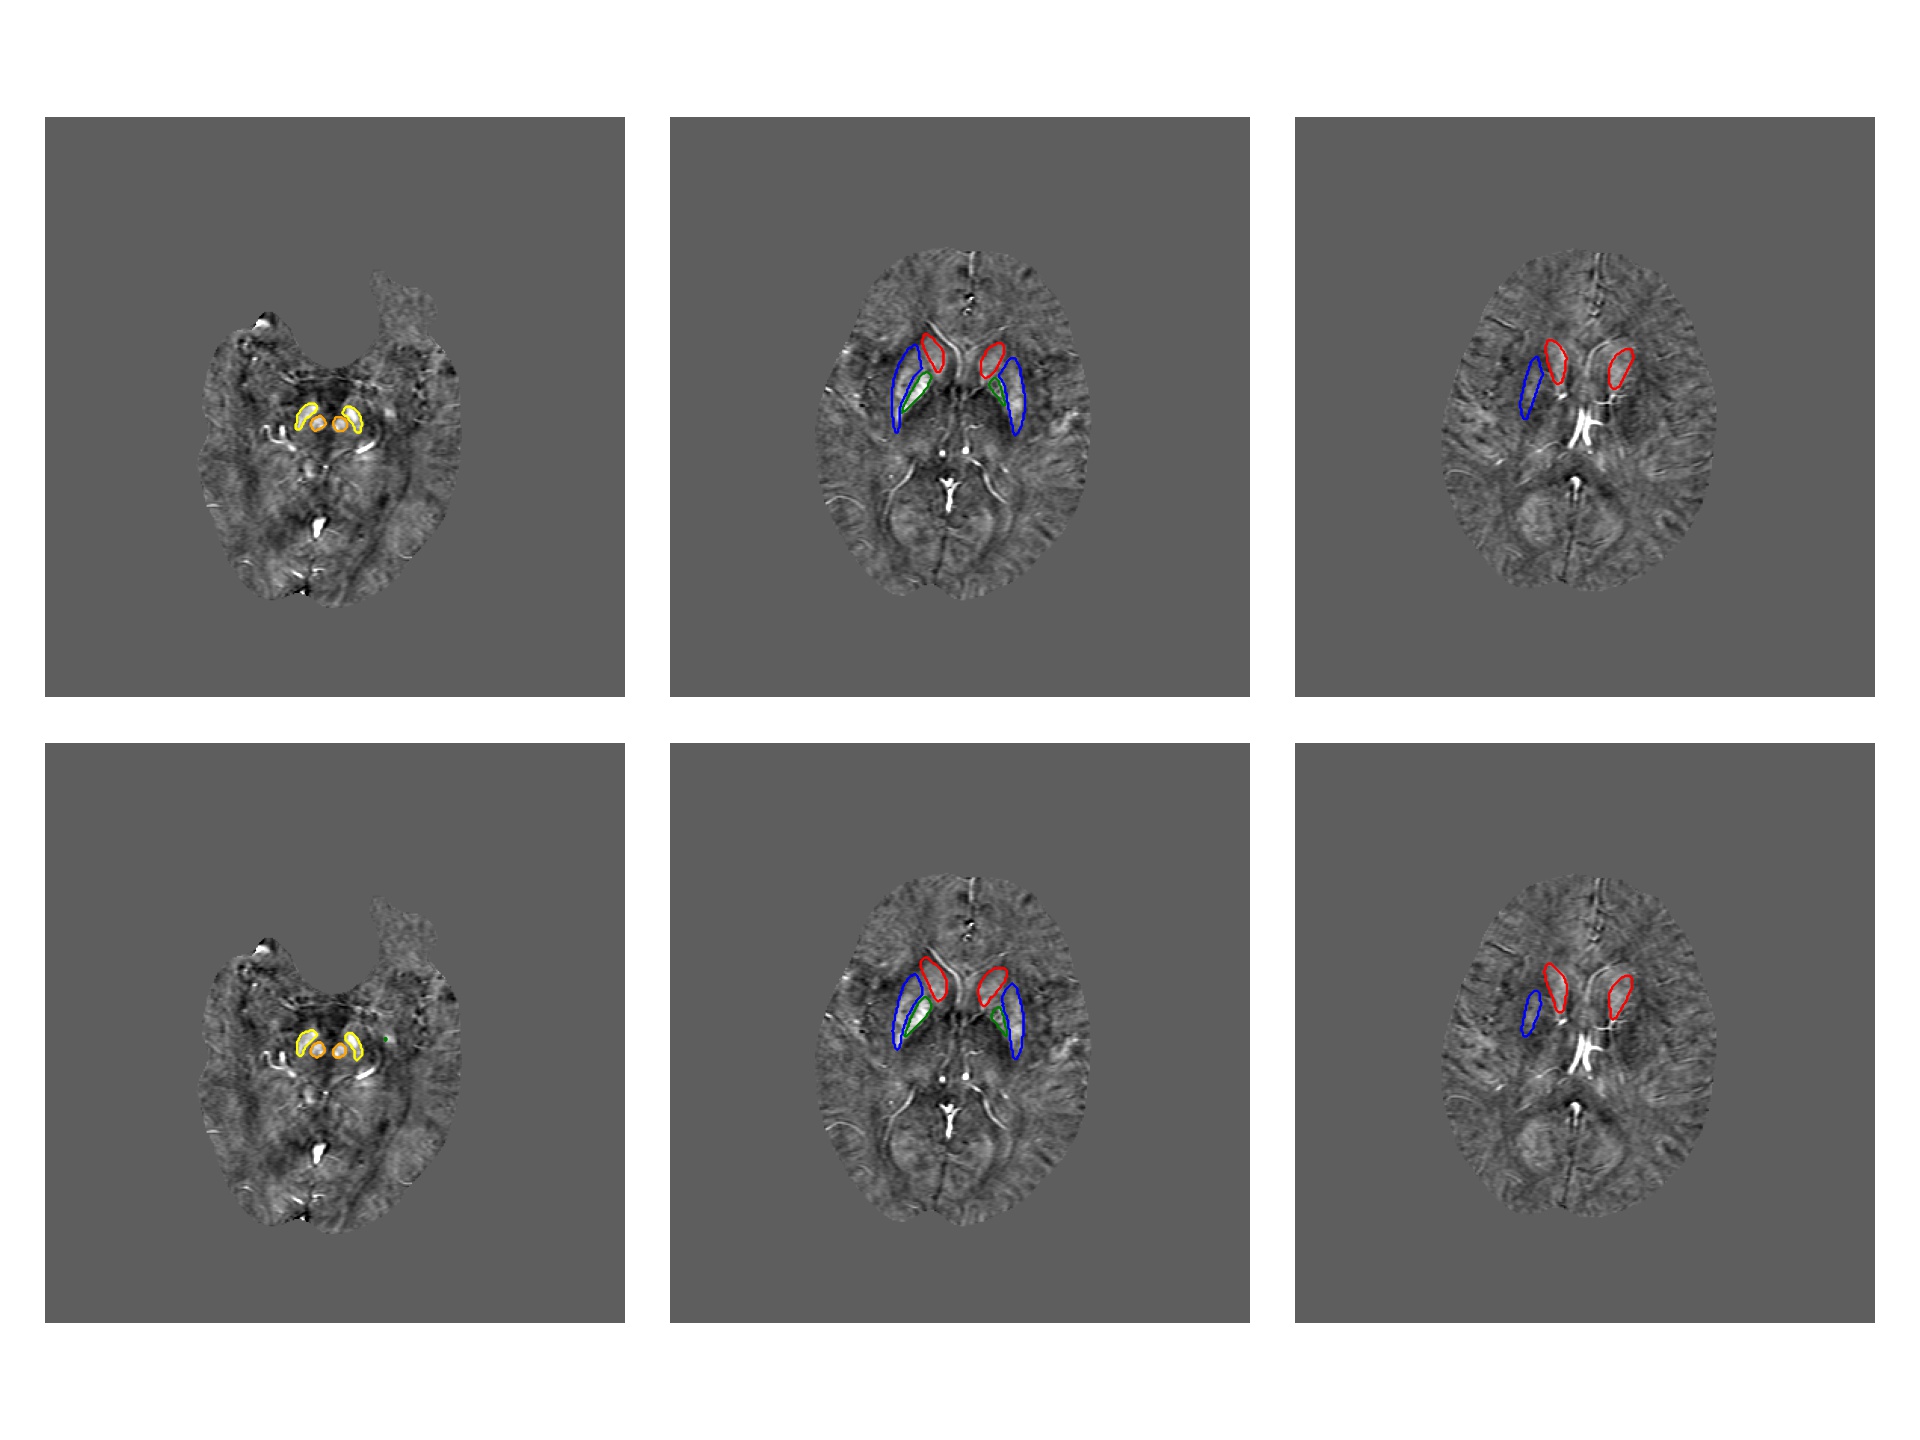
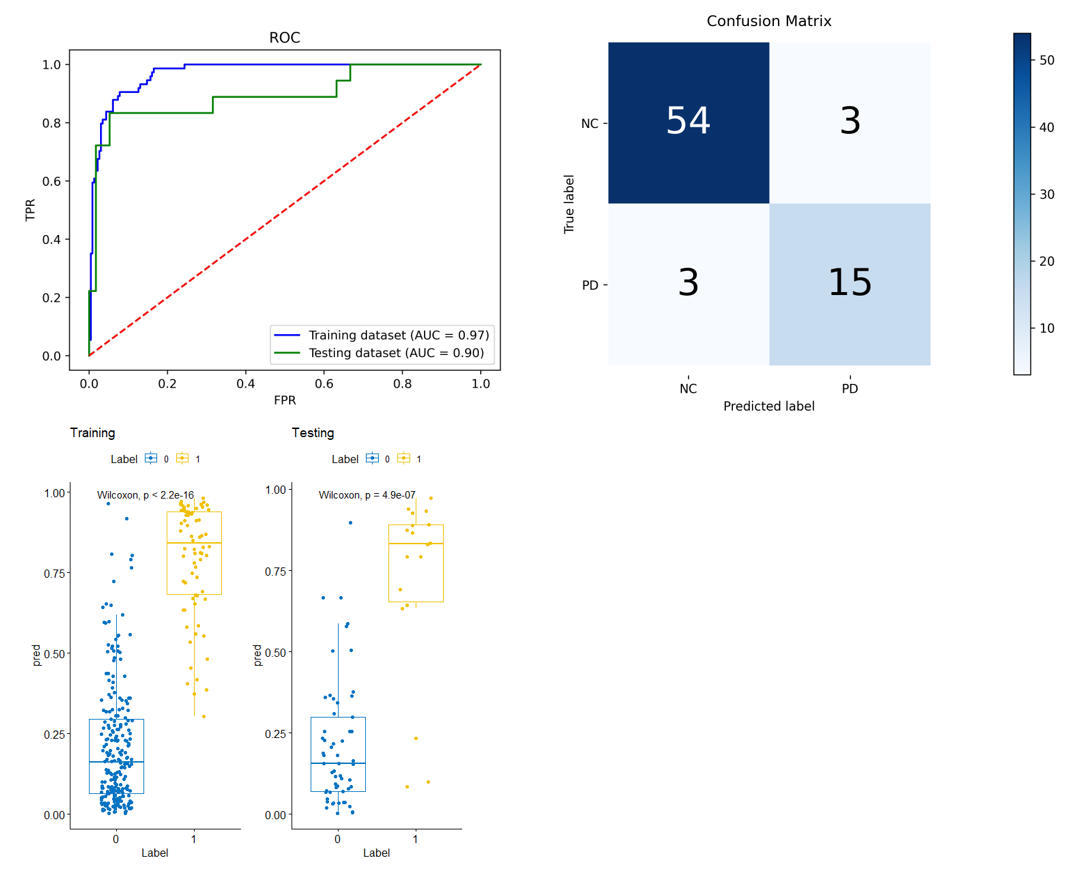
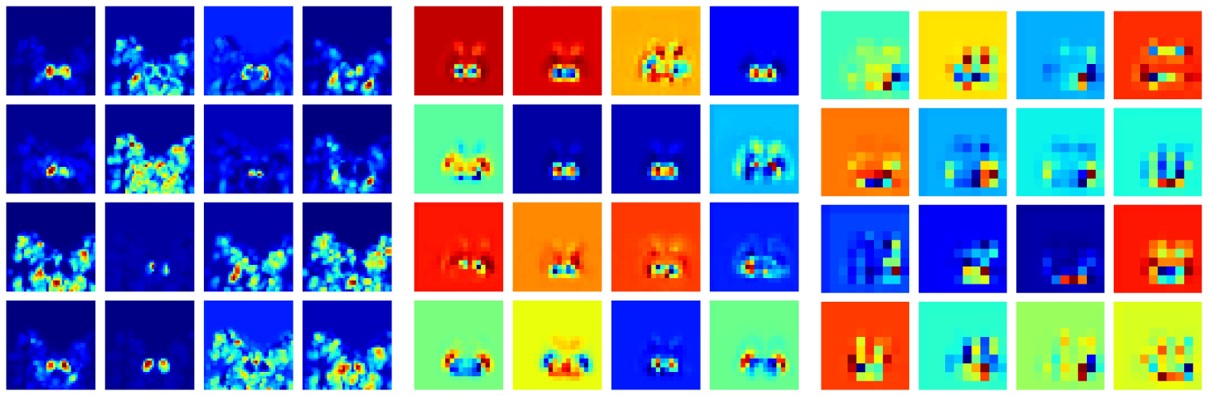
In the testing cohort, the trained CA-Net model achieved a mean Dice coefficient of 0.831 ± 0.071, 0.849 ± 0.037, 0.858 ± 0.034, 0.852 ± 0.041, and 0.831 ± 0.041 for CN, GP, PUT, RN, and SN regions, respectively. From the visual comparison in Fig.2, we can see that CA-Net could segment brain nuclei accurately and the resulted ROIs could be used as anatomical prior knowledge. The performance of the classification model was evaluated with the receiver operating characteristic (ROC) curve and confusion matrix (Fig.3). The probability distribution of the predicted results in the training and testing cohort was shown in Fig.3. The proposed method demonstrated promising performance with the AUC values of 0.97 and 0.90 on training and testing cohort, respectively. The diagnostic performance of classification model in PD and NC in the two cohorts was listed in Table 1. We randomly illustrated the feature maps in the model after three AG layers in the Fig.4 and the SN regions in the maps were highlighted.DISCUSSION AND CONCLUSION
In this study, we proposed an automatic deep learning model combined with anatomical prior information to distinguish PD from NC based on QSM and T1W images. CA-Net model integrated comprehensive attention modules, including spatial attention, channel attention and scale attention into U-Net to simultaneously and accurately segment five brain nuclei regions with various shape and scale. We treated segmented brain nuclei results as the anatomical prior knowledge and integrated it into a SE-ResNeXt50 model to realize accurate PD diagnosis. The anatomical attention mechanism could capture the structure information of brain nuclei from segmented regions and improve the classification performance. From the feature maps after AG layers, we can see that AG could make the model focus on the relevant SN region and suppress the irrelevant background. In conclusion, we proposed an approach which achieved superior performance of PD diagnosis and provided the potential to help clinicians to distinguish PD from NC based on QSM and T1W images with a high accuracy. In the future, we will integrate the model into a clinical software for multi-center validation and collect more data to refine the model.Acknowledgements
This project is supported by National Natural Science Foundation of China (61731009).References
1. Xiao B, He N, Wang Q, et al. Quantitative susceptibility mapping based hybrid feature extraction for diagnosis of Parkinson's disease. Neuroimage Clinal. 2019;24: 102070.
2. Niu Z, Zhong G, Yu H. A Review on the Attention Mechanism of Deep Learning. Neurocomputing. 2021; 452: 48-62.
3. Gu R, Wang G, Song T, Huang R, et al. CA-Net: Comprehensive Attention Convolutional Neural Networks for Explainable Medical Image Segmentation. IEEE Trans Med Imaging. 2021; 40(2):699-711.
4. Saining X, Ross Girshick, Piotr Dollar, et al. Aggregated Residual Transformations for Deep Neural Networks. Proceedings of the IEEE conference on computer vision and pattern recognition. 2017; 1492-1500.
5. Hu J, Shen L, Sun G, et al. Squeeze-and-excitation networks. Proceedings of the IEEE conference on computer vision and pattern recognition. 2018; 7132-7141.
6. Sun L, Shao W, Zhang D, et al. Anatomical Attention Guided Deep Networks for ROI Segmentation of Brain MR Images. IEEE Transactions on Medical Imaging, 2019; pp (99):1-1.
7. Lin T Y, Goyal P, Girshick R, et al. Focal Loss for Dense Object Detection. 2017 IEEE International Conference on Computer Vision (ICCV). 2017; 2999-3007.
Figures