3053
Whole-brain assessment of age-related brain characteristics using Quantitative Susceptibility Mapping and Diffusion Tensor Imaging1High Magnetic Field Laboratory, Hefei Institutes of Physical Science, Chinese Academy of Sciences, Hefei, China
Synopsis
Quantitative Susceptibility Mapping (QSM) can reveal the pathophysiological changes such as myelin, iron deposition, and tissue oxygenation. Diffusion Tensor Imaging (DTI) is an effective tool to assess the integrity of white matter. In our study, we performed whole-brain analysis of rat QSM and DTI using the recently reported SIGMA rat brain template (Nature Communication, 2019). The whole-brain segmentation demonstrated excellent performance. The derived parameters show high repeatability and are sensitive to age-related changes.
Quantitative Susceptibility Mapping (QSM) can reveal pathophysiology related changes in tissue myelin, iron, oxygenation and etc.1 Diffusion Tensor Imaging (DTI) is a useful tool for the assessment of white matter integrity.2 However, most previous work in rodent studies used manually delineated regions of interest (ROIs) for image analysis. Personal bias can not be avoided, and setting ROI manually for whole-brain is very time-consuming. In our study, we used the recently reported SIGMA rat brain template (Nature Communication, 2019) for the whole-brain analysis of QSM and DTI in rats.3 Repeatability was evaluated and different ages were compared to explore the age-related changes.
Materials and methods
MR scan
A total of twenty male Sprague-Dawley rats were used in this study (2 months: n=10; 8-9 months: n=10). MR scan was performed at 7.0 T Bruker system (PharmaScan 70/16 US) using a cross-coil configuration with a transmitter volume coil and a four-channel receiver rat-brain surface coil. Anesthesia was induced with 3-4% isoflurane and maintained during MRI with 1-3% isoflurane in 100% oxygen. Warm water was used to maintain body temperature. Rat’s respiration and body temperature were monitored during the scan.
DTI was acquired with spin-echo echo-planar imaging with the parameters: FOV=30×30 mm2, matrix=100×100, No. of slices=100, slice thickness=0.3 mm without gap, voxel size= 0.3 mm isotropic voxel, TE/TR=33.03/4268 ms, b=1000 s/mm2, 16 diffusion directions, No of segments=4, NA=4, scan time=23min55sec. 3D multi-echo gradient echo sequence (mGRE) was acquired for QSM calculation with the parameters: FOV=30×30×30 mm2, matrix=100×100×100, voxel size= 0.1×0.1×0.3 mm3,TR=80 ms, TE1=4ms, ΔTE=4.04 ms, 16 TEs, flip angle=20⁰, bipolar acquisition, NA=2, scan time=1h0min26sec.
Post-processing and image analysis
DTI dataset was analyzed in DSI studio. Motion correction was performed and Fractional anisotropy (FA) image was calculated. QSM was processed in Matlab (R2021b) including phase unwrap, background field remove and susceptibility calculation using Morphology Enabled Dipole Inversion (MEDI).4 Individual parametric image was coregistrated to one reference and segmented to SIGMA rat brain templates. The mean and median parametric values of each 3D brain region were extracted for whole-brain.
Statistics
All results are presented as mean±standard deviation (STD). Statistics was analyzed in Matlab. Normality was tested. Two samples t-test was used for normally distributed dataset, otherwise rank sum test was used. The coefficient of variance (CoV) was calculated to evaluate the repeatability. P<0.05 was considered as significant different.
Results
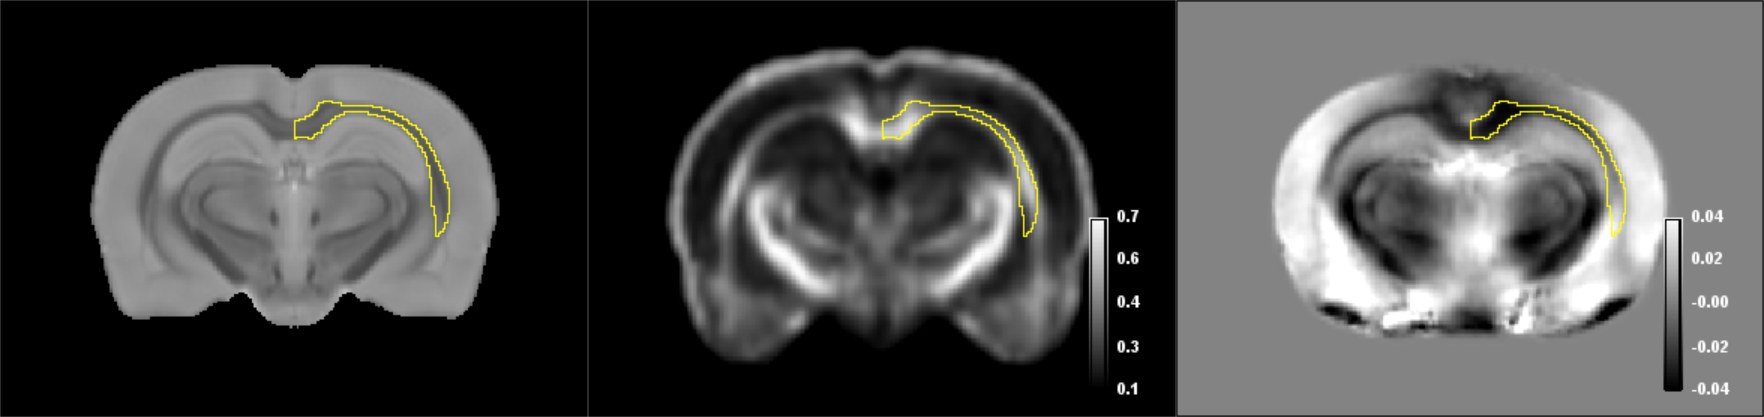
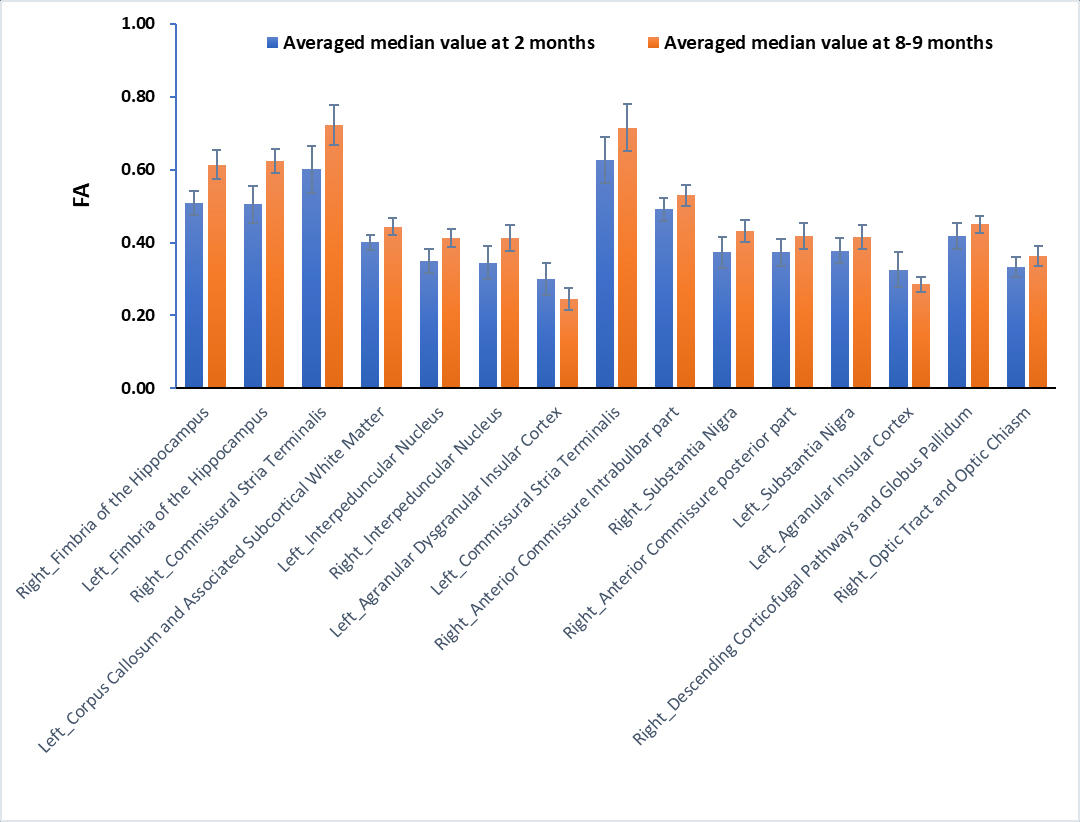
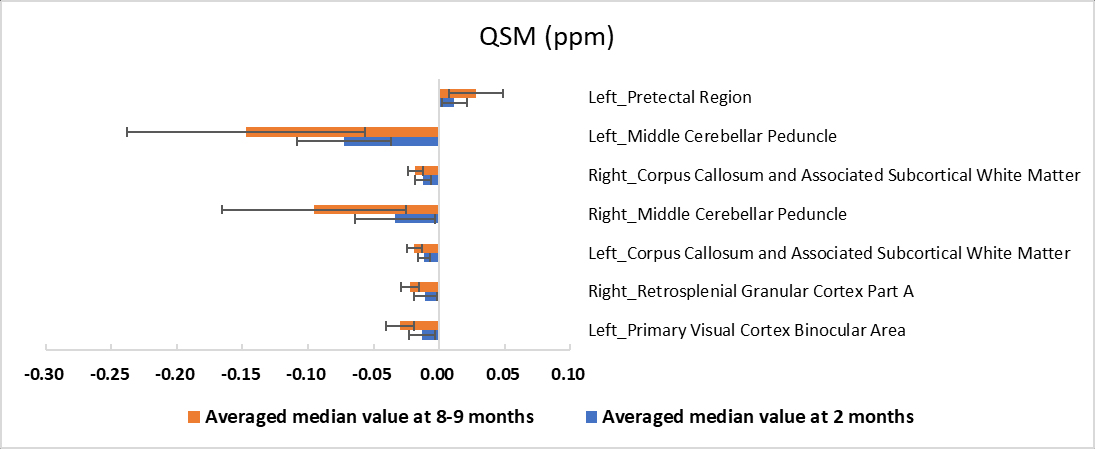
The SIGMA rat brain template and averaged FA/QSM with a representative ROI are shown in Fig1. A total of 230 bilateral brain regions are included in SIGMA rat brain template. The mean and median FA differed significantly in 15 brain regions with CoV less than 15% in both groups. As shown in Fig2, FA value declined with age in only Left Agranular Dysgranular Insular Cortex (0.30±0.04 vs. 0.25±0.03) and Left Agranular Insular Cortex (0.33±0.05 vs. 0.29±0.02), while increased in other brain regions. Seven brain regions showed significant different quantitative susceptibility between these two groups with CoV less than 100% in both groups (Fig3).
Discussion
In this study, SIGMA rat brain template was used for whole-brain analysis of QSM and DTI in rats of different ages. The segmentation demonstrated excellent performance on both averaged parametric maps and individual subject. In rats, 2 and 8-9 months correspond to adolescence and young adulthood, respectively. The increase of FA in white matter may be a manifestation of myelin maturation, while the decrease of FA in cortex may be due to the improved connection between the cell bodies of adjacent neurons. Similar to previous studies, the variance coefficient of quantitative susceptibility is significant. The derived QSM values are in the range of monkey brain at 9.4T. The change of QSM with ageing may be caused by iron deposition and/or changes in microstructure.5
Conclusion
The whole-brain analysis of QSM and FA using SIGMA rat brain template is automatic and the segmentation shows excellent performance. The derived parameters of brain regions are highly repeatable and sensitive, and can be used to detect age-related changes in brain characteristics.
Acknowledgements
This research was funded by the Collaborative Innovation Incubation Foundation of Hefei Science Center (Grant No. 2020HSC-CIP010).References
1. Haacke EM, Liu SF, Buch S, Zheng WL, Wu DM, Ye YQ. Quantitative susceptibility mapping: current status and future directions. Magnetic resonance imaging. 2015;33(1):1-25.
2. Le Bihan D, Mangin JF, Poupon C, et al. Diffusion tensor imaging: concepts and applications. Journal of magnetic resonance imaging : JMRI. 2001;13(4):534-546.
3. Barrière DA, Magalhães R, Novais A, et al. The SIGMA rat brain templates and atlases for multimodal MRI data analysis and visualization. Nature communications. 2019;10(1):5699.
4. de Rochefort L, Liu T, Kressler B, et al. Quantitative Susceptibility Map Reconstruction from MR Phase Data Using Bayesian Regularization: Validation and Application to Brain Imaging. Magn Reson Med. 2010;63(1):194-206.
5. Wen Q, Yang H, Li J, et al. Ultra-High-Resolution in vitro MRI Study of Age-Related Brain Subcortical Susceptibility Alteration in Rhesus Monkeys at 9.4 T. Frontiers in aging neuroscience. 2020;12:259.
Figures