3052
Conversion map from quantitative parameter mapping to myelin water fraction
Shun Kitano1, Yuki Kanazawa2, Masafumi Harada2, Yo Taniguchi3, Yuki Matsumoto2, Hiroaki Hayashi4, Kosuke Ito3, Yoshitaka Bito3, and Akihiro Haga2
1Graduate of Health Science, Tokushima University, Tokushima, Japan, 2Graduate School of Biomedical Sciences, Tokushima University, Tokushima, Japan, 3FUJIFILM Healthcare Corporation, Tokyo, Japan, 4College of Medical, Pharmaceutical and Health Sciences, Kanazawa University, Kanazawa, Japan
1Graduate of Health Science, Tokushima University, Tokushima, Japan, 2Graduate School of Biomedical Sciences, Tokushima University, Tokushima, Japan, 3FUJIFILM Healthcare Corporation, Tokyo, Japan, 4College of Medical, Pharmaceutical and Health Sciences, Kanazawa University, Kanazawa, Japan
Synopsis
We determined MWF derived from QPM-relaxation parameters using quadratic polynomial approximation. Two types of myelin imaging were generated; MWF derived from multi-echo gradient-echo and R1·R2* map derived from QPM, which were standardized from twelve healthy volunteers to MNI. As a result, the relationship between MWF and R1·R2* values on the white matter region strongly correlated with a quadratic polynomial approximation (R2 = 0.991). Using acquired quadratic polynomial approximation, the R1·R2* map was converted to MWF. Our MWF map derived from QPM can dramatically improve image quality when compared to the general MWF.
Introduction
Recently, it has been regarded as important to derive Myelin Water Fraction (MWF) calculated from magnetic resonance imaging (MRI) data to delineate myelin water content for diagnosing diseases such as multiple white matter sclerosis. The acquisition scan time for MWF imaging when using the multi-echo gradient-echo (mGRE) sequence can be shorter than that using the spin-echo (SE) sequence 1. On the other hand, when applying the mGRE sequence with long echo time (TE), it often becomes a problem in which signal decrease occurs due to the effects of B0 inhomogeneity and/or magnetic susceptibility 2, 3. In our previous studies, we reported the development of a myelin weighted image derived from quantitative parameter mapping (QPM) 4, 5. The purpose of this study was to determine MWF using QPM-relaxation parameters using quadratic polynomial approximation.Methods
On a 3 Tesla MR scanner system (FUJIFILM Healthcare Corp.), QPM-MRI was performed on twelve healthy volunteers (seven men, five women; ages, 21-54 years; mean age, 35.2 years) using three-dimensional partially radio frequency-spoiled steady state gradient-echo (3D-RSSG) methods. The imaging parameters were TEs 4.6-36.8 ms (ΔTE, 4.6 ms); repetition times, 10-41.1 ms; flip angles 10 and 40 degrees. After QPM post processing [i.e., estimation of T1, T2, Proton Density (PD), and B1 were generated from the 3D-RSSG dataset], the QPM-relaxation rates R1 and R2 were derived. After acquiring QPM datasets, myelin maps using R1 and R2* based on the T1-weighted/T2-weighted (T1 w/T2w) ratio method 5 as$$\frac{T_{1}w}{T_{2}w}\approx\frac{\frac{1}{T_{1}}PD}{\frac{1}{T_{2}^{*}}PD}=\frac{R_{1}}{\frac{1}{R_{2}^{*}}}=R_{1}\cdot R_{2}^{*},$$
where T1, T2 and are relaxation times, and PD is proton density of specific tissue. Signals of T1w and T2w images are derived from each relation: $$${T_{1}w}\approx{\frac{1}{T_{1}}PD},{T_{2}w}\approx{T_{2}PD}\approx{T_{2}^{*}PD}.$$$ Figure 1 shows the process of two types of myelin imaging and MWF derived from 3D-RSSG for QPM. In the calculation process of MWF, after performing B1 correction on the multi-echo 3D-RSSG dataset (e.g., TE, 4.6-36.8 ms; TR, 41.1 ms; FA, 40 degrees) with QPM, rigid and non-rigid transformations were performed, and standardized to the shape of the MNI152 brain using FSL software. In addition, fitting by non-negative least squares (NNLS) was performed using bi-exponential fitting model (i.e., two-pool model) as$$S(t)=A_{short}\exp(-\frac{TE}{T_{2,short}^{*}})+A_{long}\exp(-\frac{TE}{T_{2,long}^{*}}),$$
where S is the signal of each TE, A is amplitude, and T2* is T2*relaxation time. After performing the fitting analysis of the measured decay signals, MWF was calculated as
$$MWF=\frac{A_{short}}{A_{short}+A_{long}}.$$
Additionally, the determined R1·R2* map was standardized in the same way. Volume-Of-Interest (VOI) analysis using JHU-white matter (WM) atlas was performed on the data averaged from MWF and R1·R2*. All the data in the 48 regions measured by VOI and the data in each region of anterior corona radiata (ACR), genu of corpus callosum (GCC), cerebral peduncle (CP) and posterior corona radiata (PTR) were plotted, and quadratic polynomial approximation was performed to obtain the coefficient of determination. Finally, using acquired quadratic polynomial approximation, the R1·R2* map was converted to MWF, i.e., MWFQPM.
Results
Table 1 summarizes mean measured MWF and R1·R2* values for each region. Figure 2 shows scatter plots for demonstrating correlations between R1·R2* and MWF values for all and some represented white matter VOIs. Their relationship in all WM regions had a strong correlation with a quadratic polynomial approximation (R2 = 0.991). Figure 3 shows MWF, R1·R2* and MWFQPM maps standardized from twelve healthy volunteers to MNI. Figure 4 shows MWFQPM maps of two volunteers (men, ages, 21 and 54 years) converted from R1·R2* using a obtained regression curve.Discussion
We focused only on the WM region using JHU-White matter atlas in this study. When using a quadratic polynomial equation, the relationship between R1·R2* and MWF had a strong significant correlation for not only all but also each region of WM (Fig. 2). These results may be useful in future attempts to combine multiple regions.Conclusion
We found that the relationship between R1·R2* and MWF has a strong correlation when using quadratic polynomial approximation. MWF map derived from QPM can dramatically improve image quality when compared to the mGRE-MWF map.Acknowledgements
No acknowledgement found.References
- Hwang D, Kim DH, Du YP. In vivo multi-slice mapping of myelin water content using T2* decay. Neuroimage. 2010;52(1):198-204.
- Alonso-Ortiz E, Levesque IR, Paquin R, Pike GB. Field inhomogeneity correction for gradient echo myelin water fraction imaging. Magn Reson Med. 2017;78(1):49-57.
- Lee H, Nam Y, Kim DH. Echo time-range effects on gradient-echo based myelin water fraction mapping at 3T. Magn Reson Med. 2019;81(4):2799-2807.
- Kanazawa Y, Harada M, Taniguchi Y, et al. Myelin imaging derived from quantitative parameter mapping, Proc. ISMRM 2019;27:3313.
- Kanazawa Y, Harada M, Taniguchi Y, et al. Myelin imaging derived quantitative parameter mapping compared to myelin water fraction, Proc. ISMRM 2021; 29:2828.
Figures
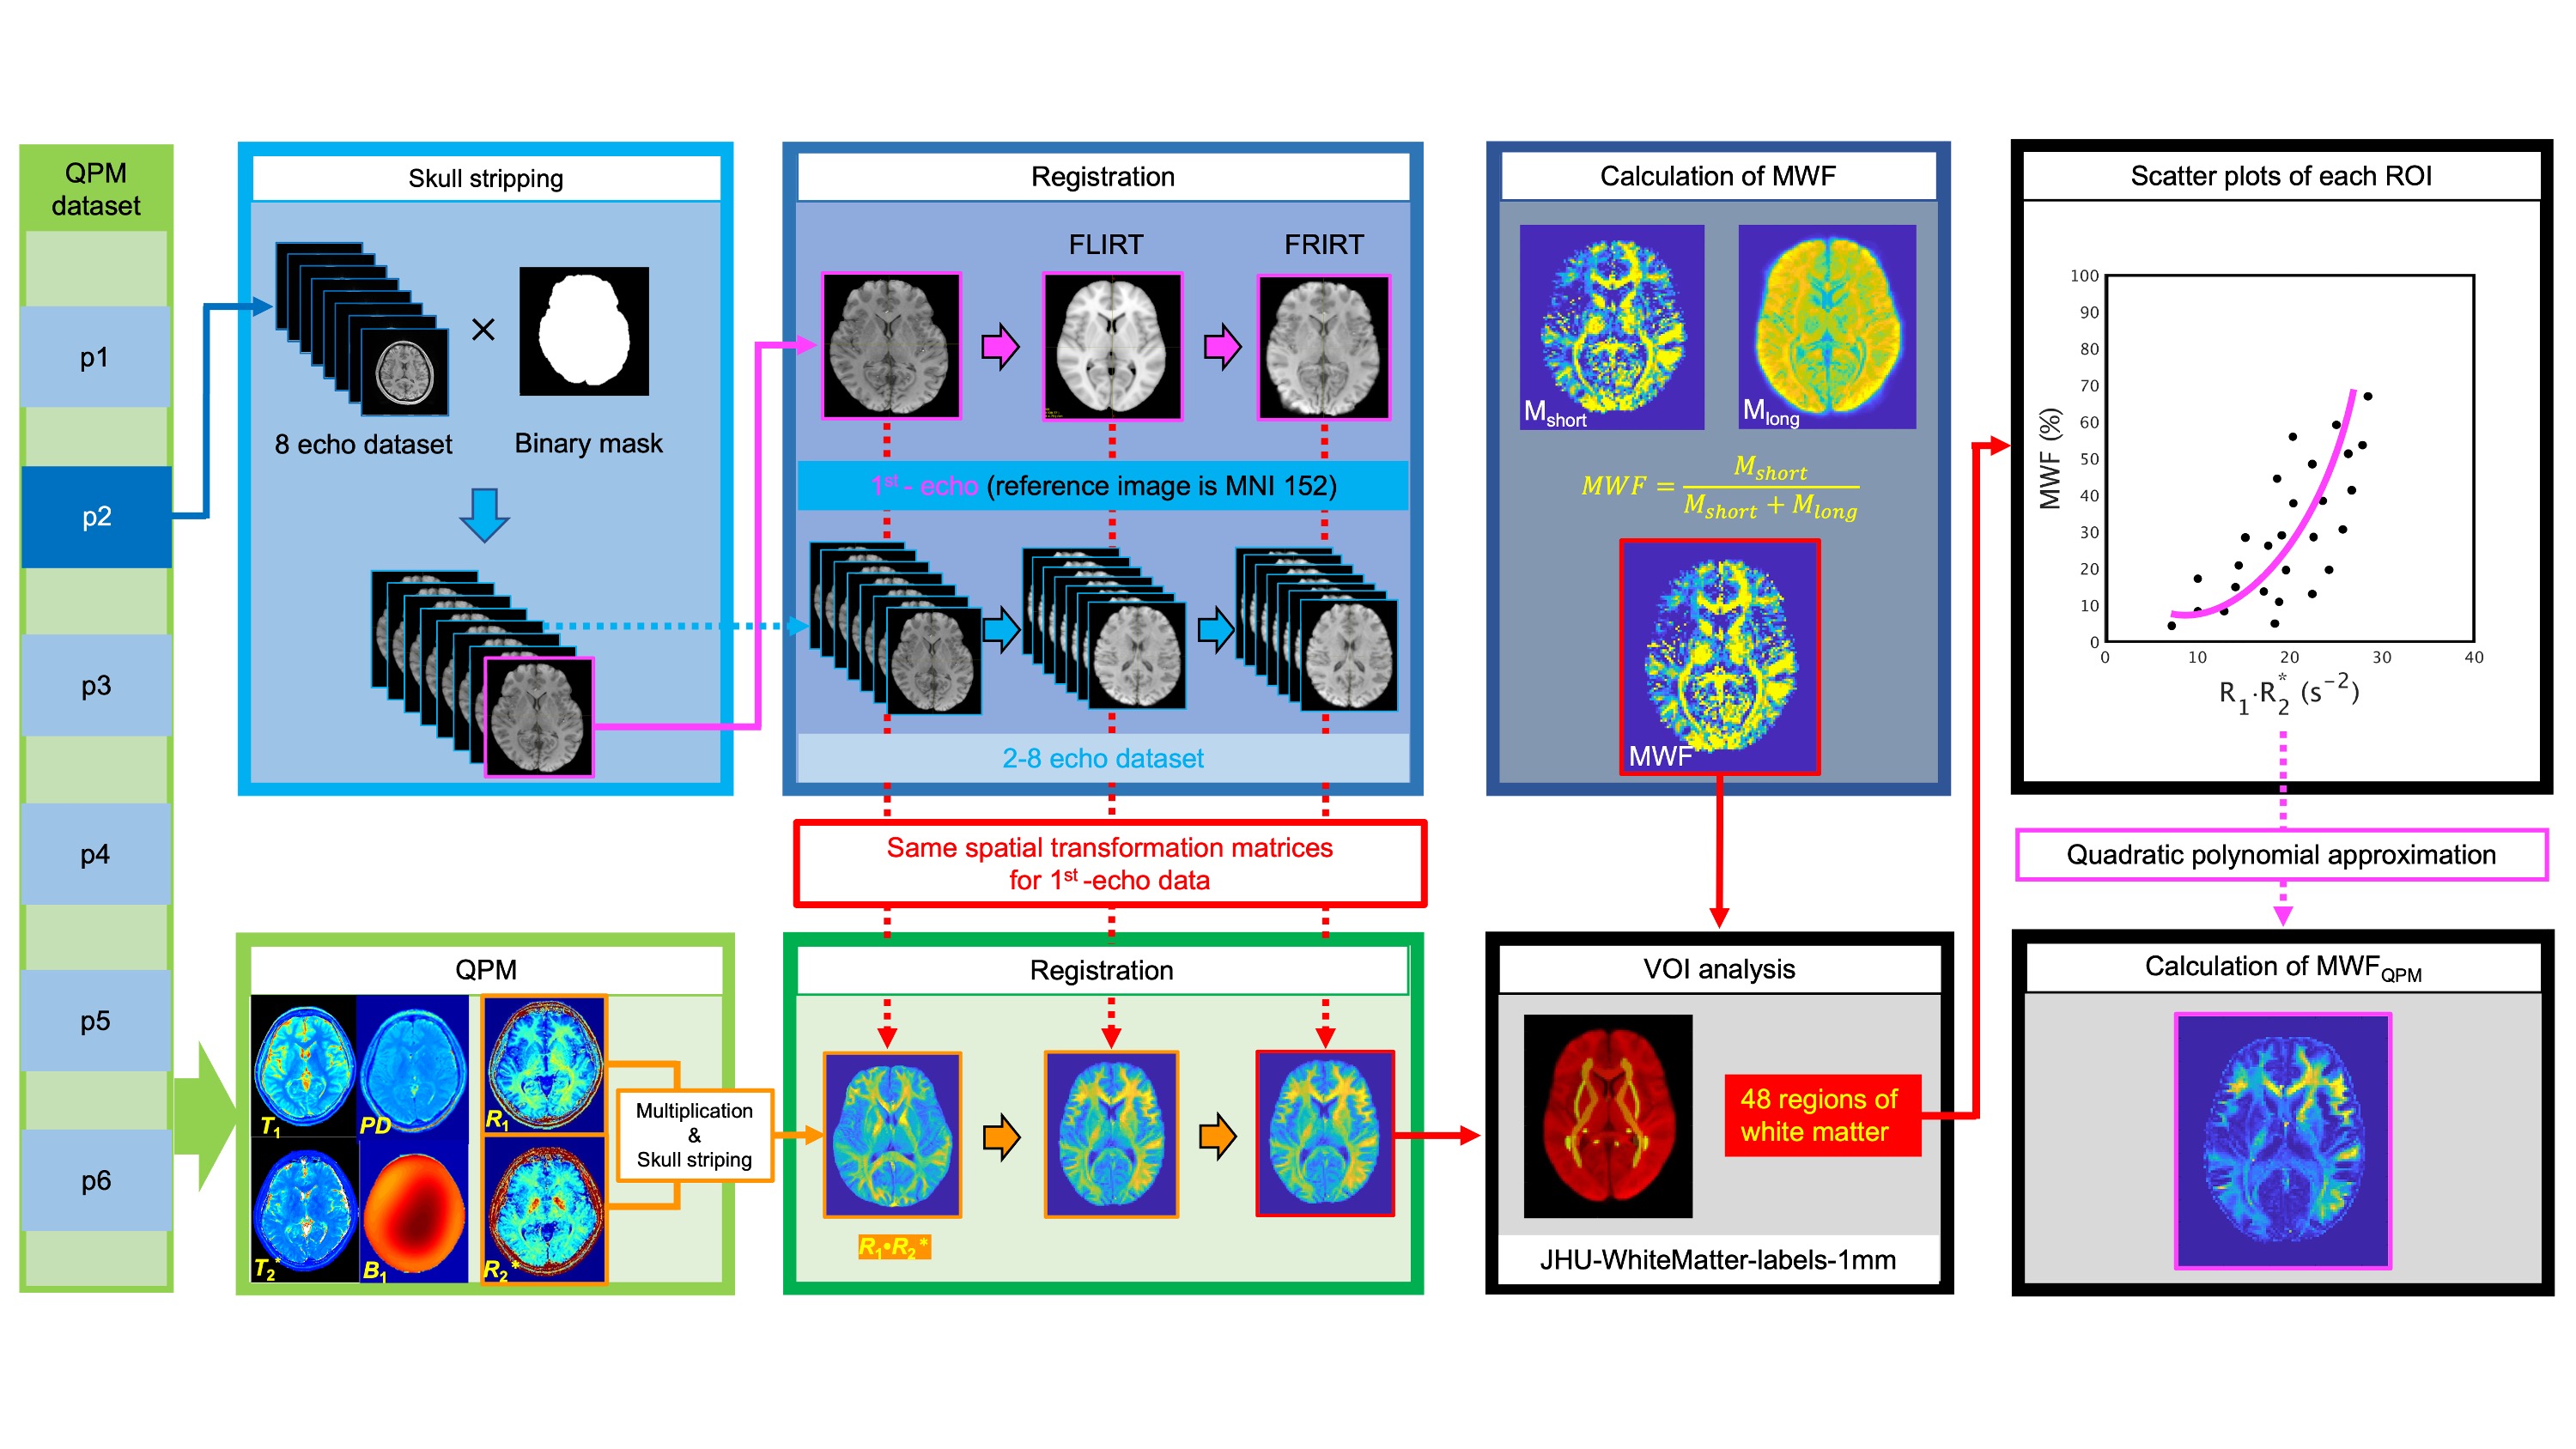
Figure 1 A schematic diagram of the procedure to convert from R1·R2* to MWF. Each data was calculated from 3D-RSSG dataset for QPM; R1·R2* data, and MWF multi-echo 3D-RSSG data of p2. Before calculating MWF, spatial normalization was applied to the dataset. Then, it was applied to R1·R2* map using the same spatial transformation matrices of the MWF dataset.
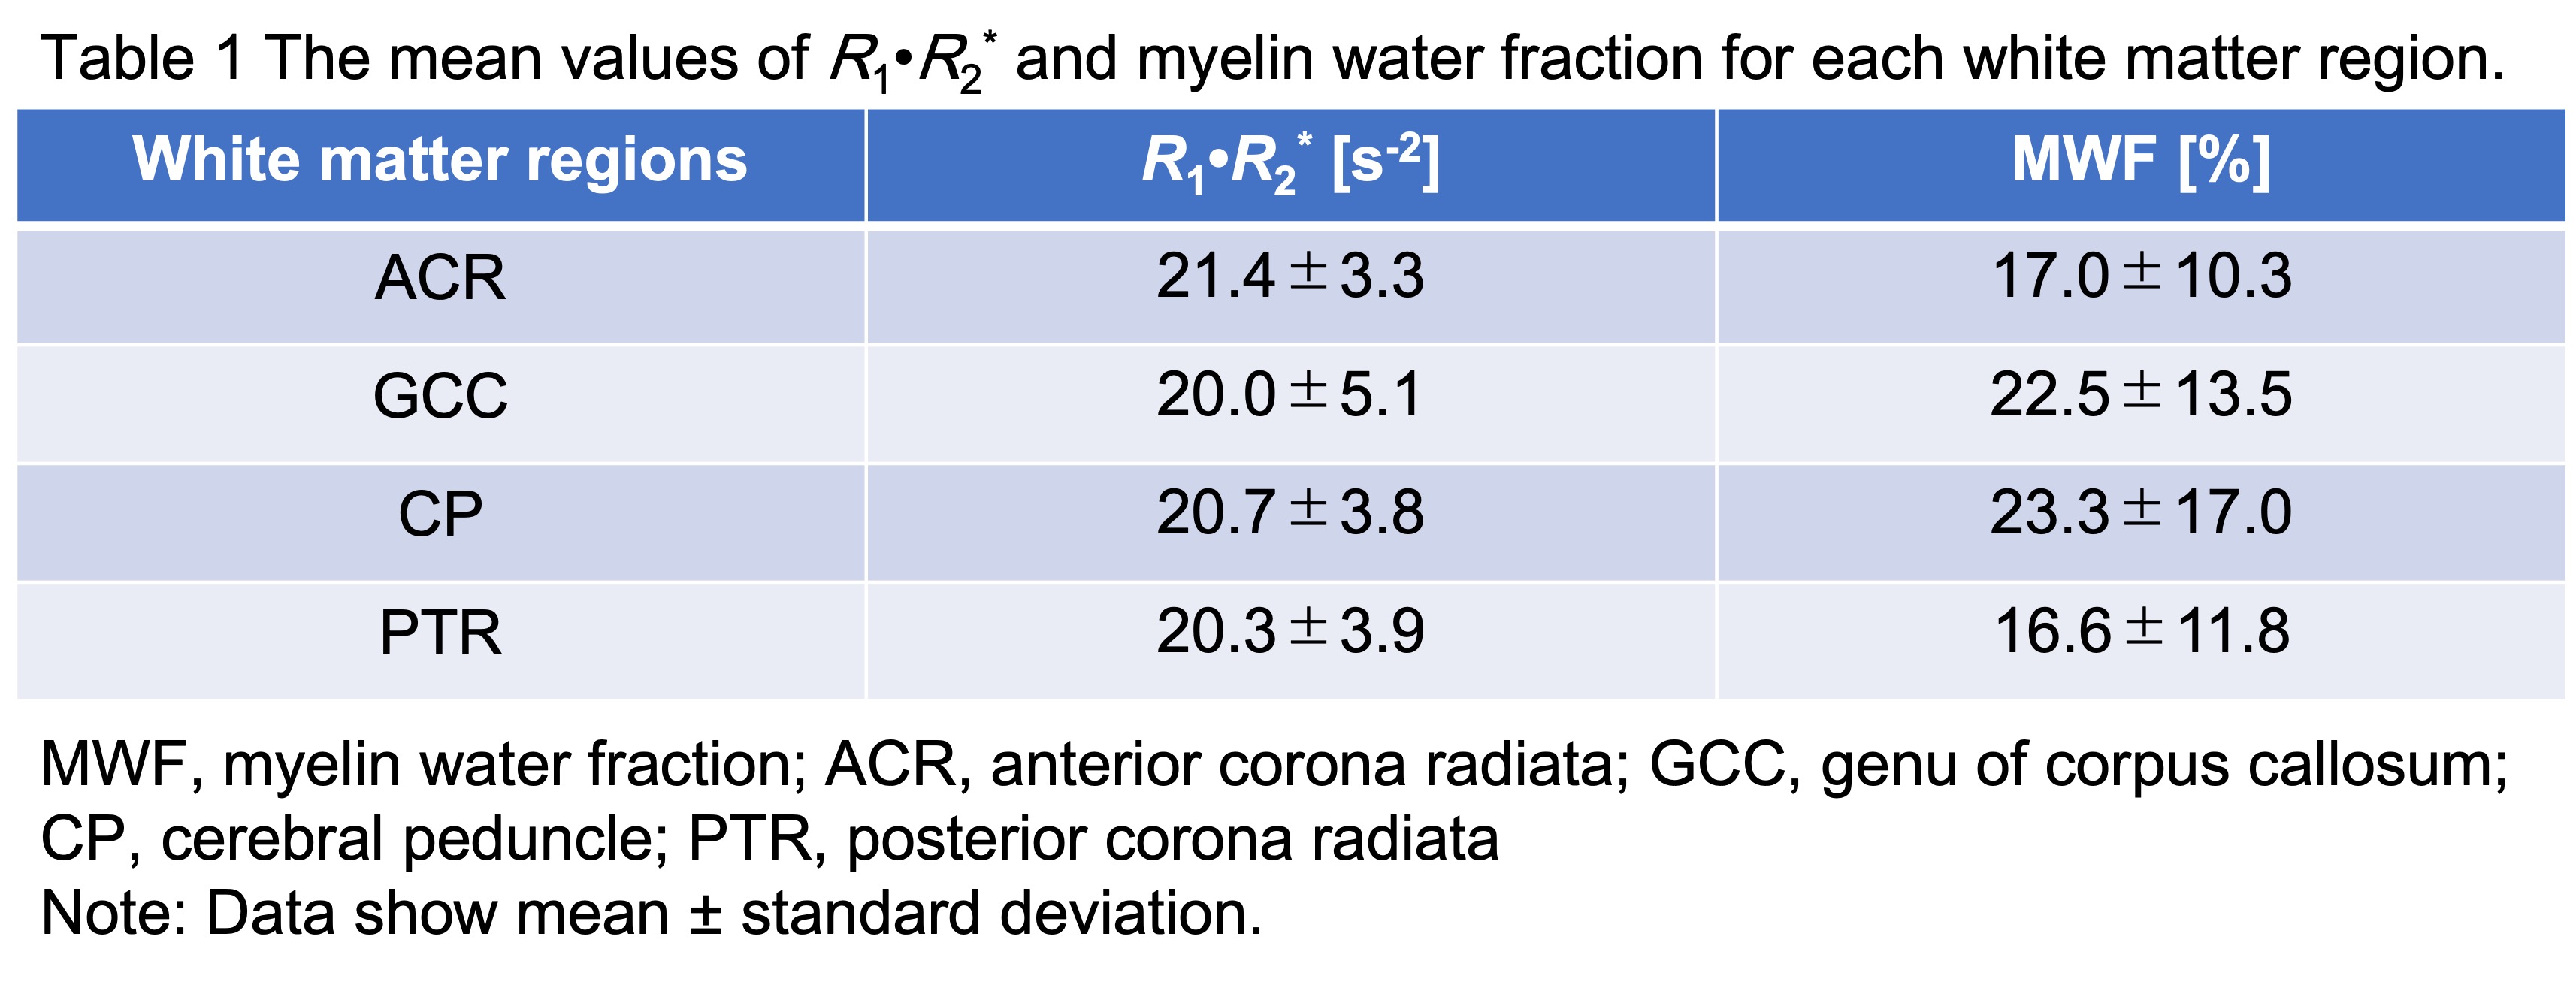
Table 1 The mean measurement values of R1·R2* and myelin water fraction for each white matter region.

Figure 2 Scatter plots of the relationship between R1·R2* and MWF values for represented white matter regions. (a) all 48 regions of JHU WM (b) ACR (c) CP (d) GCC and (e) PTR. The Red line shows an approximate curve of quadratic polynomial equations, and magenta dashed lines show a 95% confidence interval. A significant correlation between R1·R2* and MWF values was found.
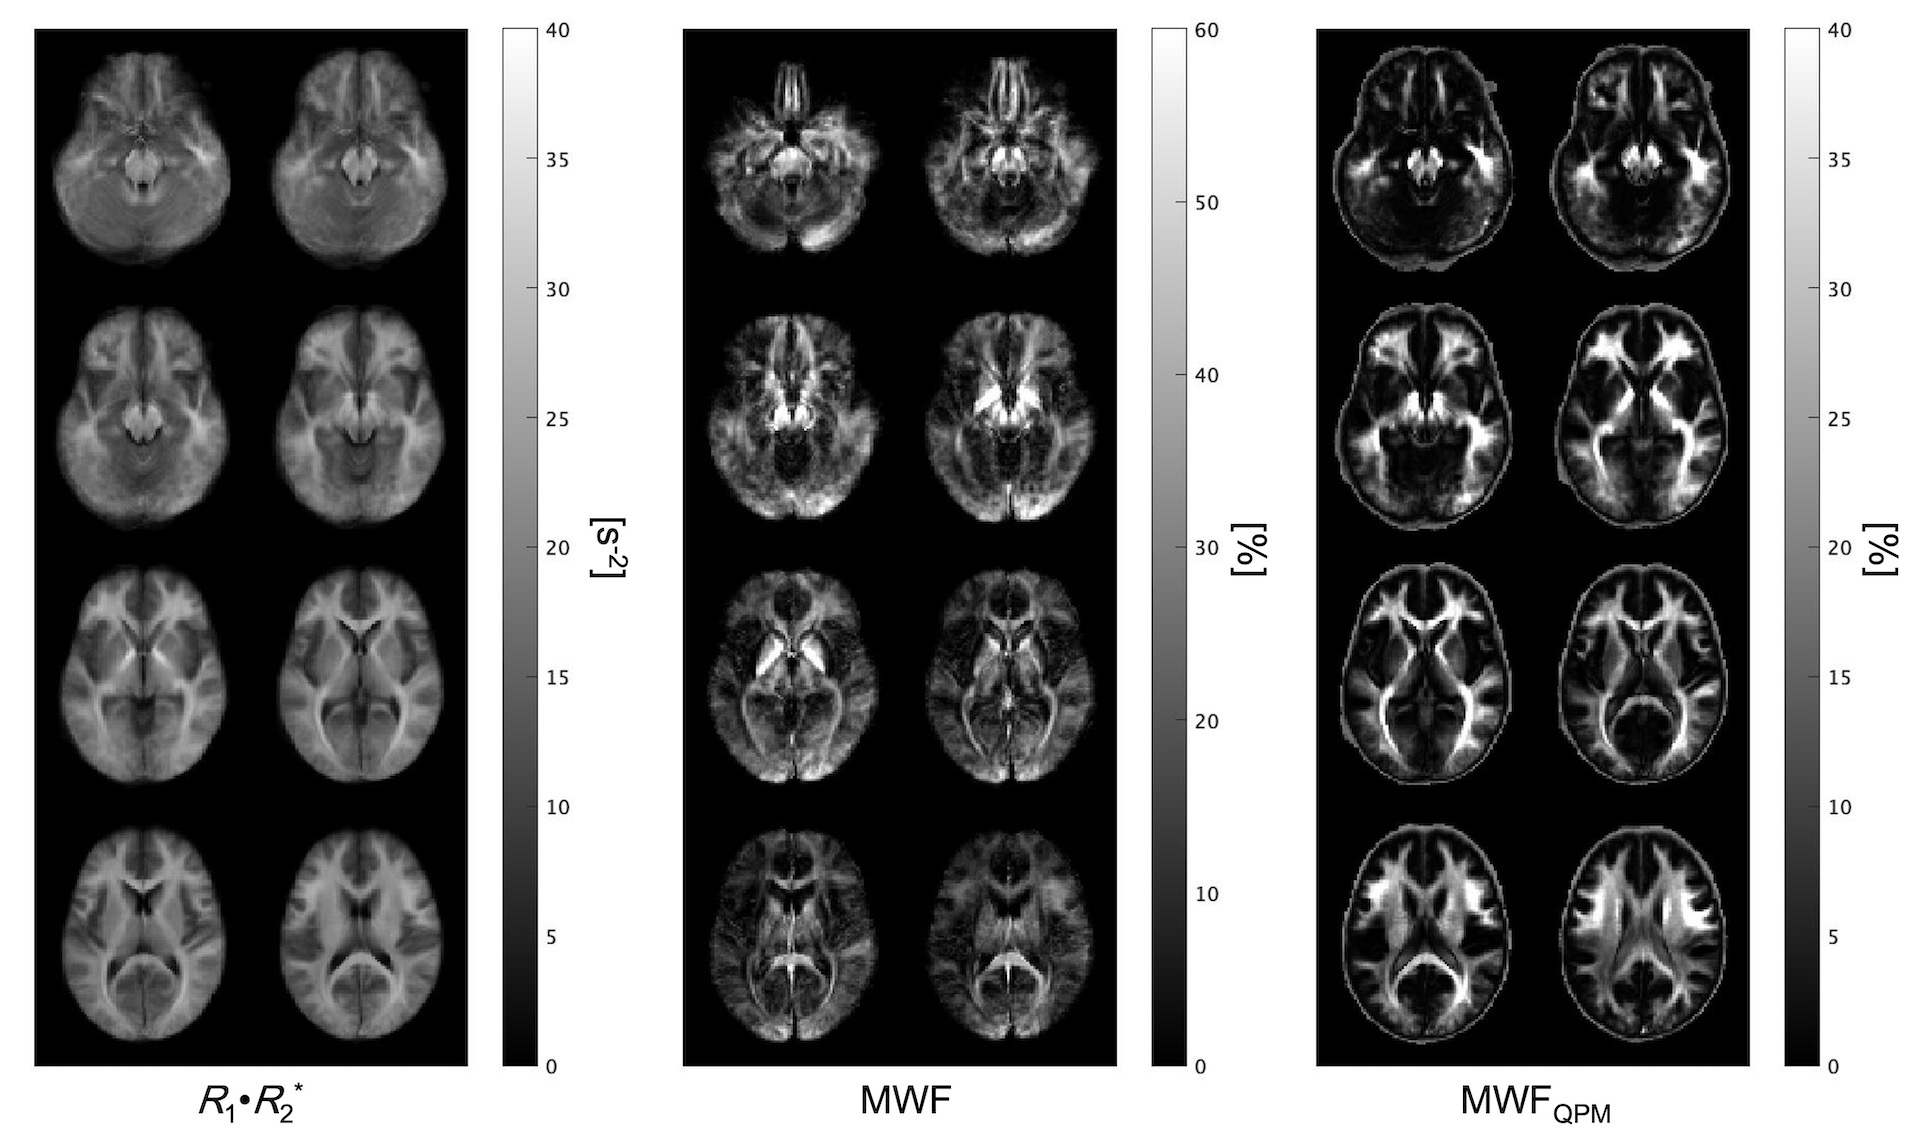
Figure 3 Each myelin map standardized from twelve healthy volunteers to a MNI space. From left to right, MWF, R1·R2* and MWFQPM maps are presented.
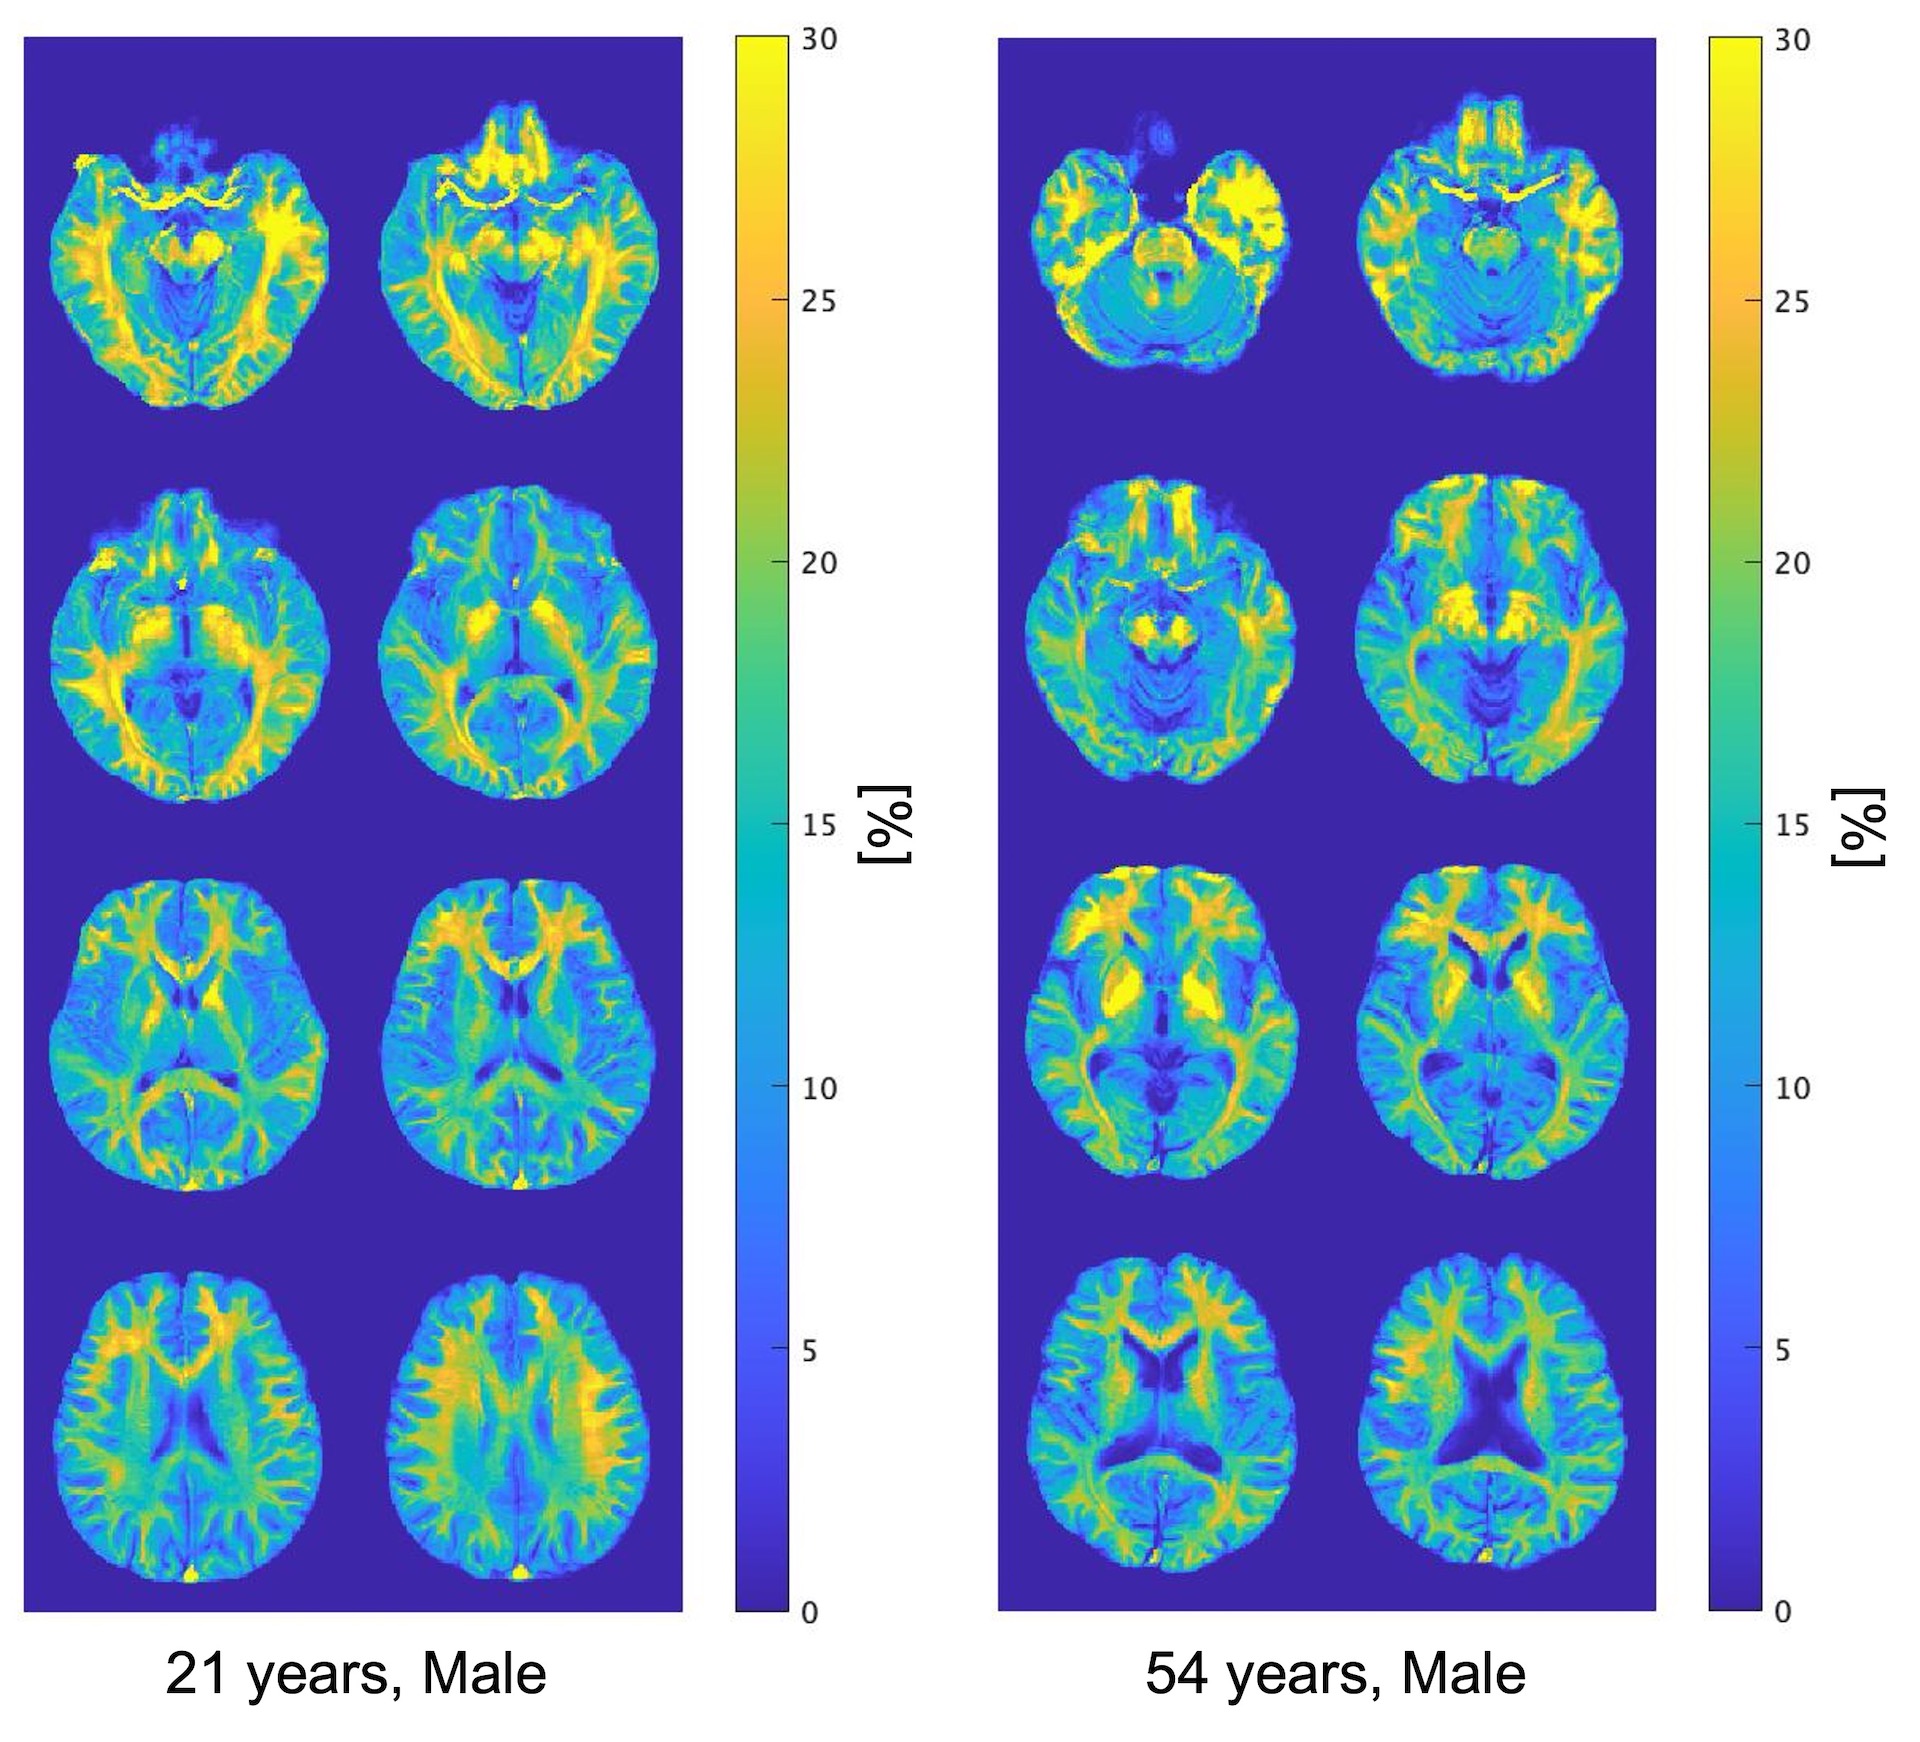
Figure 4 MWFQPM maps of two representative subject converted from R1·R2* using the acquired regression curve. Left shows the results for the 21 year old man, and right is the 54 year old man.
DOI: https://doi.org/10.58530/2022/3052