3051
Non-neuropsychiatric Childhood-onset Systemic Lupus Erythematosus: Changes in Brain Network Organization and White Matter Microstructure
Laleh Eskandarian1,2, Müşerref Kasap Cüceoğlu3, Selcan Demir3, Tuna Cak4, Ebru Cengel Kultur4, Yelda Bilginer3, Seza Ozen3, and Kader K Oguz2,5
1Neuroscience Department, Bilkent University, ANKARA, Turkey, 2National Magnetic Resonance Research Center (UMRAM), Bilkent University, ANKARA, Turkey, 3Faculty of Medicine, Department of Pediatrics, Division of Rheumatology, Hacettepe University, ANKARA, Turkey, 4Faculty of Medicine, Department of Pediatric Psychiatry, Hacettepe University, ANKARA, Turkey, 5Faculty of Medicine, Department of Radiology, Hacettepe University, ANKARA, Turkey
1Neuroscience Department, Bilkent University, ANKARA, Turkey, 2National Magnetic Resonance Research Center (UMRAM), Bilkent University, ANKARA, Turkey, 3Faculty of Medicine, Department of Pediatrics, Division of Rheumatology, Hacettepe University, ANKARA, Turkey, 4Faculty of Medicine, Department of Pediatric Psychiatry, Hacettepe University, ANKARA, Turkey, 5Faculty of Medicine, Department of Radiology, Hacettepe University, ANKARA, Turkey
Synopsis
Central nervous system in childhood-onset SLE shows an increased risk of damage due to onset age, accumulating disease effect and other possible pathophysiologic mechanisms. Thus, an understanding of the timing and extent of changes occurring in the brains of these young patients with SLE is important for new therapeutic strategies. With this purpose, we investigated whether brain network and white matter microstructural changes occur in non-neuropsychiatric SLE patients with disease onset at childhood. TBSS and graph analysis of DTI data, showed significant alterations in white matter integrity and global and nodal connectivity, which revealed correlations with disease duration and severity.
Purpose
Systemic lupus erythematosus (SLE) is an autoimmune multi-system disorder affecting the central nervous system (1). Abnormalities of brain metabolic profiles and microstructure, linked to the disease activity and severity were shown by MRI in adults (5-7). Childhood-onset SLE (cSLE) is rare and although there is an increased risk of neuropsychiatric symptoms, underlying pathological mechanisms remain poorly understood (2-4). Brain network mapping might help us better understand timing and extent of the structural and functional damage (8). This study aims to investigate a) whether alterations in topographical organization of structural brain networks and white-matter (WM) integrity occur in non-neuropsychiatric cSLE, b) if so, whether these changes correlate with clinical disease severity and duration of the disease.Methods
IRB approval and signed informed consent of the subjects/families were obtained.Subjects
Eighteen SLE patients diagnosed under the age of 18, without neuropsychiatric symptoms, and 13 healthy controls (HCs) were included in the study. All subjects had a normal brain MRI Demographic and clinical features, memory tests, depression score, State-Trait Anxiety Inventory (STAI Trait) score, State Anxiety Inventory (STAI state) score, SLE Disease Activity Index (SLEDAI) score, and Systemic Lupus International Collaborating Clinics (SLICC) score of the patients at the time of imaging were documented.
Image Acquisition
All participants had T1W 3D MPRAGE, axial T2W TSE and DTI (TR/TE = 8020 / 83 ms; slice thickness, 2 mm; bmax, 700 s/mm2; 60 independent gradient directions; FoV, 256 mm; 128×128; voxel size 2mm3) of the whole brain on a 3.0 T MRI scanner using a 32-channel head coil.
Data Processing and Analysis
To investigate whole brain WM alterations in diffusion metrics, tract-based spatial statistics (TBSS) (9), included in the FSL toolkit (http://www.fmrib.ox.ac.uk/fsl) version 5.9 was used. Following the preprocessing steps of DTI analysis including BET (Brain Extraction Tool), eddy correct function and DTIFIT function of FSL, TBSS method was applied on the FA, MD, AD, and RD images. Graph analysis was conducted using DSI Studio software (http://dsi-studio.labsolver.org/)(10). First, reconstruction step, conversion of the Dicom file to the FIB file, then, the fiber tracking of the whole brain using 10 million seeds were performed. For a generation of the connectivity matrix, a parcellation map was created from 38 selected ROIs available in the native space (MNI space). Then, the connectivity matrix was calculated according to the counting the number of tracts that pass two ROIs. Each one of the ROIs is considered as a node of a graph. According to the connectivity matrix and selected ROIs, network analysis was done by DSI Studio. Graph theoretical analysis looks at brain connections as a graph and analyzes them, using graph-based metrics. These metrics consist of a vast range of measurements including clustering coefficient, path length, local efficiency, and global efficiency. Betweenness centrality (BC), Strength, clustering coefficient and degree have been measured for each node. Network Hubs have been identified based on the classification of nodes whose strength was 1 SD above the average value. Statistical analysis for group differences was performed using R programming using RStudio (11) version 1.2.1335 on Mac.
Results
The cSLE patients and HCs were similar in terms of gender and age (F/M:11/7 and 7/6; mean age ± SD: 16.53 ± 2.33, 16.69 ± 1.70, t-test, p: 0.69 and 0.83, respectively). Compared to HCs, patients’ TBSS maps revealed a reduction in FA and increase in MD and RD values prominent in the genu and body of corpus callosum, bilateral corona radiata, the left external capsule, forceps minor and right corticospinal, bilateral anterior thalamic radiation, cingulum, and inferior fronto-occipital, uncinate and superior longitudinal (temporal part) fasciculi with additional increment in the right anterior limb of the internal capsule, and right external capsule in MD (p < 0.05) (Figure 1). Graph analysis revealed bilateral hippocampi, thalami, cingulate anterior, bilateral inferior temporal, left occipital temporal lingual, and left insula as brain network hubs in HCs. In patients, left inferior temporal, left occipital temporal lingual and left insula disappeared (Figure 2). Along with the reduction in numbers, all the hubs but the right and left thalamus showed a lower strength in the patients compared to HCs (Table 1). They also showed lower BC in the right hippocampus, both cingulate anterior, both inferior temporal and left occipital temporal medial lingual nodes. The strength of the left hippocampus and amygdala nodes showed significant correlations with disease duration. Strength of the nodes and disease activity scores derived from SLICC and SLEDAI did not show a significant correlation, however, there were correlations between BC of the left amygdala and accumbens and SLEDAI, and BC of the left thalamus, right parahippocampal and right occipital temporal lingual nodes with SLICC. Disease duration is also correlated with BC of the left entorhinal and right rectus nodes (Figure 3).Conclusion
Abnormalities in global and nodal structural connectivity in addition to microstructural disturbances in white matter occur in non-neuropsychiatric cSLE patients. Network properties showed significant correlations with disease duration, which imply a thorough neuropsychiatric evaluation in these patients prior to the appearance of manifest clinical symptoms.Acknowledgements
No acknowledgement found.References
- Jeltsch-David H, Muller S. Neuropsychiatric systemic lupus erythematosus: pathogenesis and biomarkers. Nat Rev Neurol. 2014 Oct;10(10):579-96. doi: 10.1038/nrneurol.2014.148. Epub 2014 Sep 9. PMID: 25201240.
- Correa DG, Zimmermann N, Pereira DB, et al. Evaluation of white matter integrity in systemic lupus erythematosus by diffusion tensor magnetic resonance imaging: a study using tract-based spatial statistics. Neuroradiology 2016; 58: 819–825.
- Jung RE, Caprihan A, Chavez RS, et al. Diffusion tensor imaging in neuropsychiatric systemic lupus erythematosus. BMC Neurol 2010; 10: 65.
- Ercan E, Ingo C, Tritanon O, et al. A multimodal MRI approach to identify and characterize microstructural brain changes in neuropsychiatric systemic lupus erythematosus. Neuroimage Clin 2015; 8: 337–344.
- S. Kamphuis and E. D. Silverman, “Prevalence and burden of pediatric-onset systemic lupus erythematosus.,” Nat. Rev. Rheumatol., vol. 6, no. 9, pp. 538–546, Sep. 2010, doi: 10.1038/nrrheum.2010.121.
- Postal M, Lapa AT, Reis F, et al. Magnetic resonance imaging in neuropsychiatric systemic lupus erythematosus: current state of the art and novel approaches. Lupus 2017; 26: 517–521.
- Hanly JG, Kozora E, Beyea S, et al. Nervous system disease in systemic lupus erythematosus: current status and future directions. Arthritis Rheumatol 2018; 71: 33–42.
- Bullmore E, Sporns O. Complex brain networks: graph theoretical analysis of structural and functional systems. Nat Rev Neurosci 2009; 10: 186–198.
- Smith SM, Jenkinson M, Johansen-Berg H, Rueckert D, Nichols TE, Mackay CE, Watkins KE, Ciccarelli O, Cader MZ, Matthews PM, Behrens TE. Tract-based spatial statistics: voxelwise analysis of multi-subject diffusion data. Neuroimage. 2006 Jul 15;31(4):1487-505.
- F. Yeh, “DSI Studio,” Jun. 2021, doi: 10.5281/ZENODO.4978980.
- Team (2018). RStudio: Integrated Development for R. RStudio, Inc., Boston, MA URL http://www.rstudio.com/.
Figures
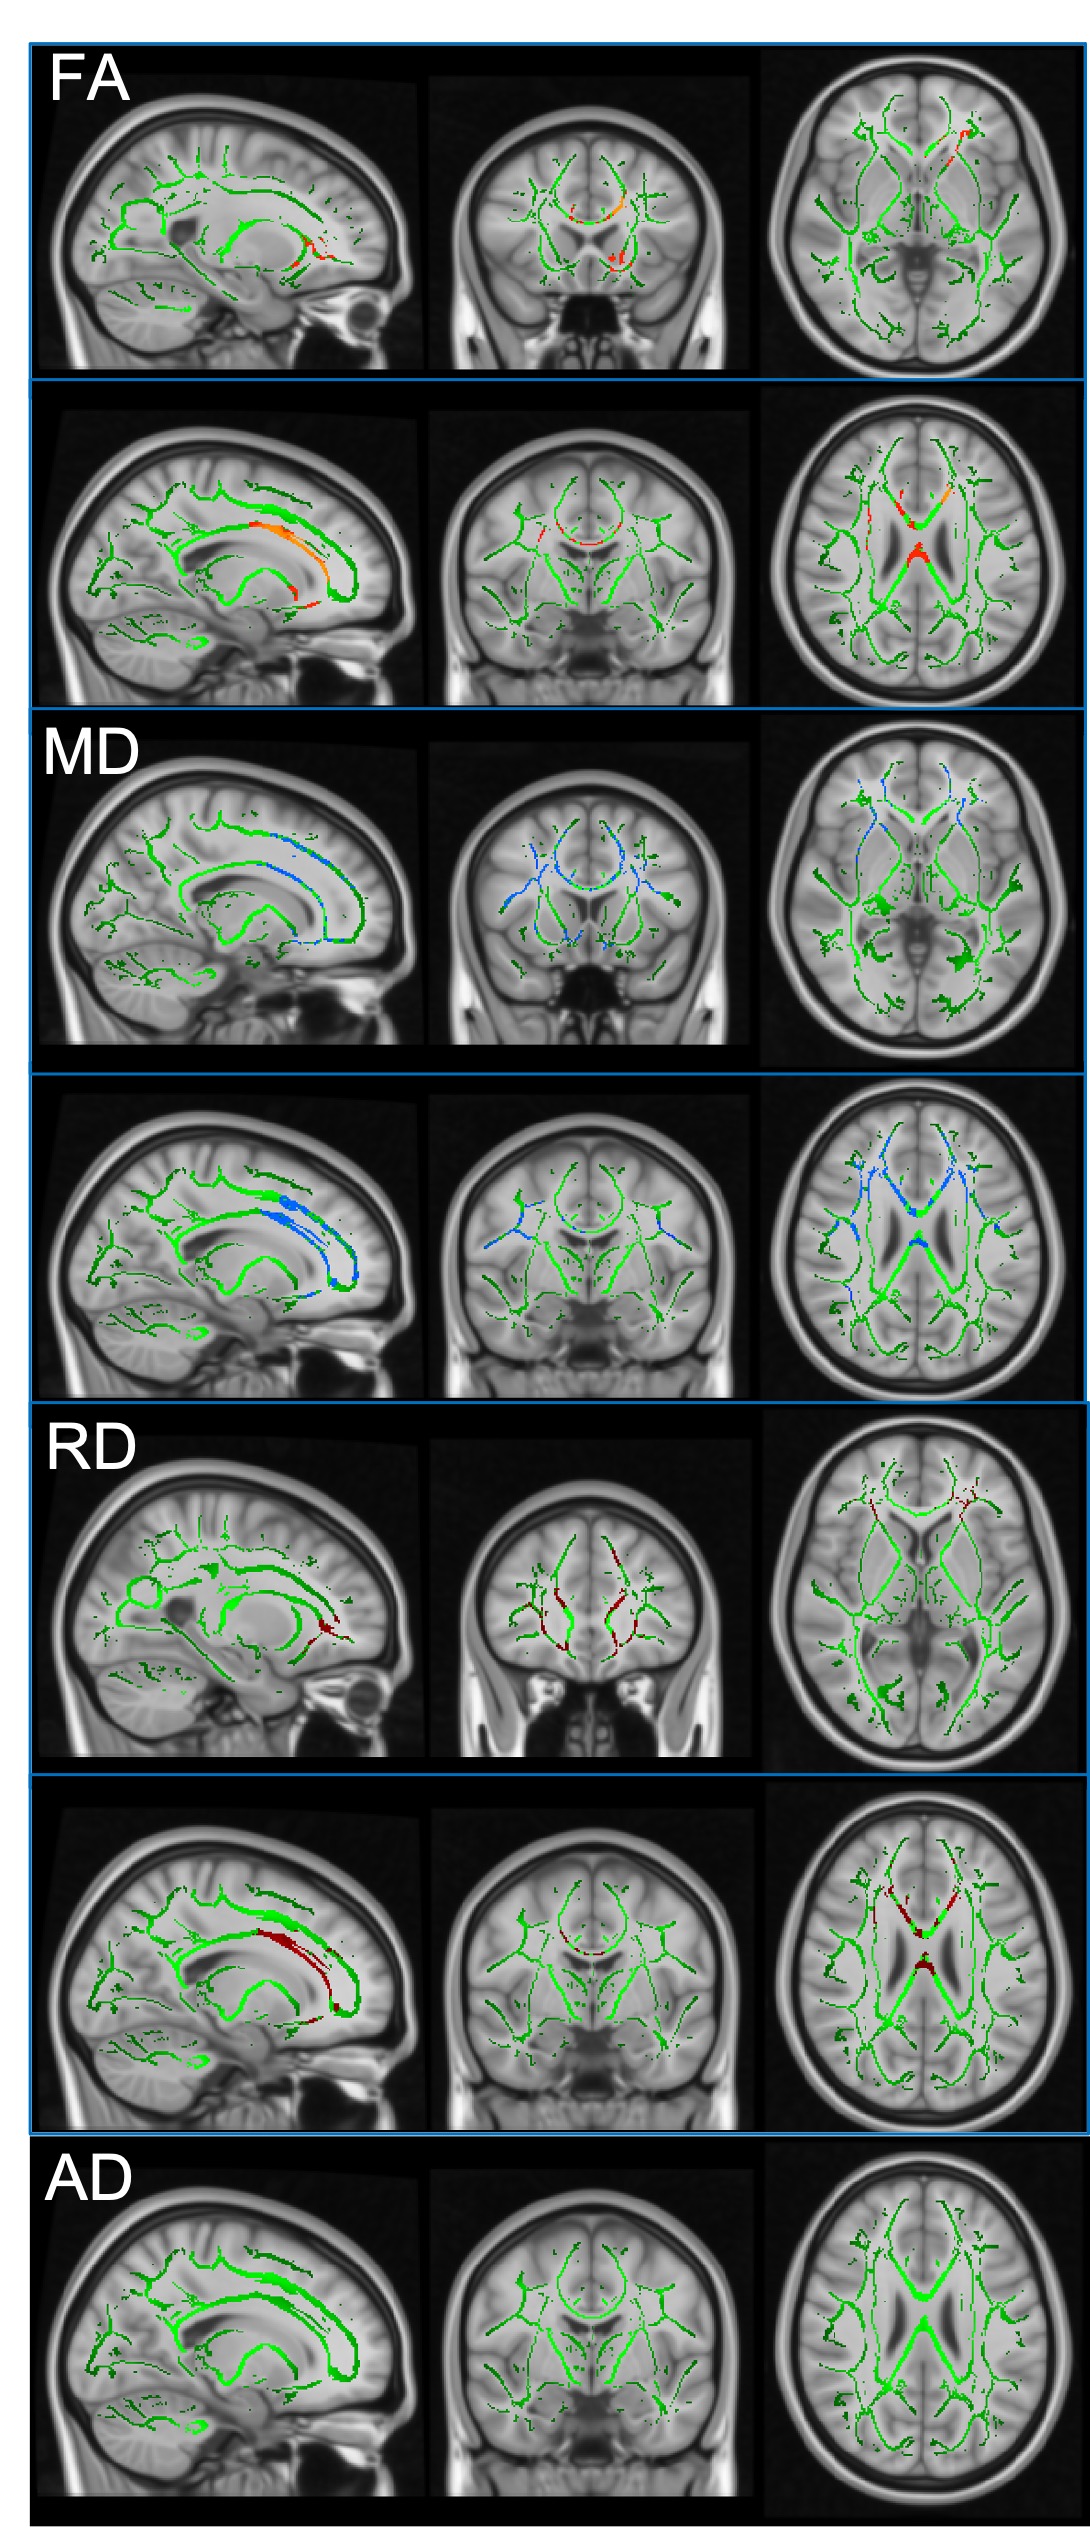
Figure 1. TBSS-DTI shows the comparison of WM tracts in cSLE and HCs. Yellow-Red highlighted areas represent the regions where cSLE had significantly lower FA, while blue and dark red highlighted areas show regions with significantly increased MD and RD, respectively (p < 0.05). There is no significant change in AD. Patients with cSLE have significantly lower FA, and higher MD and RD as shown in the genu and body of corpus callosum, and tracts of forceps minor and right corticospinal.
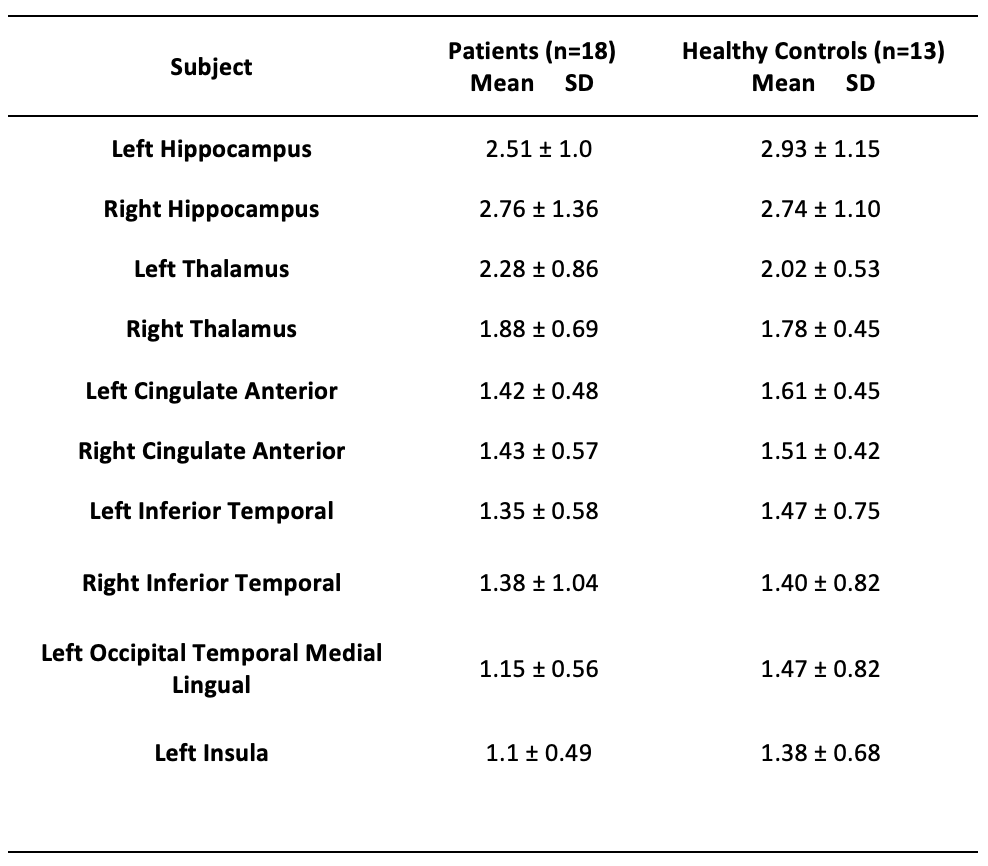
Table 1. Patients and Healthy Controls structural brain nodes’ strength. All the hubs but right and left thalamus showed a lower strength in the patients compared to HCs.
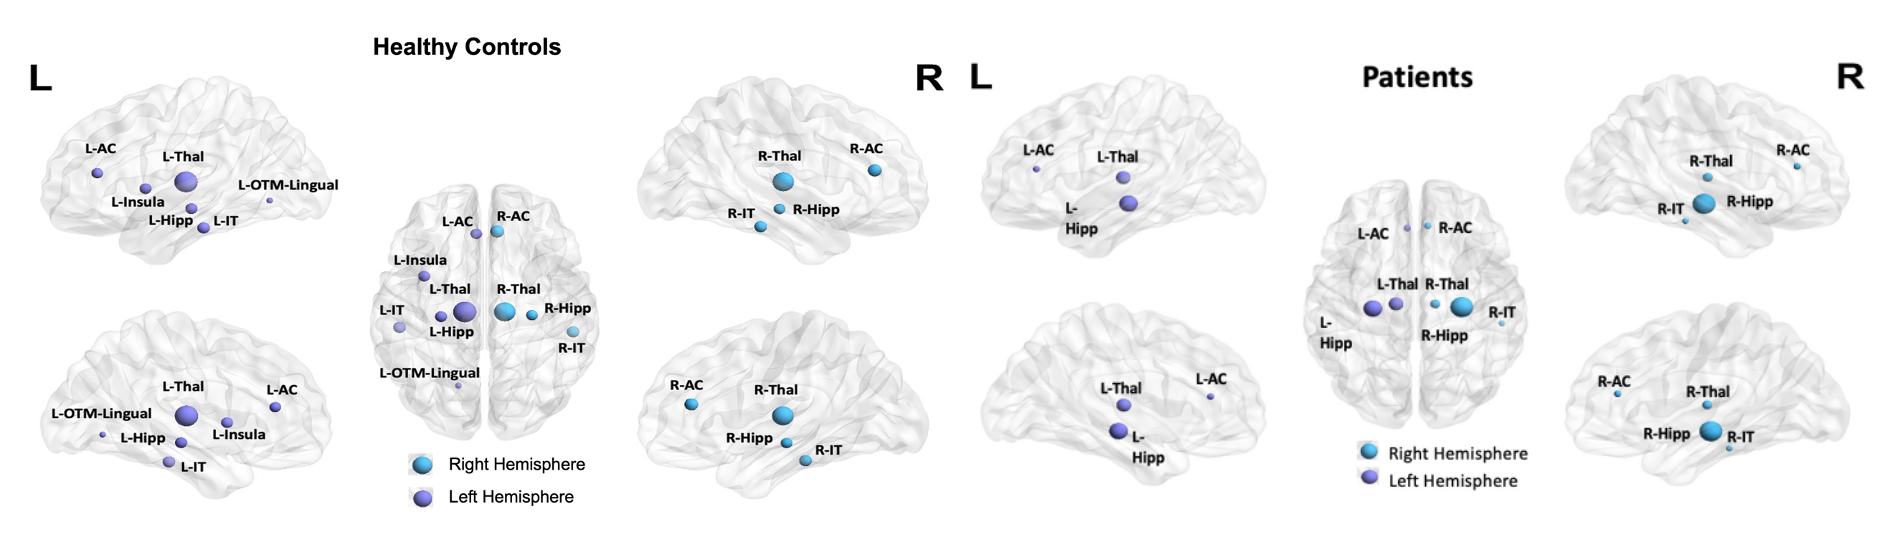
Figure 2. Structural brain hubs in cSLE patients and HCs with diameters in relation to strength. There are fewer hubs in patients: the left inferior temporal, left occipital temporal lingual and left insula. All hubs but the right and left thalamus showed reduced strength in patients. R for right, L for left; AC, anterior cingulate; Thal, thalamus; Hipp, hippocampus; IT, inferior temporal; OTM-Lingual, occipital temporal medial lingual. Figure prepared using BrainNet Viewer (https://www.nitrc.org/projects/bnv/).
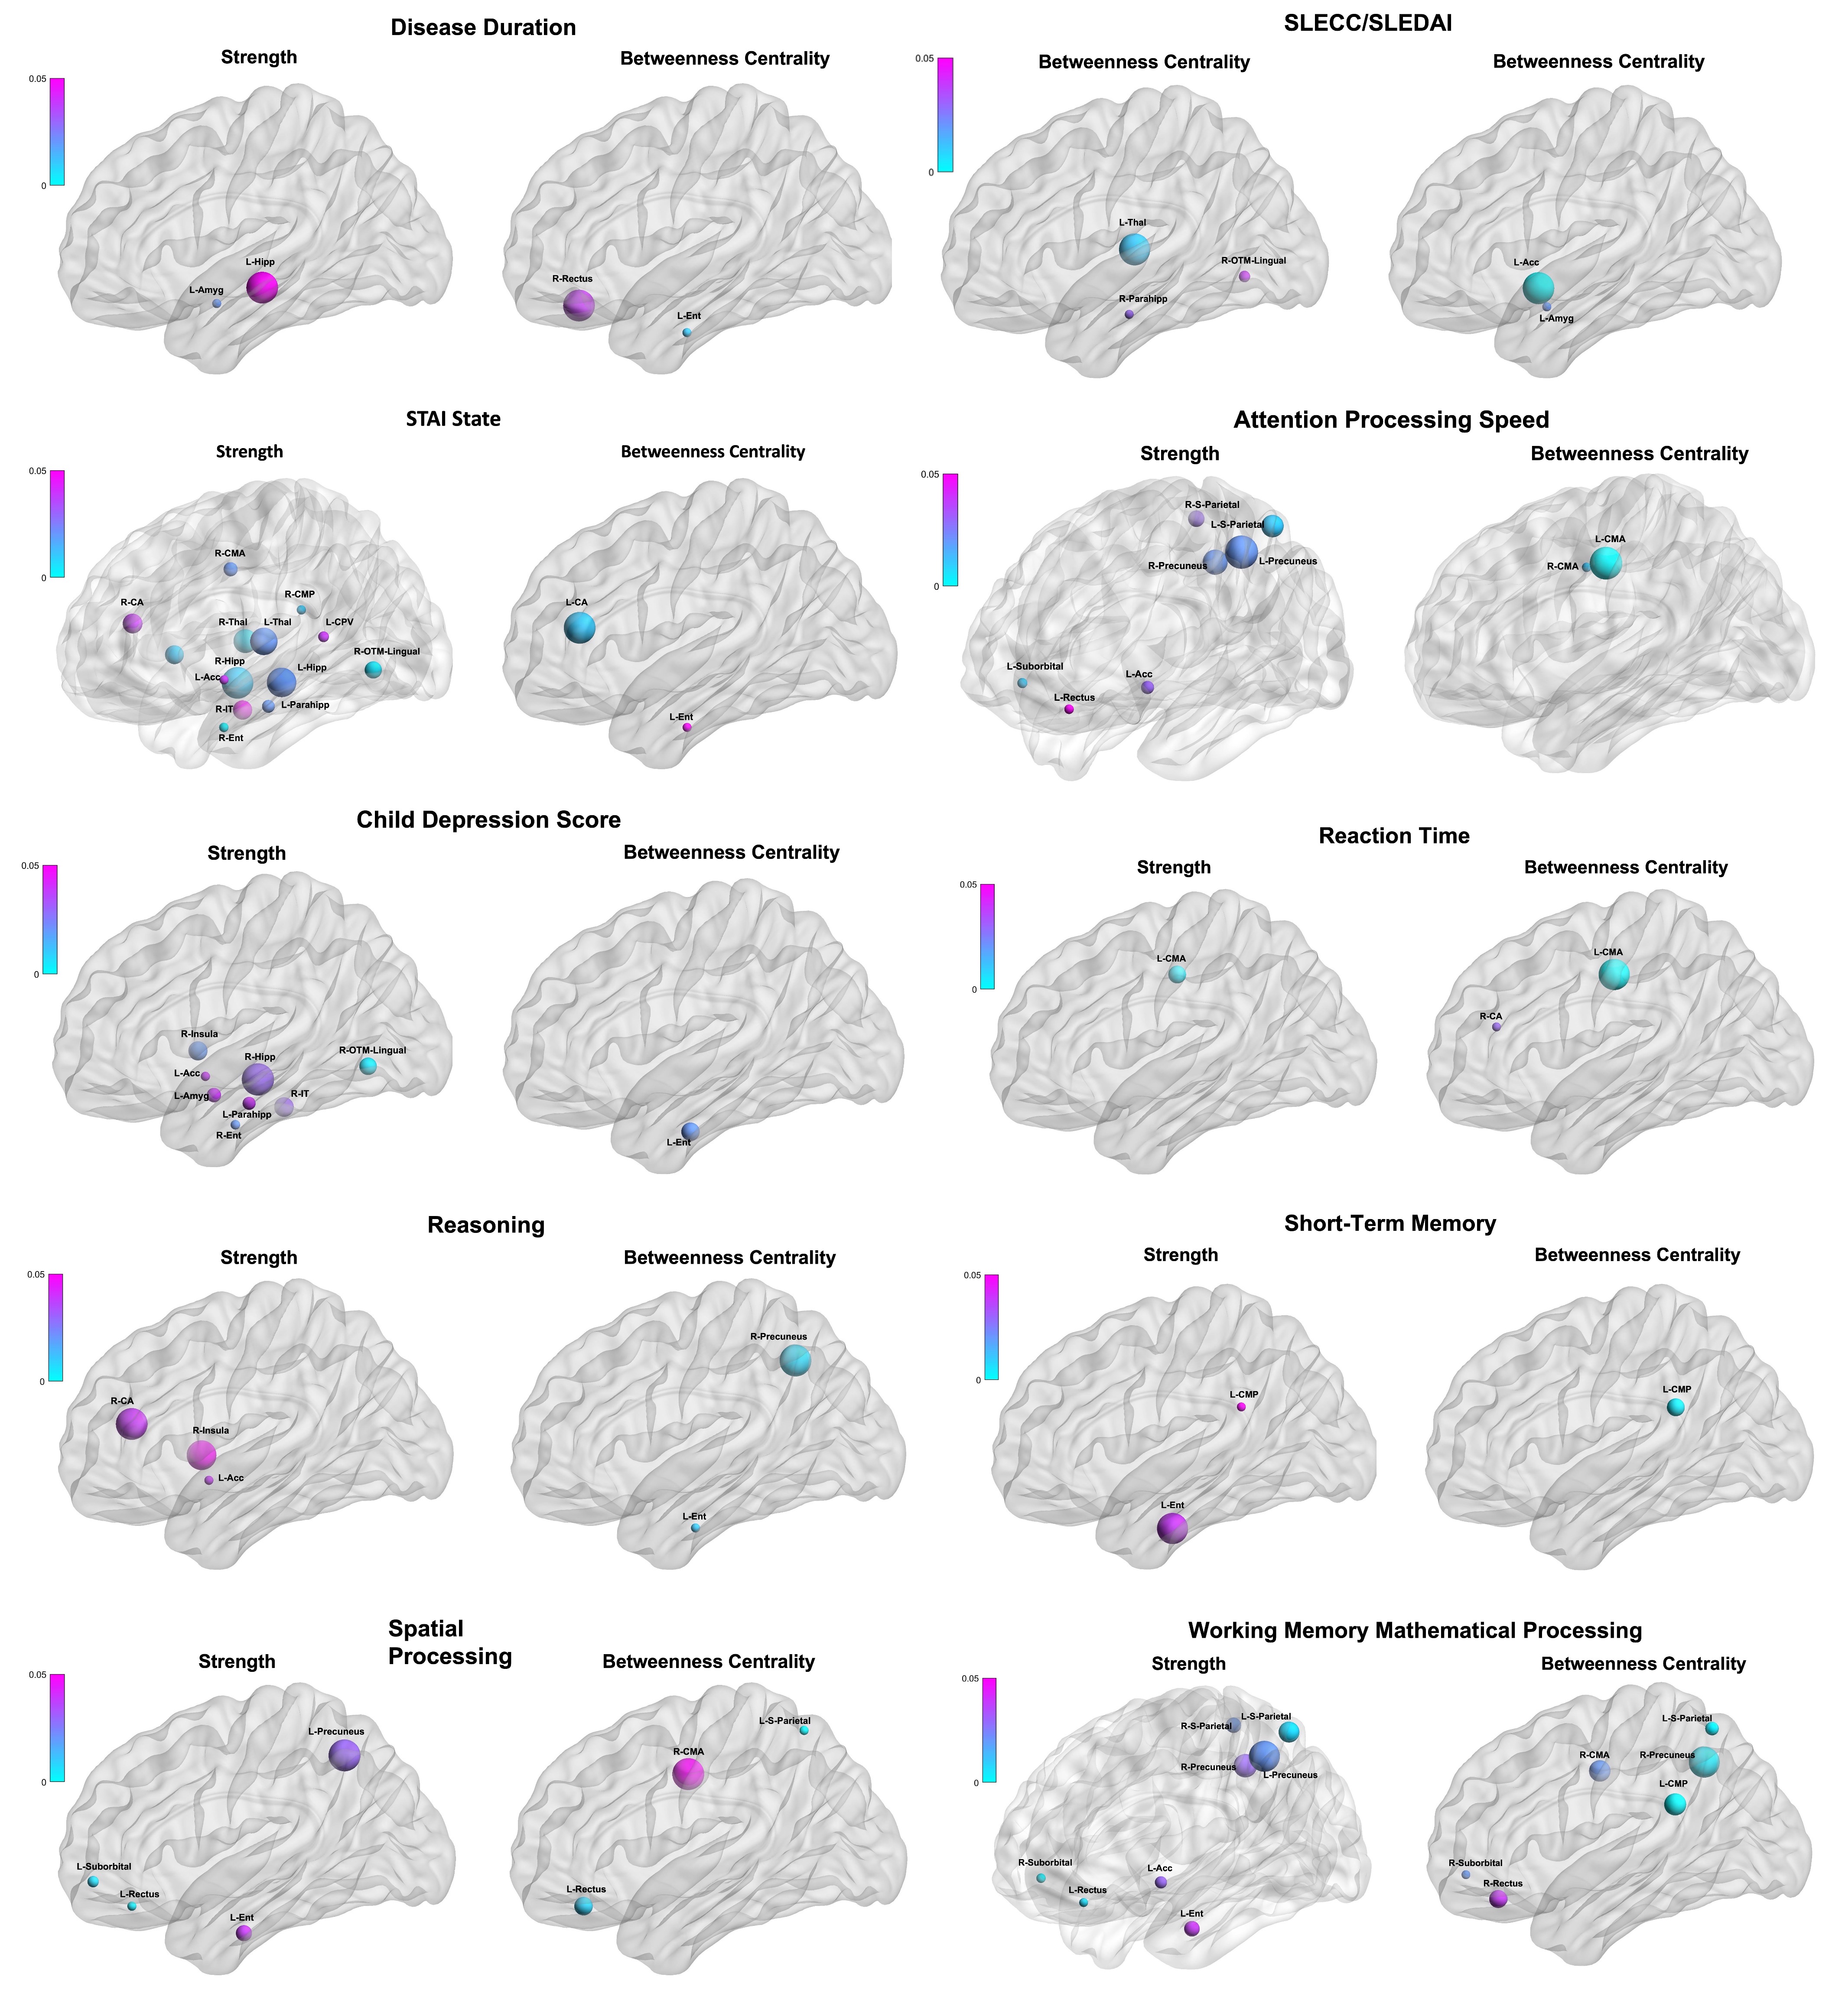
Figure 3. Brain nodes show the significant correlations between network strength and betweenness centrality and clinical measurements (disease scores, memory and depression tests). The colour bars show the range of p-values. For abbreviations see Table 2. Figure prepared using BrainNet Viewer (https://www.nitrc.org/projects/bnv/).
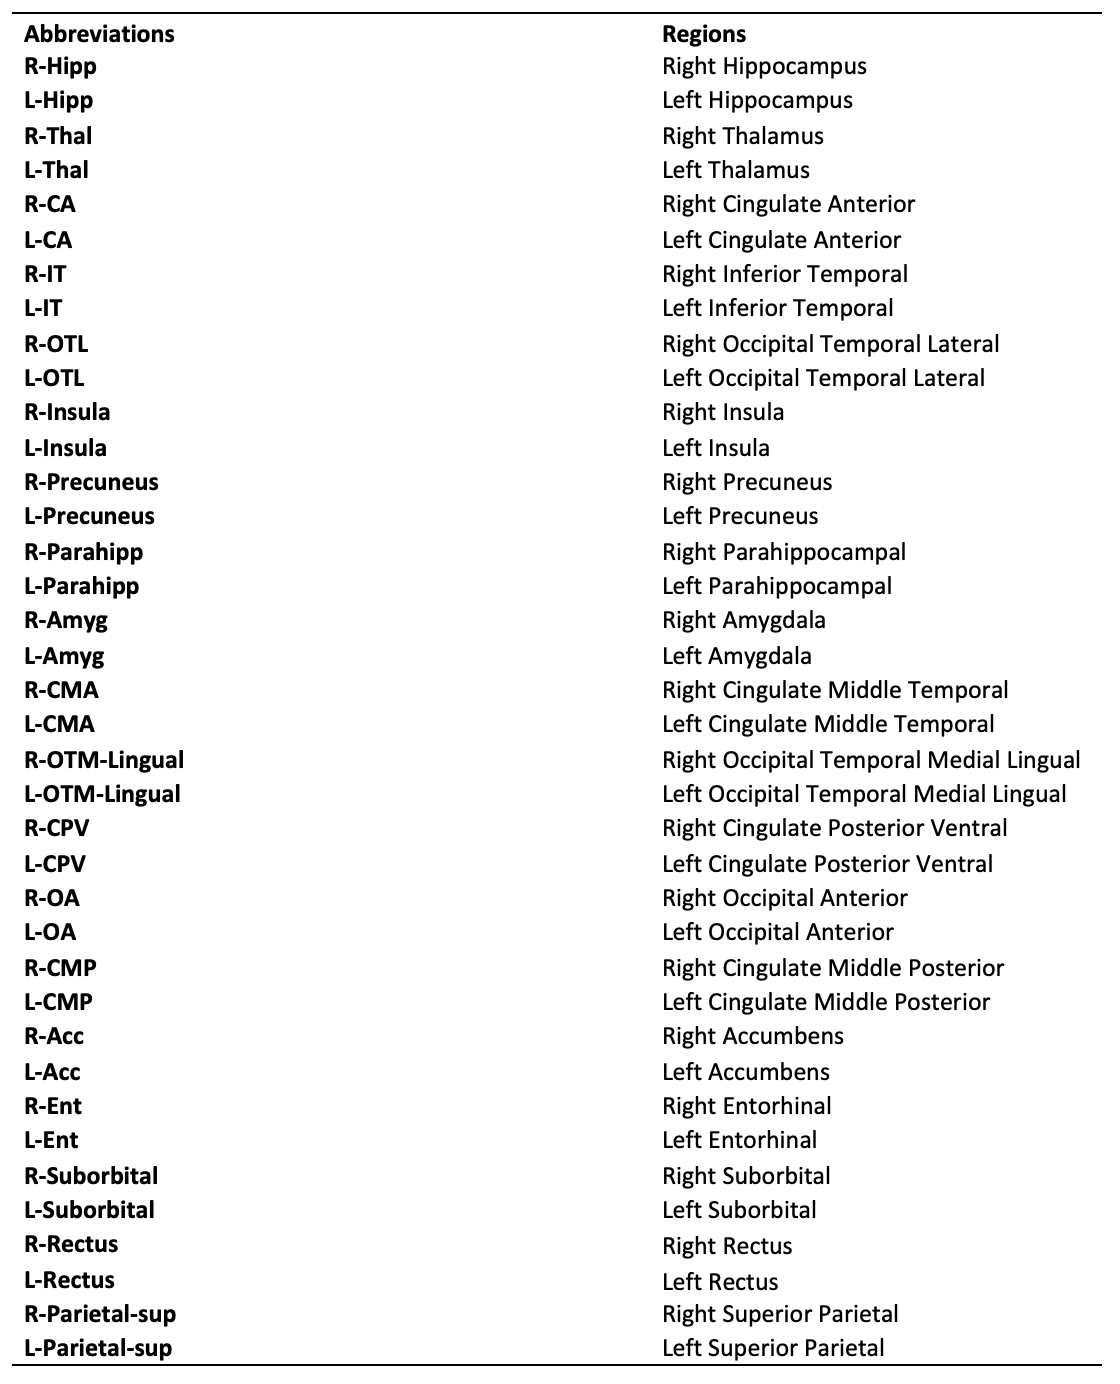
Table 2. Abbreviations of the brain regions' name
DOI: https://doi.org/10.58530/2022/3051