3050
Fixel-Based Analysis of White Matter Degeneration in Patients with Huntington Disease
Chih-Chien Tsai1,2, Sher Li Oh3, Chiung-Mei Chen4, Yih-Ru Wu4, Maria Valdes Hernandez5,6, Jur-Shan Cheng7, Yao-Liang Chen8, Yi-Ming Wu8, Yu-Chun Lin8, and Jiun-Jie Wang1,2,9,10
1Department of Medical imaging and Radiological Science, Chang-Gung University, Taoyuan City, Taiwan, 2Healthy Aging Research Center, Chang Gung University, Taoyuan City, Taiwan, 3Nanyang Technological University, Singapore, Singapore, 4Department of Neurology, Chang Gung Memorial Hospital, Taoyuan City, Taiwan, 5Centre for Cognitive Ageing and Cognitive Epidemiology, Department of Neuroimaging Sciences, University of Edinburgh, Edinburgh, United Kingdom, 6Centre for Clinical Brain Sciences, University of Edinburgh, Edinburgh, United Kingdom, 7Clinical Informatics and Medical Statistics Research Center, Chang-Gung University, Taoyuan City, Taiwan, 8Department of f Medical Imaging and Intervention, Chang Gung Memorial Hospital, Taoyuan City, Taiwan, 9Medical Imaging Research Center, Institute for Radiological Research, Chang Gung University/Chang Gung Memorial Hospital, Taoyuan City, Taiwan, 10Department of Diagnostic Radiology, Chang Gung Memorial Hospital, Taoyuan City, Taiwan
1Department of Medical imaging and Radiological Science, Chang-Gung University, Taoyuan City, Taiwan, 2Healthy Aging Research Center, Chang Gung University, Taoyuan City, Taiwan, 3Nanyang Technological University, Singapore, Singapore, 4Department of Neurology, Chang Gung Memorial Hospital, Taoyuan City, Taiwan, 5Centre for Cognitive Ageing and Cognitive Epidemiology, Department of Neuroimaging Sciences, University of Edinburgh, Edinburgh, United Kingdom, 6Centre for Clinical Brain Sciences, University of Edinburgh, Edinburgh, United Kingdom, 7Clinical Informatics and Medical Statistics Research Center, Chang-Gung University, Taoyuan City, Taiwan, 8Department of f Medical Imaging and Intervention, Chang Gung Memorial Hospital, Taoyuan City, Taiwan, 9Medical Imaging Research Center, Institute for Radiological Research, Chang Gung University/Chang Gung Memorial Hospital, Taoyuan City, Taiwan, 10Department of Diagnostic Radiology, Chang Gung Memorial Hospital, Taoyuan City, Taiwan
Synopsis
Microstructure damage in white matter might be linked to regional and global atrophy in Huntington Disease. Fixel-based analysis (FBA) has recently emerged as a useful fiber-specific tool for examining white matter structure, which could be an important contributor to the pathogenesis of Huntington’s disease. Therefore, we investigate the utility of FBA as a biomarker for disease progression. Our findings indicated the reductions in FBA occurs in major white matter tracts, which was closely co-localized with the regions of increased diffusivity in basal ganglia. FBA analysis is effective in studying white matter tractography and fiber changes in Huntington’s Disease.
INTRODUCTION
Huntington’s Disease is an autosomal dominant genetic disease that results in progressive neurodegeneration. Study has revealed extensive grey and white matter atrophy in the brains of patients with Huntington’s Disease [1]. Large-scale longitudinal MRI cohort studies focused mainly on identifying biomarkers of Huntington’s Disease that can indicate disease progression before and after clinical diagnosis throughout different stages [2; 3; 4]. Diffusion MRI is often used as a non-invasive method of observing microstructural and macrostructural alterations in grey and white matter over time. Analysis of changes in water diffusion in patients with Huntington’s Disease might provide insight on the changes that the brain undergoes as the disease progresses. In Huntington’s Disease, the severity of motor impairments is often found to be correlated to volume loss in the basal ganglia, particularly in the nucleus accumbens, caudate nucleus, putamen, and globus pallidus [5]. Widespread white matter neurodegeneration has been observed in longitudinal studies of Huntington’s Disease patients, especially in the corpus callosum and the internal capsule [6], cingulum and striatal projection [7]. We therefore hypothesize that the atrophy that takes place in subcortical regions, in particular the basal ganglia, in patients of Huntington’s Disease, is associated with the damage of white matter tracts linking the affected subcortical regions.METHODS
We used connectivity-based fixel enhancement and fixel-based analysis [8] to study white matter tractography and diffusivity in 12 Huntington’s Disease patients and 16 healthy unrelated controls. We used a 3T MR scanner from Siemens. T1 -weighted magnetisation-prepared rapid acquisition gradient echo and diffusion weighted images were obtained. The imaging parameters for T 1 -weighted images were as follows: repetition time (TR) / echo time (TE) = 1700 ms / 2.63 ms, number of slices = 160, voxel size = 1×1×1 mm 3 , inversion time = 900 ms, flip angle = 9º, matrix size = 224× 256, field of view= 224× 256 mm 2 , and slice thickness = 1 mm. Diffusion weighted images were acquired using a spin-echo echo planar imaging sequence with the following parameters: TR / TE = 5200 ms / 92 ms, voxel size = 2× 2× 3 mm 3 , matrix size = 128× 128, number of slices = 13, slice thickness = 3 mm, and b-value = 0 and 1000 s/mm 2 . The diffusion weighted gradients were applied along 12 non-collinear directions. Clinical assessment of Huntington’s Disease severity was conducted using the Unified Huntington’s Disease Rating Scale (UHDRS) and cognitive decline was evaluated using the Mini-Mental State Examination (MMSE). The correlation between image metrics and results from the patients’ clinical assessment using their UHDRS scores was evaluated using Spearman’s rank correlation coefficient. In all tests, significance was reached at a threshold of p ≦0.005 after correction for multiple comparisons using Bonferroni correction. General linear model and non-parametric permutation testing were used to identify group differences in FD, FC, and FDC with significance level p ≦0.05 [9]. Bonferroni correction was used to account for multiple comparisons.RESULTS
Patients showed reduced fixels located in widespread white matter, noticeably in the forceps minor, major, and corona radiata white matter fibers in the corpus callosum, and in the corticospinal fibers and middle thalamic radiation in the posterior limb of the internal capsule (Figure 1). In addition, reduced FDC and FC were observed in the corticospinal tract in Huntington’s Disease patients compared to healthy control participants (Figure 2). Figure 3 shows the co-localization of significant differences in FDC, FC, and FD of white matter fibers and tensor-derived indices of subcortical grey matter regions. It can be observed that the affected white matter tracts, such as the internal capsule and corpus callosum, are closely positioned to these subcortical regions of interest.DISCUSSION
This study sought to investigate white matter microstructural differences in patients with Huntington’s Disease using fixel-based analysis. Compared to the healthy control participants, the main findings in patients include: 1) between-group differences in fixel-derived indices, noticeably located bilaterally in the corpus callosum and internal capsule, 2) reduced FDC and FC along the corticospinal tract, and 3) increased FC in the fornix, despite reduction in FDC and apparent fiber density. The affected regions, including the corpus callosum and the internal capsule, are in line with those in morphometry studies [1]. The axonal degeneration in these regions and other major tracts such as the superior longitudinal fasciculus and uncinate fasciculus might explain why Huntington’s Disease affects multiple regions of the brain with such widespread effects on motor and cognitive functions. Our study might provide additional image-based evidence that axonal degeneration is likely to occur over the manifestation of Huntington’s Disease.CONCLUSION
Fixel-based analysis could provide new information on white matter tracts affected in patients affected by Huntington’s Disease, and therefore is potentially helpful in the development of potential new therapeutic interventions.Acknowledgements
The presents work was supported by the Imaging Core Laboratory of the Institute for Radiological Research and the Center for Advanced Molecular Imaging and Translation. The authors thank the Neuroscience Research Center (Chang Gung Memorial Hospital) and the Healthy Aging Research Center (Chang Gung University) for their invaluable support. This work was also supported by the UK Dementia Research Institute which receives its funding from DRI Ltd, funded by the UK Medical Research Council (MRC), Alzheimer’s Society and Alzheimer’s Research UK.References
[1] N.Z. Hobbs, S.M. Henley, G.R. Ridgway, E.J. Wild, R.A. Barker, R.I. Scahill, J. Barnes, N.C. Fox, and S.J. Tabrizi, The progression of regional atrophy in premanifest and early Huntington's disease: a longitudinal voxel-based morphometry study. Journal of Neurology, Neurosurgery & Psychiatry 2010; 81 756-763. [2] J.S. Paulsen, Functional imaging in Huntington's disease. Experimental neurology 2009; 216 272-277. [3] S.J. Tabrizi, R. Reilmann, R.A. Roos, A. Durr, B. Leavitt, G. Owen, R. Jones, H. Johnson, D. Craufurd, and S.L. Hicks, Potential endpoints for clinical trials in premanifest and early Huntington's disease in the TRACK-HD study: analysis of 24 month observational data. The Lancet Neurology 2012; 11 42-53. [4] J.F. Domínguez D, G.F. Egan, M.A. Gray, G.R. Poudel, A. Churchyard, P. Chua, J.C. Stout, and N. Georgiou-Karistianis, Multi-modal neuroimaging in premanifest and early Huntington’s disease: 18 month longitudinal data from the IMAGE-HD study. PloS one 2013; 8 e74131. [5] E.M. Coppen, M. Jacobs, A.A. van den Berg-Huysmans, J. van der Grond, and R.A. Roos, Grey matter volume loss is associated with specific clinical motor signs in Huntington's disease. Parkinsonism & Related Disorders 2018; 46 56-61. [6] H.D. Rosas, D.S. Tuch, N.D. Hevelone, A.K. Zaleta, M. Vangel, S.M. Hersch, and D.H. Salat, Diffusion tensor imaging in presymptomatic and early Huntington's disease: Selective white matter pathology and its relationship to clinical measures. Movement disorders: official journal of the Movement Disorder Society 2006; 21 1317-1325. [7] G.R. Poudel, J.C. Stout, A. Churchyard, P. Chua, G.F. Egan, and N. Georgiou-Karistianis, Longitudinal change in white matter microstructure in Huntington's disease: the IMAGE-HD study. Neurobiology of disease 2015; 74 406-412. [8] D.A. Raffelt, J.D. Tournier, R.E. Smith, D.N. Vaughan, G. Jackson, G.R. Ridgway, and A. Connelly, Investigating white matter fibre density and morphology using fixel-based analysis. Neuroimage 2017; 144 58-73. [9] T.E. Nichols, and A.P. Holmes, Nonparametric permutation tests for functional neuroimaging: a primer with examples. Human brain mapping 2002; 15 1-25.Figures
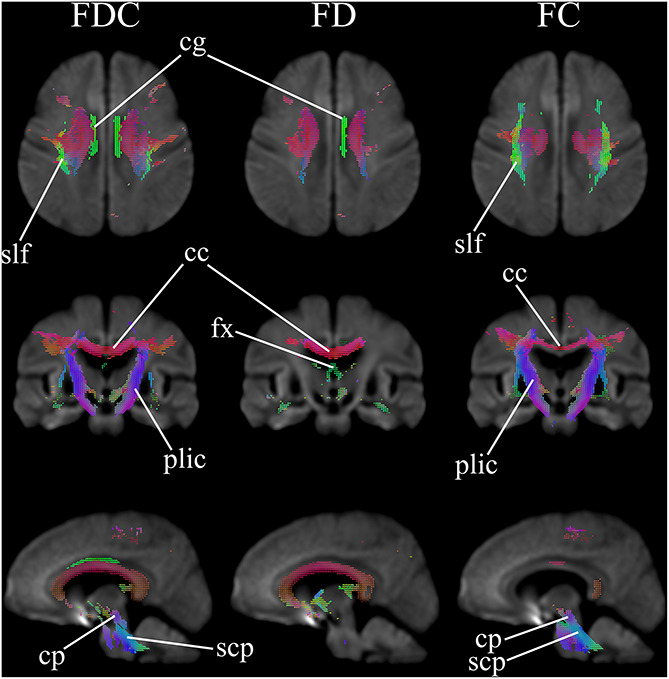
Figure 1. Areas of significant reductions in fiber
density (FD), fiber bundle cross-section (FC), and fiber density and
cross-section (FDC) in Huntington’s Disease patients compared to healthy
control participants. Significant fixels
(family-wise error corrected p < 0.05) are illustrated and colored according
to fiber direction. cg: cingulum; slf: superior longitudinal
fasciculus; cc: corpus callosum; fx: fornix; plic: posterior
limb of interior capsule;
cp: cerebral peduncles
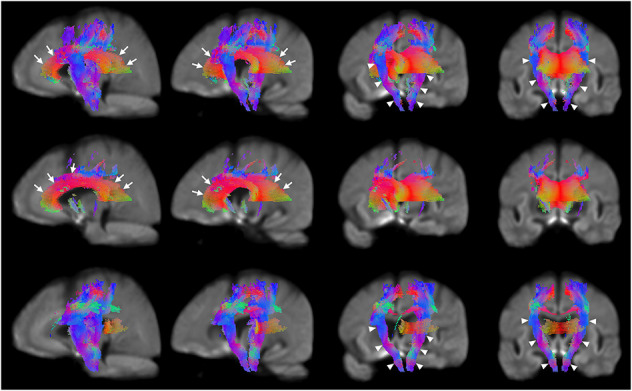
Figure 2. Areas of significant reductions in fiber
density and cross-section (FDC), fiber density (FD), and fiber bundle
cross-section (FC) in patients with Huntington’s Disease compared to
healthy control participants. Significant
fixels (FWE corrected p < 0.05) were illustrated and colored by direction. The corpus callosum and internal capsule (the third and rightmost columns)
were labelled using white arrows. Reductions in corticospinal tract: Top row, FDC (the leftmost and second columns); second row, FD; bottom row, FC.
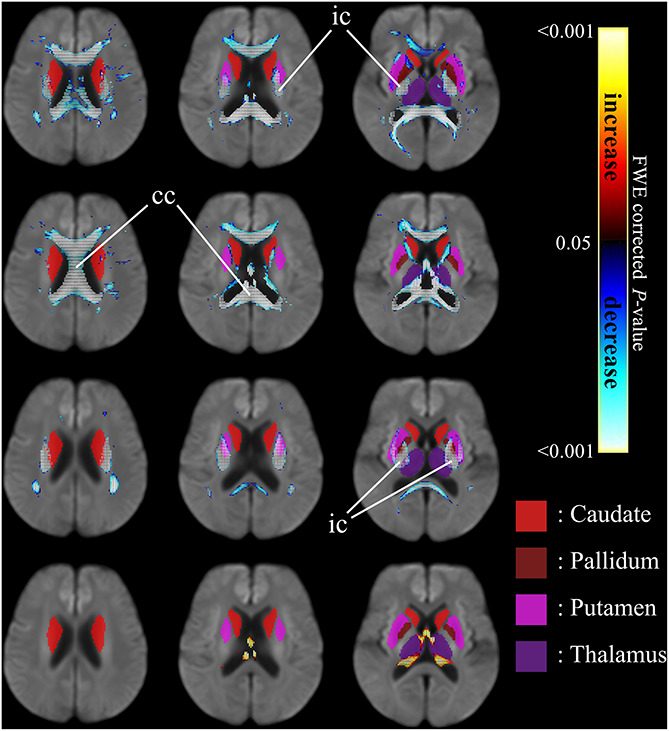
Figure 3. Significant differences in tensor-derived
indices from subcortical grey matter segmentation (solid colors)
and fixel-based metrics in neighborhood
regions, between patients with HD and healthy control
participants. Significant fixels (FWE corrected p
< 0.05) were illustrated and colored by p-values. Cold color: reduction; warm color: increase. Top row: FDC; second row: FD; third row: FC; bottom row: higher FC
in HD patients. ic: internal capsule; cc:
corpus callosum.
DOI: https://doi.org/10.58530/2022/3050