3046
Diagnostic performance of ADC and CBV imaging intersecting MRS for identifying molecular status in adult gliomas1radiology, Huaxi MR Research Center (HMRRC), Department of Radiology, West China Hospital of Sichuan University, Chengdu, China, Chengdu, China, 2radiology, Department of Radiology, West China Hospital of Sichuan University, Chengdu, China, Chengdu, China
Synopsis
Preoperative identification of IDH and 1p/19q codeletion could help clinical doctors make the optimal therapy plan. Although, there were few diagnostic studies could provide quantitative cutoff values of ADC and/or CBVfor identifying genogroup of gliomas. In this study, we calculated histogram metrics of ADC and CBV based on core tumor and used these metrics intersection MRS to establish diagnostic models to identify IDH mutant station and 1p/19q codeletion in turn. The main results showed that histogram metrics of ADC and CBV were powerful for identifying molecular status in adult gliomas. And MRS concentrations could improve diagnostic performance in both models.
INTRODUCTION
Recently, the new classification criteria of tumors of the Central Nervous System (CNS) was released in June 2021, which differentiate adult gliomas that occur primarily in adults from pediatric gliomas [1]. It has demonstrated that preoperative identification of IDH and 1p/19q codeletion could help clinical doctors have a better understanding of the optimal therapy. According to prior studies, apparent diffusion coefficient (ADC), cerebral blood volume (CBV) and 1H-MR spectroscopy (MRS) concentrations had abundant potential to become imaging biomarkers for diagnosis and management of patients with glioma[2]. In this study, we aimed to evaluate the diagnostic value of ADC, CBV and MRS concentrations based on relatively precise for identify genogroup of adult gliomas.METHODS
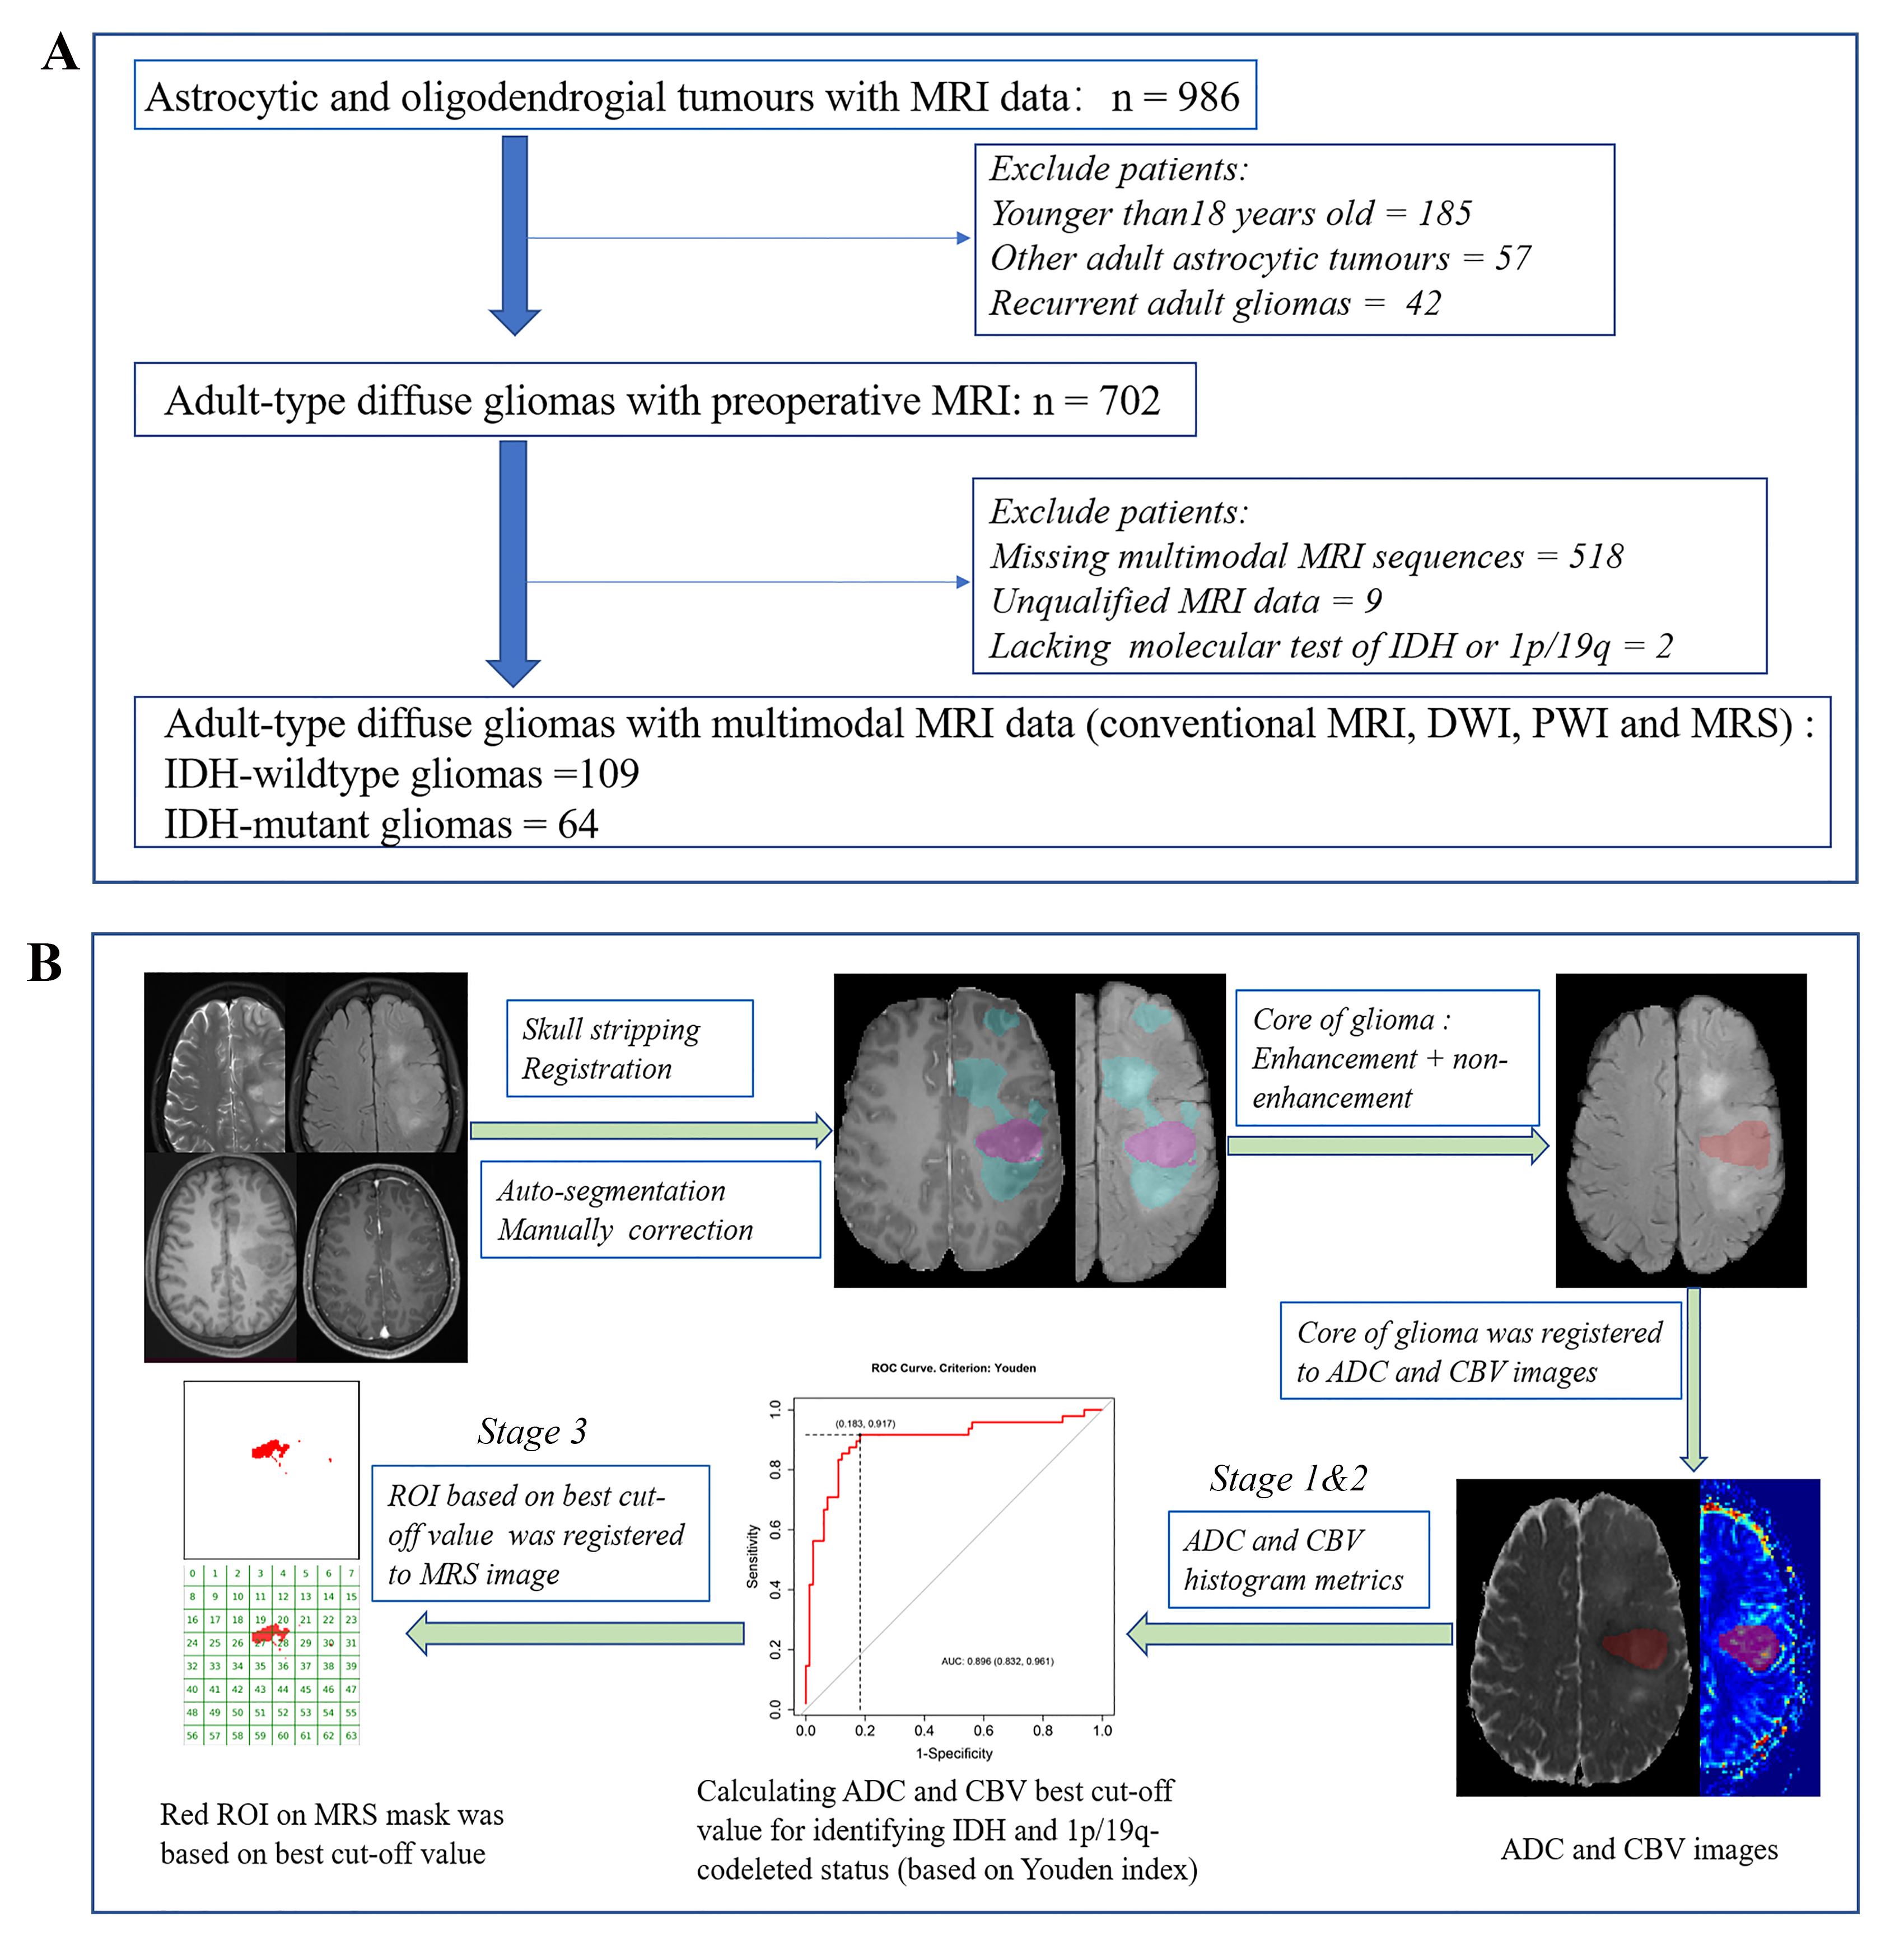
All patients in this study were diagnosed with glioma at glioma group in neurosurgery of our institution from April 2016 to April 2020. Patients who were diagnosed with diffuse gliomas and elders than 18 years old were involved, with known histology and genetic test results (IDH mutant status and 1p/19q co-deleted status). All patients underwent ADC, CBV and MRS exanimations. Automated glioma segmentation was performed on the open-source Brain Tumor Image Analysis (BraTumIA). After that, core tumor was obtained by FSL (version 6.0) [3] in order to calculate metrics of solid tumor. The histogram value of low-ADC was taken in a stepwise manner from the 75th percentile and of high-CBV was no more than 30th percentile. All histogram metrics of ADC and CBV images were normalized to the mean value of contralateral normal white matter [4]. The FLAIR images were always used to guide MRS data acquisition. The mask of MRS was acquired by Gannet (V.3.1) [5]. Intersecting low-ADC and MRS region of interest (ROI)(ROILAM) was generated in region based on above best cutoff value of ADC histogram, as was intersecting high-CBV (ROIHCM). The decision curve analysis (DCA) was used to help us make better clinical decisions. Data analysis was performed by R packages in the free software environment (R version 4.0.4, https://www.r-project.org/). The flowchart of this study was shown in Figure 1.RESULTS
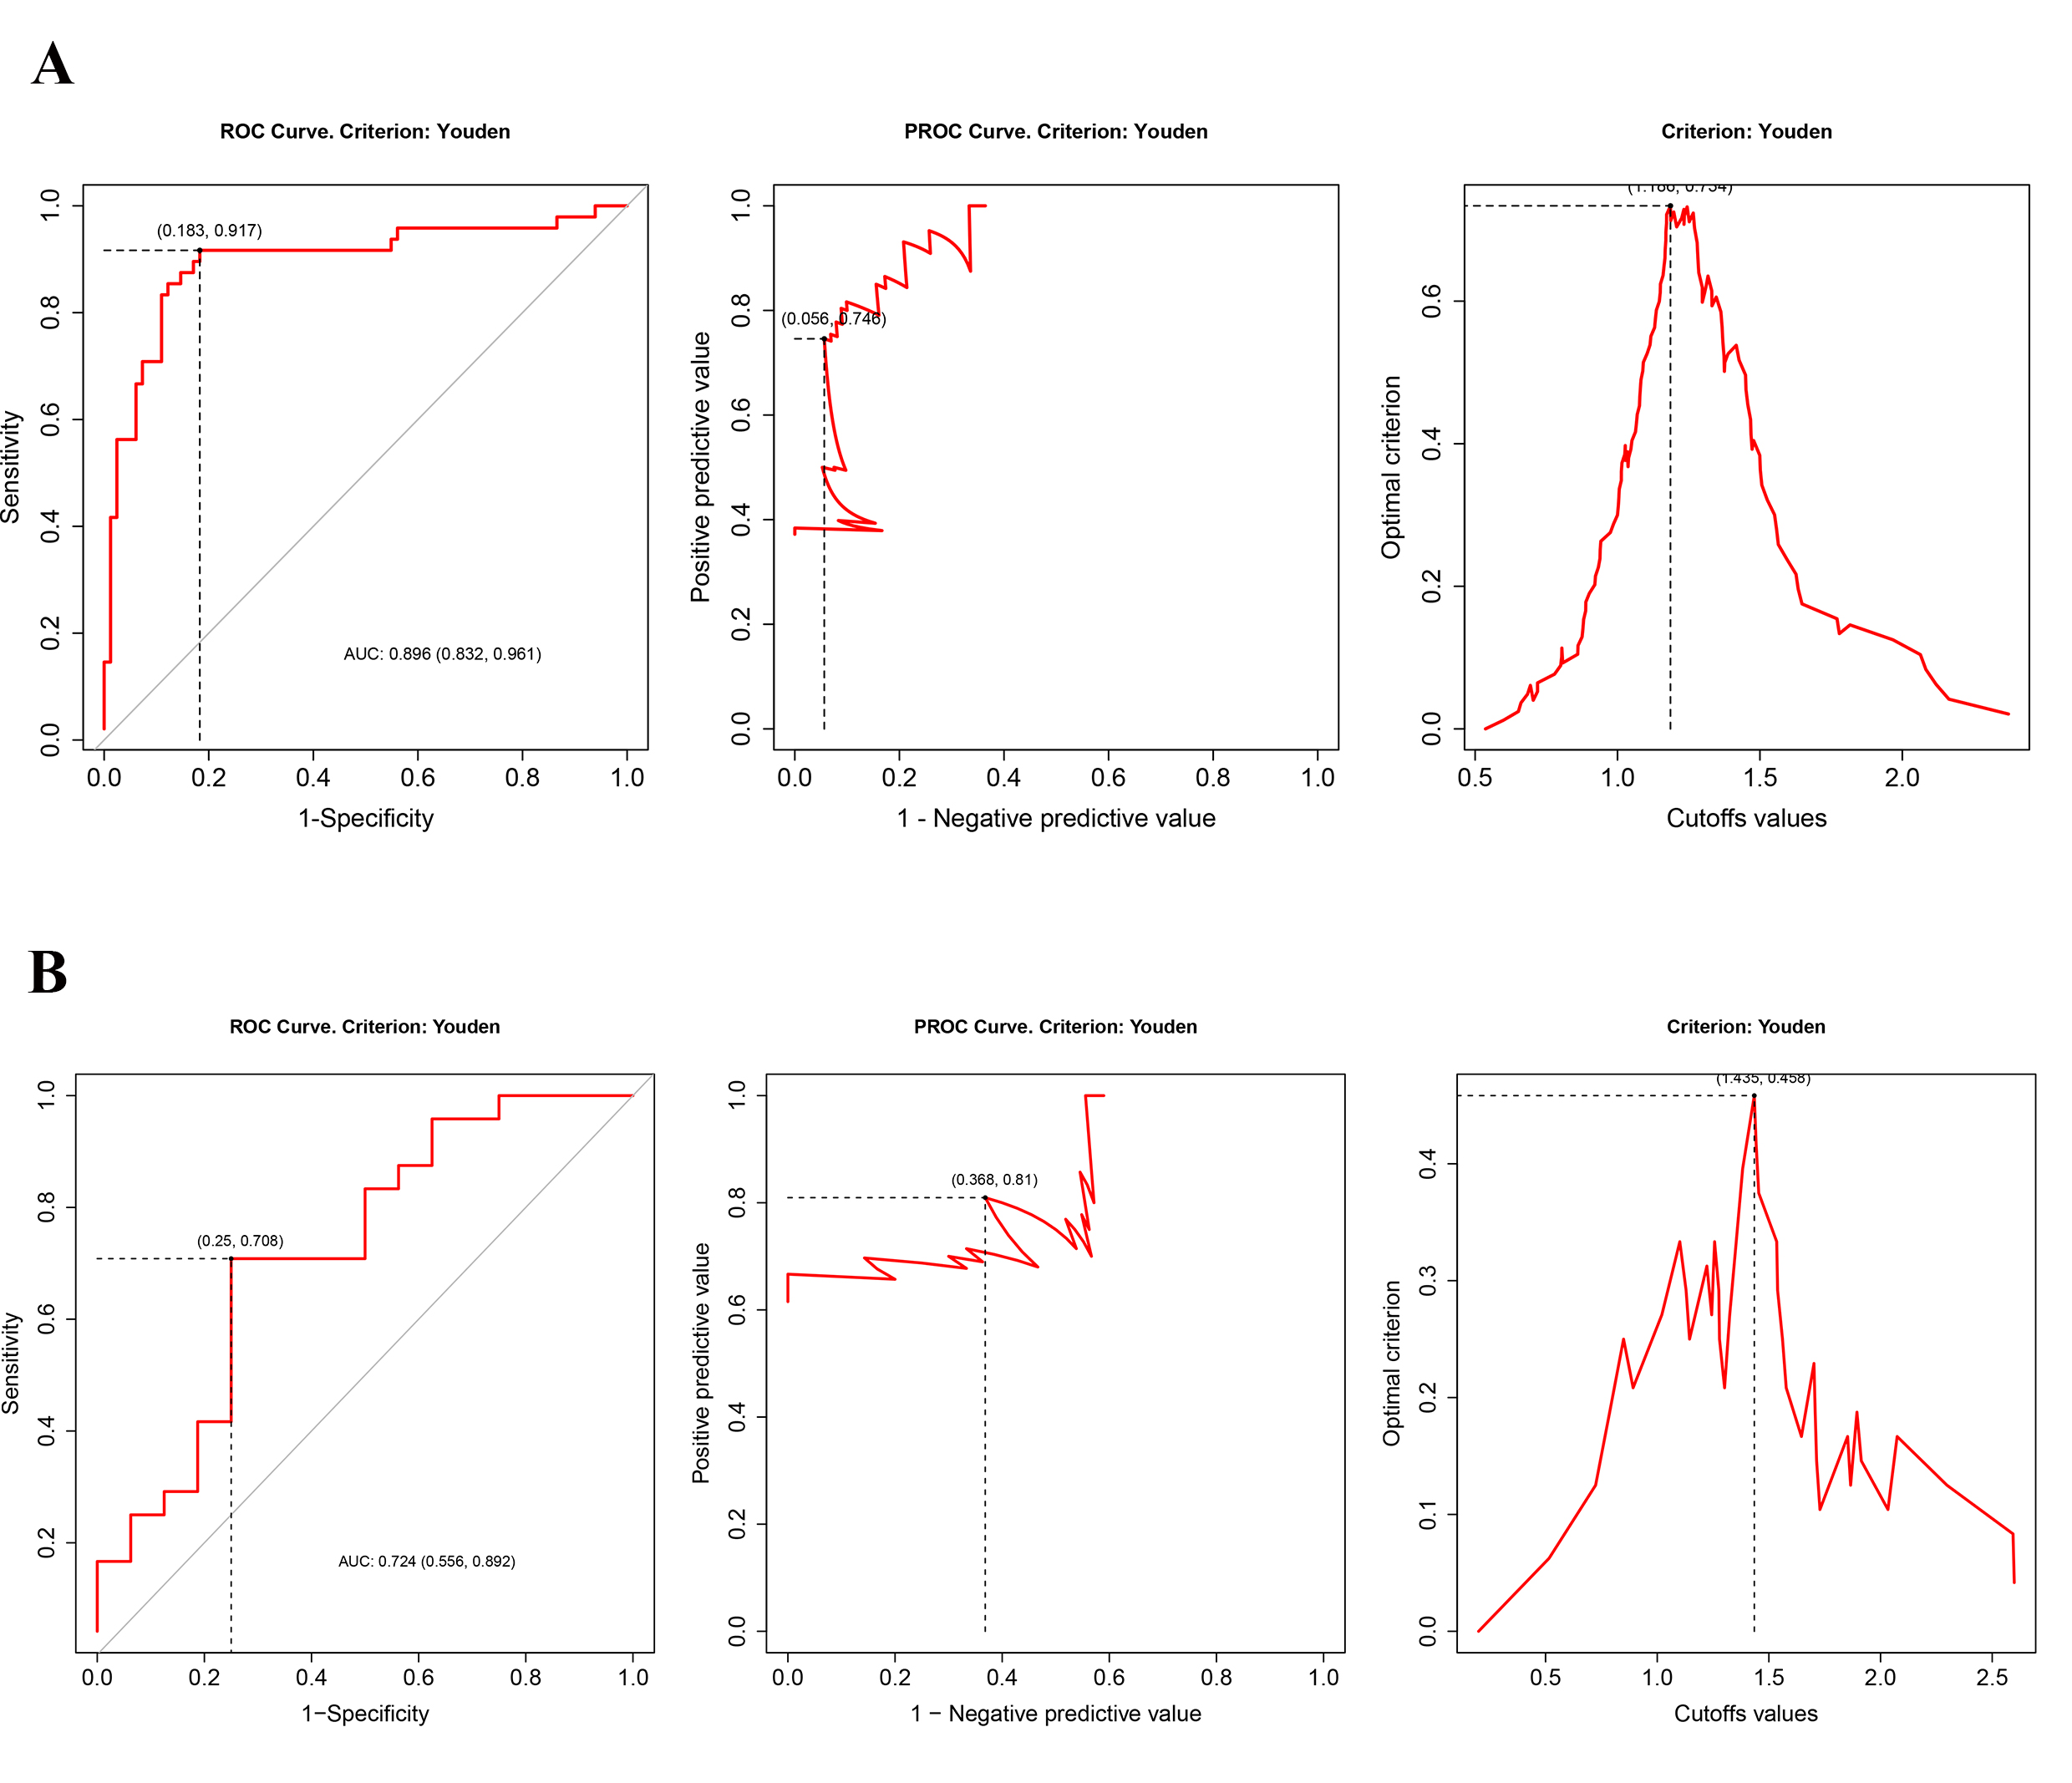
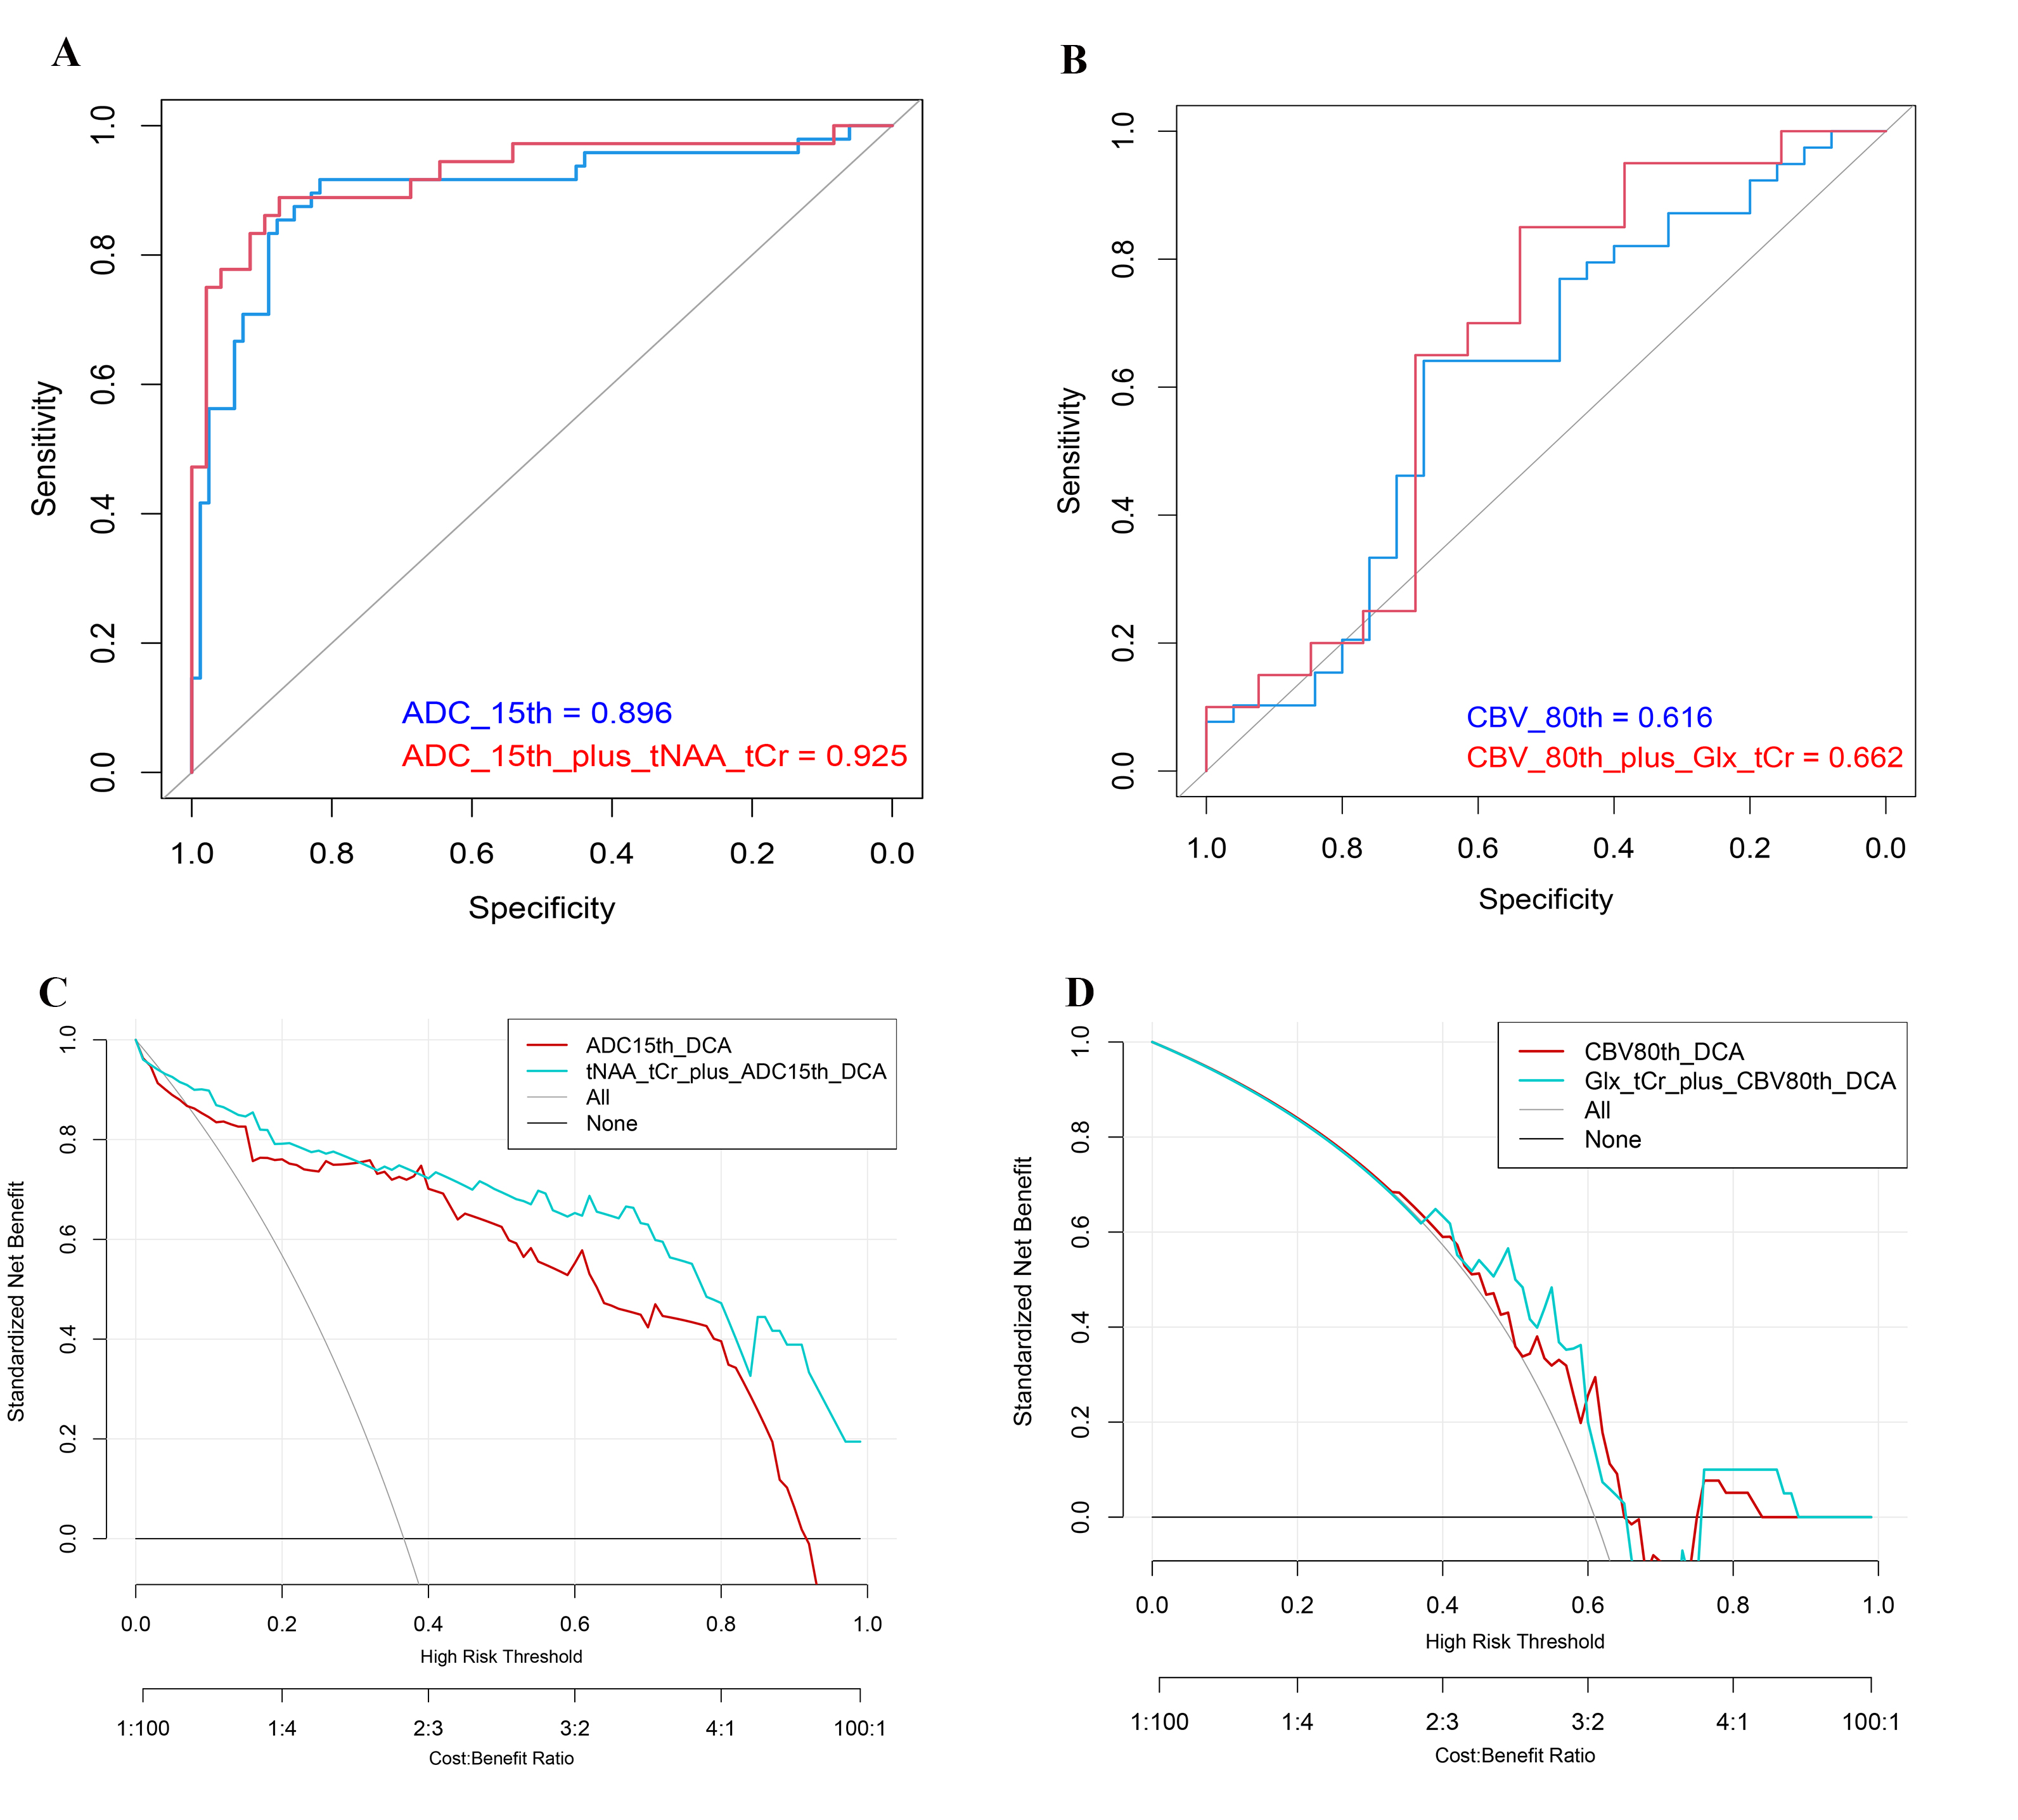
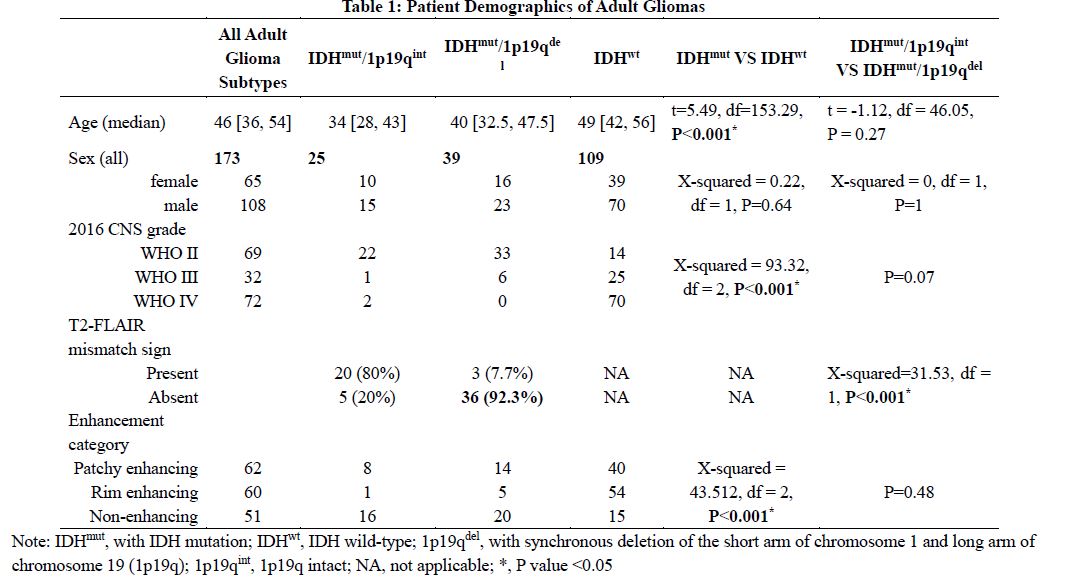
At last, a total of 173 adult-type diffuse gliomas (median, 46 years [36,54]) were involved in this study, including 109 patients with IDH-wildtype gliomas (median, 49 years [42,56]) and 64 patients with IDH-mutant gliomas (39 patients with 1p/19q codeleted, median, 40 years [32.5,47.5]; 29 without 1p/19q codeleted, median, 34 years [28,43]). All patient demographics were detailed reported in Table 1. As shown in Table 1, patients with IDH mutant gliomas were younger than with IDH wild-type gliomas (P<0.001). Although, there was no significant difference of age between 1p/19q-codeleted and 1p/19q intact. Moreover, our study demonstrated that the T2-FLAIR mismatch sign was a highly specific imaging biomarker for the IDH-mut/1p19q non-codeleted gliomas (80%) [16]. In addition, IDH wildtype gliomas were more likely to have tumor enhancement. All ADC models achieved a good classification of IDH status--all AUCs in train cohort and test cohort were higher than 0.84. When taking into account Youden index of train cohort and AUC of test cohort, the model based on ADC_15th metric was the most predictive model. The optimal ADC threshold was 1.186, with a sensitivity of 0.917, specificity of 0.817 and Youden index of 0.734 (AUC, 0.896). In the test cohort, it had a sensitivity of 0.938, specificity of 0.815 and AUC of 0.876. As a result, ADC_15th was the most predictive histogram parameter for identifying IDH status (Figure 2.A.) As a result, the most powerful diagnostic model to predict 1p/19q codeleted status was built by CBV_80th with an AUC of 0.724. The optimal threshold was 1.435 using the Youden index of 0.458, with a sensitivity of 0.708 and a specificity of 0.75 (see Figure 3.B). And it has an AUC of 0.656 in the test set. Then, the AUC of logistic regression model constructed by ADC_15th plus tNAA/tCr was 0.925 in train cohort, which was higher than of model constructed by only ADC_15th (AUC was 0.896, see Figure 3.A). Similarly, the AUC of logistic regression model combined CBV_80th and Glx/tCr outperformed the model constructed by CBV_80th (AUC: 0.662 VS 0.616, see Figure 3.B)DISCUSSION
The main results showed that ADC_15th was the most valuable metric for identifying IDH mutant status, though CBV_80th was more powerful for predicting molecular status in adult gliomas. As reported in prior study, high ADC value was always shown in IDH mutant glioma. The low-ADC was thought to be associated with tumor cellularity and proliferation. And IDH wildtype gliomas had poor survival. As for CBV, it was correlated with vessel density, endothelial proliferation and tumor grade. The higher CBV value in IDH-mutant & 1p/19q codeletion gliomas may be caused by internal vascularization[6]. Based on these results, our results suggested that ADC and CBV intersecting MRS values could separately play potential role as an independent imaging biomarker for aiding in substratification of adult patients with gliomas.CONCLUSION
In summary, histogram metrics of ADC and CBV were powerful for predicting molecular status in adult gliomas. And MRS concentrations could improve diagnostic performance not only in ADC-related model but also in CBV-related model.Acknowledgements
NoneReferences
1. Louis DN, Perry A, Wesseling P, et al. The 2021 WHO Classification of Tumors of the Central Nervous System: a summary. Neuro-oncology. 2021; 23(8):1231-1251.
2. Suh CH, Kim HS, Jung SC, Choi CG, Kim SJ. Imaging prediction of isocitrate dehydrogenase (IDH) mutation in patients with glioma: a systemic review and meta-analysis. European radiology. 2019; 29(2):745-758.
3. Jenkinson M, Beckmann CF, Behrens TE, Woolrich MW, Smith SM. FSL. NeuroImage. 2012; 62(2):782-790.
4. Boonzaier NR, Larkin TJ, Matys T, van der Hoorn A, Yan JL, Price SJ. Multiparametric MR Imaging of Diffusion and Perfusion in Contrast-enhancing and Nonenhancing Components in Patients with Glioblastoma. Radiology. 2017; 284(1):180-190.
5. Edden RA, Puts NA, Harris AD, Barker PB, Evans CJ. Gannet: A batch-processing tool for the quantitative analysis of gamma-aminobutyric acid–edited MR spectroscopy spectra. Journal of magnetic resonance imaging : JMRI. 2014; 40(6):1445-1452.
6. Smits M. MRI biomarkers in neuro-oncology. Nature reviews. Neurology. 2021.
Figures