3043
Mathematically constrained intravoxel incoherent motion (IVIM)1Centre for Advanced Imaging, University of Queensland, Brisbane, Australia, 2Neuroscience Research Centre, St George's, University of London, London, United Kingdom, 3National Physical Laboratory, Teddington, United Kingdom, 4Department of Bioengineering, University of Illinois at Chicago, Chicago, IL, United States, 5Department of Radiology and Imaging Sciences, Emory University, Atlanta, GA, United States, 6School of Mathematical Sciences, Queensland University of Technology, Brisbane, Australia, 7Queensland Brain Institute, University of Queensland, Brisbane, Australia, 8National University Cancer Institute Singapore, National University Hospital, Singapore, Singapore, 9ARC Training Centre for Innovation in Biomedical Imaging Technology, Brisbane, Australia
Synopsis
Intravoxel incoherent motion (IVIM) provides a method of mapping slow and fast diffusion using a two-exponential model. Whilst this method has been applied in acute stroke, brain cancer and muscle, for example, it does have challenges. These include how to best fit the three model parameters which on top of the two diffusion coefficients includes the fast diffusion volume fraction (i.e., perfusion fraction), and how to best sample b-values which lead to robust model parameter fits. Here we propose an approach based on quasi-diffusion which helps constrain the model fit and show reproducibility under different b-value sampling regimes.
Introduction
The mathematical formula defining intravoxel incoherent motion (IVIM) was proposed more than three decades ago,1 and with the increased availability of high field MRI scanners, it has been used widely over the past decade.2 This resurgence led to investigations into how to best fit model parameters,3,4 and model fitting has been shown to produce spurious parameter estimates.5 A clear consensus on whether the slow and fast (i.e., perfusion) diffusion parameters should be fitted together or in two steps has not emerged, and recent investigations into how to best sample the b-values for IVIM suggest an intricate interplay between the method used for fitting and the available sampling points.3,4 These limitations provide an opportunity to propose an approach based on quasi-diffusion,6 addresses shortcomings of existing IVIM methods.Methods
Ethics for the study were granted through institutional ethics committees in accordance with the national guidelines. The data is from a larger glioblastoma study, and the two participants used in this study were both diagnosed with glioblastoma. Slice-by-slice MRI data were acquired using a 3T Siemens (Biograph mMR PET-MRI) scanner. Pre- and post-contrast T1-weighted images were acquired: TE = 1.04ms, TR = 2.69ms, in-plane resolution = 1.25mm x 1.25mm, slice thickness = 3mm.The diffusion-weighted IVIM data consisted of 16 b-values = 0, 10, 20, 40, 80, 110, 140, 170, 200, 300, 400, 500, 600, 700, 800, 900s/mm2, and additionally TE = 66ms, TR = 3700ms, in-plane resolution = 1.875mm x 1.875mm, slice thickness = 4mm for the data acquisition. We considered two distinct sampling regimes, including the use of all 16 b-values, and another based on three b-values alone (0, 170, 900). Figure 1 shows and example voxel from participant 1 with the b-value sampling (red + black = 16 b-values; red = 3 b-values). This b-value sampling choice was based on recent experimental findings,7 and in view of theoretical considerations suggesting an approximately log-linear sampling regime for fitting of multi-exponential models.8
Figure 1 shows the relationship employed in generating IVIM model parameters. The original IVIM model is SIVIM (4-parameter model; S0 – signal at b = 0, D1 – slow diffusivity, D2 – fast diffusivity, v volume fraction corresponding with D2) and SQD (3-parameter model; S0 – signal at b = 0, D – anomalous diffusivity, β – anomalous diffusion exponent) is the recently proposed quasi-diffusion model and SLAP (2-3-parameter model given D and β are known; $$$\hat{S_0}$$$ signal at b = 0, r1 and r2 are diffusion spectrum parameters which by definition scale D such that D1 < D and D2 > D) is an intermediate model allowing us to make a link between SQD and SIVIM. The SLAP model is obtained by expanding the QD model using Laplace transforms (LAP for Laplace).9
The 16 b-value IVIM fit was obtained by first dividing the data by the b = 0 data (i.e., S0) and then fitting for D1 (slow diffusion) based on the seven largest b-values, after which a second stage fit for D2 and v was performed. SLAP parameters were obtained by first fitting the SQD model and transferring the QD parameters to the SLAP model and r1 and r2 were then fitted. Note, this process mathematically constrains the coefficients of the exponential through the notion of the diffusion spectrum in relation to anomalous diffusion.10
Results and Discussion
Figure 2 provides the IVIM and LAP results for the first participant, and for two different brain slices when all 16 b-values are used for parameter estimation. At the top an area around the Circle of Willis is shown, as an illustration of large perfusion. The bottom two rows show the region affected by glioblastoma. The pre- and post-contrast images are provided as verification for the region of interests. For the same patient Figure 3 provides the sub-sampled b-value result. Figure 4 and 5 similarly provide the results for the second study participant.In Figures 2 and 4 (IVIM result in top row) the limitations of not using a specific b-value sampling is elucidated through the D2 estimate. As proposed recently,7 this limitation is overcome by adhering to a specific sampling strategy (see Figure 3 and 5 where b-value range has been sub-sampled). Noticeably, the proposed approach performs well irrespective of sampling (compare LAP results between Figures 2 and 3, and Figures 4 and 5). A hallmark of brain cancer, and particularly glioblastoma, is the formation of new blood microvessels in the cancer proliferating region. It appears that our proposed approach provides better sensitivity to changes in perfusion volume fraction (compare v maps in Figures 3 and 5).
Conclusion
If careful attention has not been paid to b-value sampling, the mathematically constrained IVIM approach can produce consistent IVIM parameter estimates. Further investigations should be conducted to establish where the proposed approach breaks down, and how well the mapped changes in glioblastoma corresponds with parameters from dynamic contrast enhanced MRI. This will then lead to an understanding of how changes in D2 and v reflect necrosis versus regions of tumour proliferation and new microvessel formation. Lastly, our findings suggest that retrospective IVIM data could be reprocessed using the outlined mathematically constrained approach to improve IVIM parameter estimates.Acknowledgements
The idea for mathematically constrained IVIM was conceived through discussions in the Anomalous Relaxation and Diffusion Study group, hosted by the Centre for Advanced Imaging, University of Queensland, Brisbane, Australia (cai.uq.edu.au/webinars). Founding members of the study group include TB, MGH, MK, RM, DR and QY (Yang), with VV leading this research. As such, contribution from founding members is acknowledged in alphabetical order. VV and QY (Yang) were supported by an ARC Discovery grant (DP190101889). QY (Yang) was also supported by an ARC DECRA fellowship grant (DE150101842).
References
1. D. Le Bihan, et al, Separation of diffusion and perfusion in intravoxel incoherent motion MR imaging. Radiology, 1988, 168(2): 497-505.
2. D. Le Bihan, What can we see with IVIM MRI? Neuroimage, 2019, 187: 56-67.
3. O.J. Gurney-Champion, et al, Comparison of six fit algorithms for the intra-voxel incoherent motion model of diffusion-weighted magnetic resonance imaging data of pancreatic cancer patients. Plos One, 2018, 13: 0194590.
4. O. Jalnefjord, et al, Comparison of methods for estimation of the intravoxel incoherent motion (IVIM) diffusion coefficient (d) and perfusion fraction (f). Magnetic Resonance Materials in Physics, Biology and Medicine, 2018, 31: 715-723.
5. Y.-C. Hu, et al, Can the low and high b-value distribution influence the pseudodiffusion parameter derived from IVIM DWI in normal brain? BMC Medical Imaging, 2020, 20: 14.
6. T. Barrick, et al, Quasi-diffusion magnetic resonance imaging (QDI): A fast, high b-value diffusion imaging technique. NeuroImage, 2020, 211: 116606.
7. O. Jalnefjord, et al, Optimization of b-value schemes for estimation of the diffusion coefficient and the perfusion fraction with segmented intravoxel incoherent motion model fitting. Magnetic Resonance in Medicine, 2019. 82: 1541-1552.
8. A. Istratov and O.F. Vyvenko, Exponential analysis in physical phenomena. Review of Scientific Instruments, 1999, 70: 1233-1257
9. P.H. Lam, et al, Exponential sum approximation for Mittag-Leffler function and its application to fractional Zener wave equation. Journal of Computational Physics, 2020, 410: 109389.
10. T. Barrick, et al, The mathematics of quasi-diffusion magnetic resonance imaging. Mathematics, 2021, 9(15): 1763.
Figures


Figure 2. Results for the first study participant when all 16 b-values were used for estimating parameters D1, D2 and v. The IVIM and Laplace results are for two distinct slices: top two rows around the Circle of Willis, and the bottom two rows around the glioblastoma. On the right pre- and post-contrast T1-weighted images are provided as verification for the regions identified in v maps.
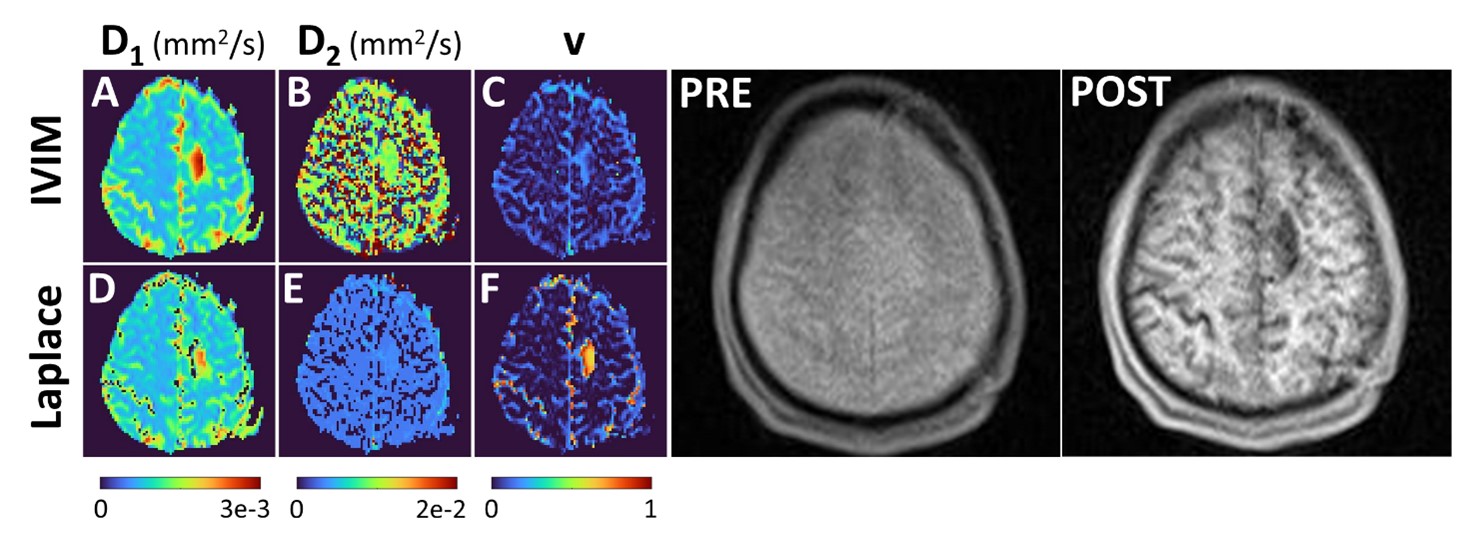
Figure 3. Results for the second study participant when all 16 b-values were used for estimating parameters D1, D2 and v. The IVIM and Laplace results are for the glioblastoma region. On the right pre- and post-contrast images are provided as verification for the regions identified in v maps.
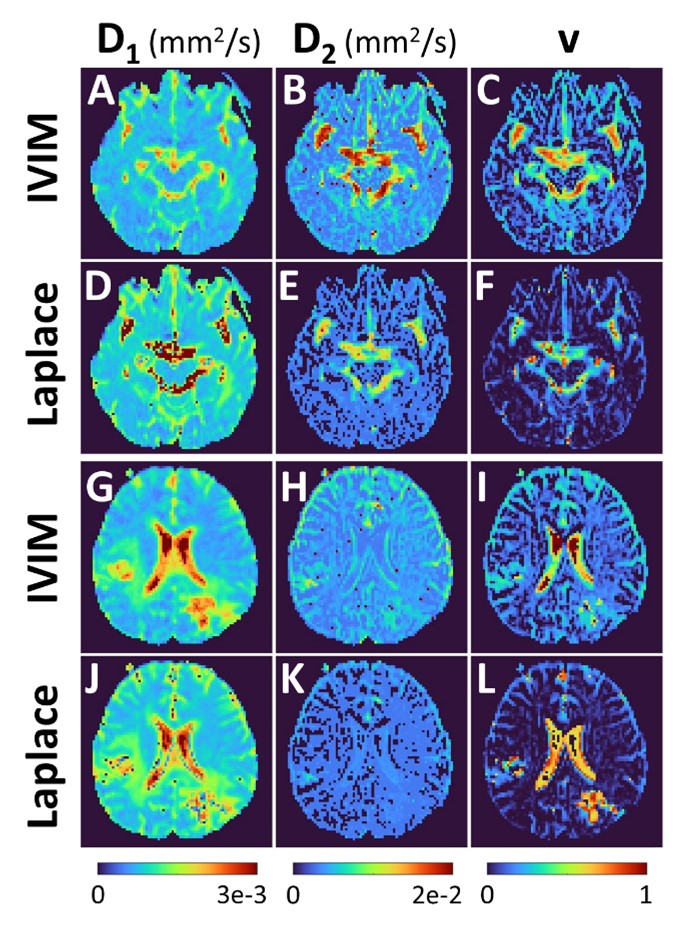
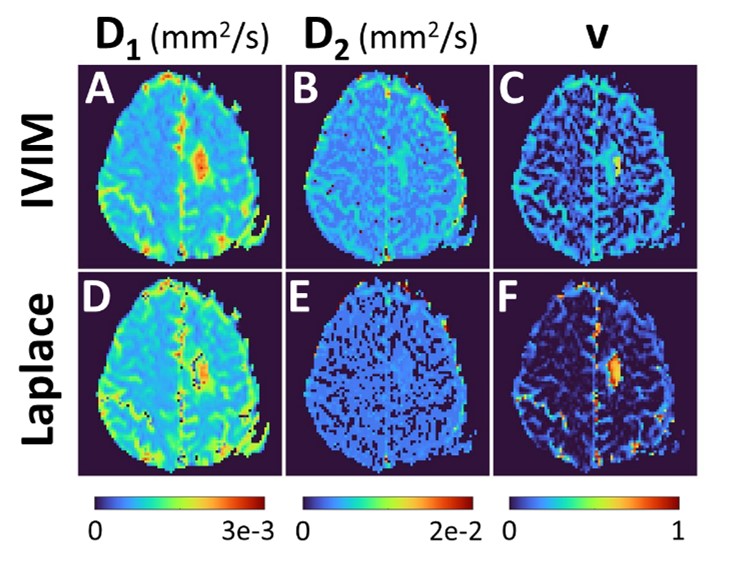
Figure 5. Results for the second study participant when b-values were sub-sampled prior to estimating parameters D1, D2 and v. The IVIM and Laplace results are for the glioblastoma region.