3039
Modelling the Brain Functional Difference of Movie Watching and Resting State with Autoencoder1School of Biomedical Engineering, University of Sydney, Sydney, Australia, 2Brain and Mind Centre, University of Sydney, Sydney, Australia, 3Sydney Imaging, University of Sydney, Sydney, Australia
Synopsis
The human brain is a complex dynamic system. Understanding the functional difference of the brain between the resting state and performing tasks helps to decipher the functional brain architecture. In this work, we trained an autoencoder to optimally reconstruct the resting state fMRI (rs-fMRI) data of 50 subjects, and this model was subsequently used to reconstruct the movie watching fMRI (mw-fMRI) data of the same subjects. We have compared the reconstruction error between movie watching and resting state, and significant regional functional differences were found.
Introduction
Like other complex systems, such as the WorldWideWeb1, the human brain has its own network architecture. Understanding the functional architecture of the human brain should help further our understanding of cognition and mental disorders. fMRI has been widely employed to study brain function; in particular, stable brain networks can be found using resting state fMRI (rs-fMRI)2. Another type of fMRI, movie watching fMRI (mw-fMRI), is acquired in more natural conditions and involves continuous rich stimuli, so this technique records closer-to-real-life brain activities3, 4. In this study, we have employed the autoencoder, a deep learning method, to reconstruct the rs-fMRI time series. The encoder of the autoencoder compresses and extracts features from the input and the decoder reconstructs the input using features found by the encoder5. An autoencoder that can optimally and stably reconstruct rs-fMRI can be seen as a representation of the resting state functional brain architecture. We use the trained autoencoder with rs-fMRI to process mw-fMRI data; the residuals of the reconstruction can be used to characterise the functional changes associated with movie watching.Methods
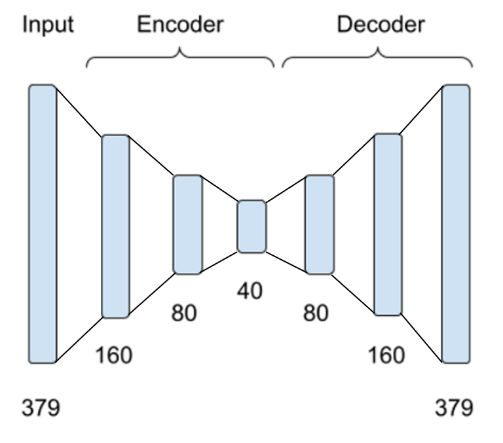
This study uses 7T fMRI data of 50 young healthy adult subjects from the Human Connectome Project (HCP)6. Two types of fMRI data were considered: rs-fMRI and mw-fMRI. In addition to the minimal pre-processing7, the data underwent further preprocessing steps, including spatial smooth (FWHM=6mm) and temporal filtering (0.01-0.1HZ). The brain was parcellated into 379 regions using multi-model parcellation (MMP) atlas8, and the fMRI signals of the 379 regions were set as the input of the autoencoder.The autoencoder encoded the input data into 160, 80, and 40 latent nodes successively and reconstructed the data for 379 regions from 40 latent network nodes with a symmetric structure, as shown in Figure 1. 5-fold cross-validation was used to train and test the autoencoder so that 50 subjects were split into 5 groups (10 subjects per group). In each group, the 10 subjects were used for testing and the other 40 subjects were used for training. Rs-fMRI data were used to train this model. After the model converged, the model was applied to reconstruct rs-fMRI and mw-fMRI data that were never seen by the autoencoder. Thus, all 50 subjects were used for testing. The regional mean squared error (MSE) between reconstruction input and output fMRI data (normalised to 0-1 range) was calculated for each fMRI session to indicate the reconstruction deviation. We performed a pairwise t-test for MSE of each brain region between mw-fMRI and rs-fMRI sessions of the same 50 subjects. The false discovery rate (FDR) correction9 was applied to adjust the p-values, with p<0.05 and z>1.65 used to find significant differences.
Results
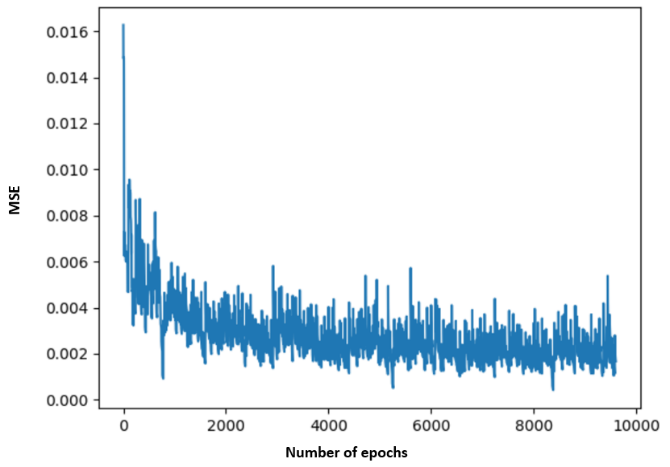
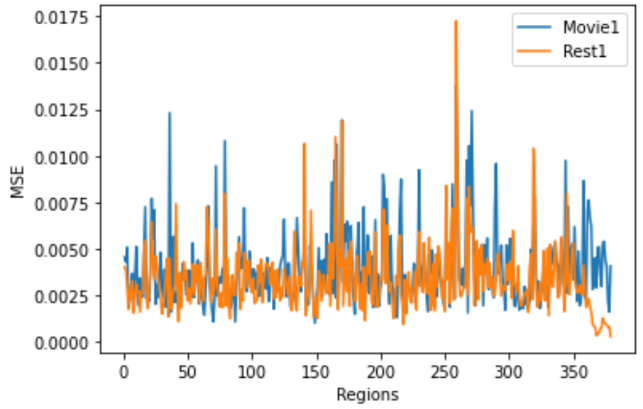
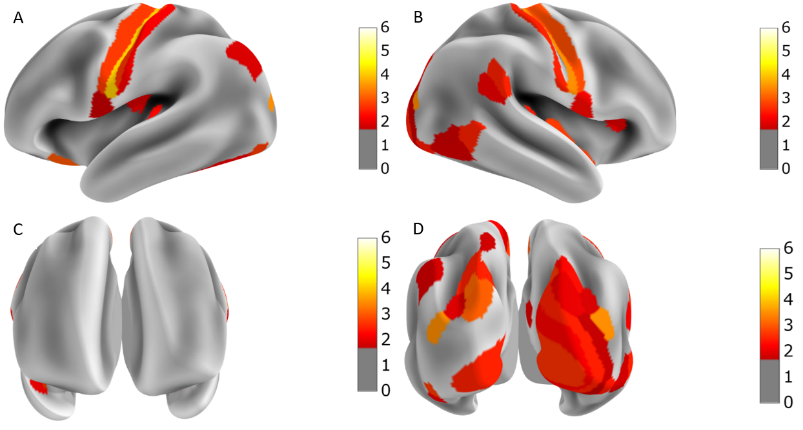
The MSE during training converged below 0.005, as shown in Figure 2. The regional MSE calculated for both rs-fMRI and mw-fMRI were mostly below 0.01, as shown in Figure 3, which indicates that the trained autoencoder can properly reconstruct the fMRI data. However, we detected significant differences when comparing the regional MSE between rs-fMRI and mw-fMRI. The regional t-tests detected 49 distinct regions, with p-values (FDR corrected) below 0.05. We further translated the p-value into z-scores and mapped them on the inflated brain surface, as shown in Figure 4. Only regions with z>1.65 were colour coded in Figure 4. The higher z-score indicates more significant differences.Discussion
According to the results of the regional t-test between mw-fMRI and rs-fMRI, the MSE showed significant differences in 49 regions. As shown in Figure 4, significant differences were shown in the motor cortex, visual cortex and some regions in the attention network10. This is a strong indication that the deep learning model trained with rs-fMRI represents the resting state functional architecture and does not fully reflect the variation induced by cognitive tasks, such as movie watching. Specifically, mw-fMRI involved visual stimuli, which evokes complex activity at the visual cortex, thus, introducing the difference in terms of MSE. The movie clips are intrinsically coded with motion or movement elements, which could lead to activation of the motor cortex. Therefore, we also observed significant differences in the motor cortex. Moreover, movie watching naturally activates the attention network so that we can also see significant differences in regions, including the inferior parietal sulcus, superior parietal lobe and the temporal-parietal junction.Conclusion
The deep learning model, autoencoder, can be trained to optimally represent the resting state brain function. However, when it is used to decode the mw-fMRI, significant differences can be found in the reconstruction error. This difference reflects the functional change caused by performing the external task, i.e., movie watching. In future research, we plan to perform a similar analysis on the wide range of cognitive task fMRI in the HCP dataset. We will also further investigate the latent signal sources modelled by the autoencoder so that we can better understand the functional mechanism of the human brain.Acknowledgements
References
1. Ravasz E, Barabási A-L. Hierarchical organisation in complex networks. Physical review E. 2003;67(2):026112.
2. Li K, Guo L, Li G, et al. Cortical surface based identification of brain networks using high spatial resolution resting state fMRI data. IEEE; 2010:656-659.
3. Hasson U, Nir Y, Levy I, Fuhrmann G, Malach R. Intersubject synchronisation of cortical activity during natural vision. science. 2004;303(5664):1634-1640.
4. Bartels A, Zeki S. The chronoarchitecture of the human brain—natural viewing conditions reveal a time-based anatomy of the brain. Neuroimage. 2004;22(1):419-433.
5. Wang S, Ding Z, Fu Y. Feature Selection Guided Auto-Encoder. Proceedings of the AAAI Conference on Artificial Intelligence. 02/13 2017;31(1).
6. Van Essen DC, Smith SM, Barch DM, et al. The WU-Minn human connectome project: an overview. Neuroimage. 2013;80:62-79.
7. Glasser MF, Sotiropoulos SN, Wilson JA, et al. The minimal preprocessing pipelines for the Human Connectome Project. Neuroimage. 2013;80:105-124.
8. Glasser MF, Coalson TS, Robinson EC, et al. A multi-modal parcellation of human cerebral cortex. Nature. 2016;536(7615):171-178.
9. Benjamini Y, Hochberg Y. Controlling the false discovery rate: a practical and powerful approach to multiple testing. Journal of the Royal statistical society: series B (Methodological). 1995;57(1):289-300.
10. Fox MD, Corbetta M, Snyder AZ, Vincent JL, Raichle ME. Spontaneous neuronal activity distinguishes human dorsal and ventral attention systems. Proceedings of the National Academy of Sciences. 2006;103(26):10046-10051.
Figures