3038
Food pictures versus corresponding calorie information stimuli: an event-related fMRI study at 7 T of brain response differences in adult males1Institute of Science and Technology for Brain-Inspired Intelligence, Fudan University, Shanghai, China, 2Human Phenome Institute, Fudan University, Shanghai, China, 3MR Collaboration, Siemens Healthineers Ltd., Shanghai, China
Synopsis
Balancing food calories and nutrients has become a great concern for contemporary young people. In this study, we found that the calorie information of food activates the response of left middle occipital gyrus, which is related to the current sense of individual satiety. Therefore, it is likely that a sensory hub of the digestive system, corresponding to the visual stimulation of food, is existing.
Introduction
In recent years, the incidence rate of type 2 diabetes is increasing worldwide. Obesity is one of the complications of type 2 diabetes, which seriously interfere in normal life of patients 1. As for people who are losing weight, the daily calorie intake will become the most cautious aspect. In addition, nutrient composition of food is also a dietary concern of contemporary young people. Some works have been devoted to the brain activation or inhibition from food pictures on appetite, emotion and physiology 2,3, while the calorie content of food is only divided as a simple division condition. In this study, through an event-related fMRI by visual stimulation at 7 T, we investigated how the corresponding information after food/non-food picture stimuli affects the brain response.Materials and Methods
We recruited 23 healthy males (age 23.6 ± 2.1, BMI < 24) of Chinese ethnicity in order to participate in this event-related fMRI research. Participants were asked to abstain from eating for a whole night (~ 12 h prior to the experimental session in the morning). Before scans, participants were required to completed a visual analogue scale (VAS, 12 items) to self-report current gastrointestinal subjective feelings 4.All scans were performed on a 7.0 T MRI scanner (SIEMENS, MAGNETOM Terra) at Zhangjiang Brain Imaging Center (Fudan University, Shanghai, China). The functional images covering the whole brain were collected using an echo-planar imaging (EPI) sequence with following acquisition parameters: TR = 1500 ms, TE = 25 ms, 128 × 128 matrix, number of slices = 96, slice thickness = 1.5 mm. There are 2 tasks with picture/information stimulus, and 3 conditions were set: 40 food pictures (divided into 4 categories as sub-conditions), 40 non-food pictures, and purple crossing as resting (Figure 1). In task 1, participants were viewing a series of food and non-food pictures pseudo-randomly (Figure 1. (i)). In task 2, information of pictures with the same pseudo-random order are calorie equation of food and category of non-food thing in pictures (Figure 1. (ii)). For both, participants should not only just keep watching pictures on the screen, but also judge whether it is “food or non-food”, and press the button (food-index finger, non-food-middle finger, right) as accurately and quickly as possible. All pictures were from an image database, Food-pics 5, 6.
We used SPM12 (http://www.fil.ion.ucl.ac.uk/spm) and BrainNet Viewer 7 for data analysis. We collected 230 EPI volumes for each session of task and finally used 214 of these according to sequence trigger test, which were realigned and unwrapped to the mean image, normalized to MNI standard stereotactic space, resampled to isotropic 3 mm voxels and smoothed with a 6 mm full width at half maximum (FWHM) Gaussian kernel. For the second level random effects analyses, we used Paired-sample t-test to analyze the differences from additional information. The significant level was set at p < .05, FWE-corrected. In correlation analysis, we selected item 3, 4, 5, 7 in VAS to investigate the relationship between food-picture/information stimulus and subjective feelings such as appetite (Pearson correlation, p < .01) using SPSS v.20.0 (Chicago, USA).
Results
On 3 conditions in 2 tasks, comparing Non-food vs. Crossing items, it revealed activity mainly in frontal gyrus, occipital gyrus, middle frontal gyrus, precuneus and angular gyrus was significantly decreased, and comparing Food vs. Non-food items, activity in middle occipital gyrus (MOG) was increased (Figure 2), while there was no significant activity difference comparing Food vs. Crossing. No significant correlation was shown between activity of Food vs. Non-food items and VAS.In addition, on 4 sub-conditions, comparing Sweet/Carbohydrate (Ch) vs. Crossing items, it revealed activity differences during task 2, mainly in fusiform gyrus and MOG was significantly increased (Figure 3). But there was no significant activity difference comparing Fruit or Protein (FP) / Fruit or Vegetable (FV) vs. Crossing. In task 1, activity in MOG is significantly correlated with item 7 in VAS for Sweet/Ch vs. Crossing (r = -.566, p = 0.005 / r = -.611, p = 0.002), while there is no significant result in task 2 and fusiform gyrus.
Discussion and Conclusion
In previous study, the anterior part of the right MOG showed processing spatial properties with auditory and tactile stimuli in early blind 8,nevertheless in normal subjects, it is generally believed that MOG plays an important role in human visual cortex 9. In this study, we found that the left MOG showed a stronger response when dealing with food calorie information, especially when stimulated by pictures of sweet and carbohydrate foods. In particular, this area was negatively correlated with the physical feeling of satiety during scanning. Therefore, the left MOG is not only a visual hub, but also a sensory hub closely related to the sensation of the digestive system in potential. It is worth noting that when all food pictures compared, the activation of some areas is erased, which indicates that we need to carefully distinguish the effects of different tastes, calories and dietary preferences on activity in future research.Acknowledgements
This work was supported by the National Natural Science Foundation of China (No. 81971583), National Key R&D Program of China (No. 2018YFC1312900), Shanghai Natural Science Foundation (No. 20ZR1406400), Shanghai Municipal Science and Technology Major Project (No.2017SHZDZX01, No.2018SHZDZX01) and ZJLab. Additionally, Fanwen Wang is also helpful for this work!References
1. Cheloni R, Gandolfi SA, Signorelli C, Odone A. Global prevalence of diabetic retinopathy: protocol for a systematic review and meta-analysis. BMJ Open. 2019 Mar 3;9(3):e022188.
2. Blechert J, Klackl J, Miedl SF, Wilhelm FH. To eat or not to eat: Effects of food availability on reward system activity during food picture viewing. Appetite. 2016 Apr 1;99:254-261.
3. Miedl SF, Blechert J, Meule A, Richard A, Wilhelm FH. Suppressing images of desire: Neural correlates of chocolate-related thoughts in high and low trait chocolate cravers. Appetite. 2018 Jul 1;126:128-136.
4. Sepple CP, Read NW. Gastrointestinal correlates of the development of hunger in man. Appetite. 1989 Dec;13(3):183-91. doi: 10.1016/0195-6663(89)90011-1. PMID: 2596841.
5. Blechert J, Meule A, Busch NA, Ohla K. Food-pics: an image database for experimental research on eating and appetite. Front Psychol. 2014 Jun 24;5:617.
6. Blechert J, Lender A, Polk S, Busch NA, Ohla K. Food-Pics_Extended-An Image Database for Experimental Research on Eating and Appetite: Additional Images, Normative Ratings and an Updated Review. Front Psychol. 2019 Mar 7;10:307.
7. Xia M, Wang J, He Y. BrainNet Viewer: a network visualization tool for human brain connectomics. PLoS One. 2013 Jul 4;8(7):e68910.
8. Renier LA, Anurova I, De Volder AG, Carlson S, VanMeter J, Rauschecker JP. Preserved functional specialization for spatial processing in the middle occipital gyrus of the early blind. Neuron. 2010 Oct 6;68(1):138-48.
9. Wandell BA, Dumoulin SO, Brewer AA. Visual field maps in human cortex. Neuron. 2007 Oct 25;56(2):366-83.
Figures
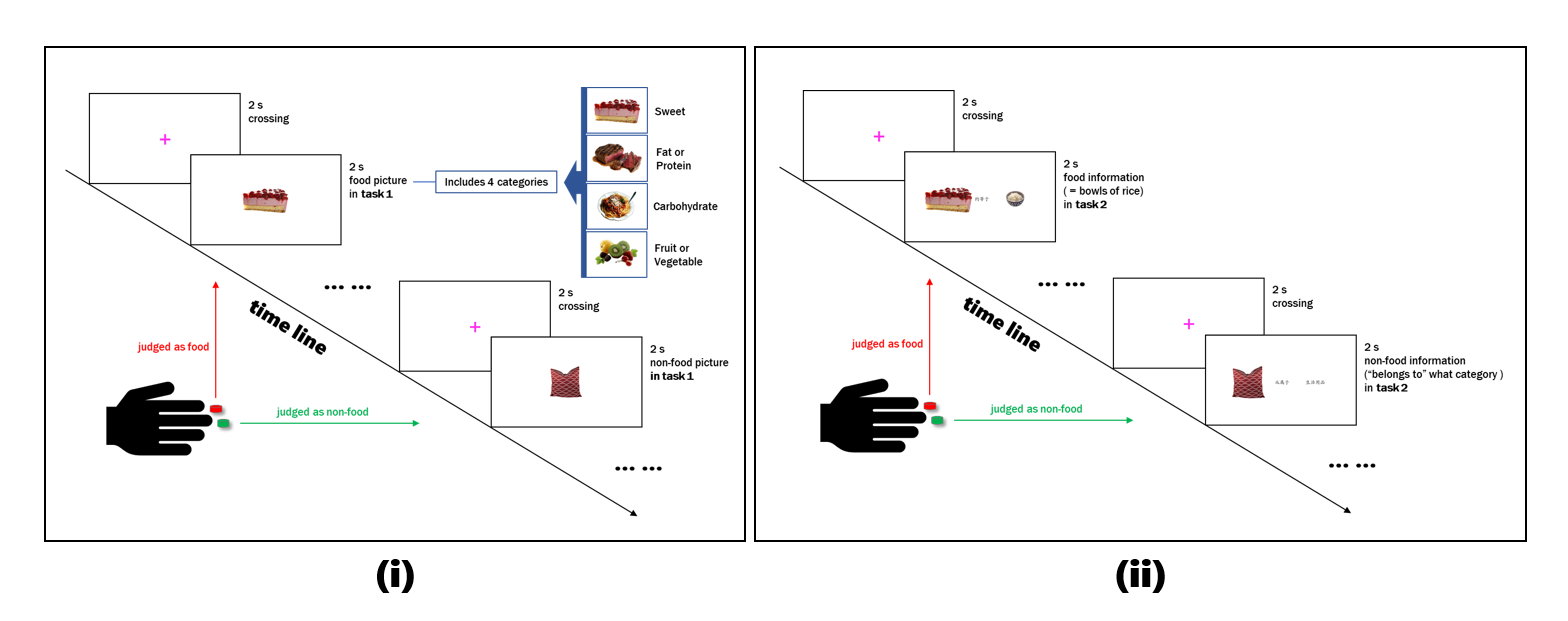
Figure 1. Outline of tasks. Right handed participants were asked to press the button with index/middle finger when stimulus appeared. (i) Task 1: For each stimulus, one food/non-food picture shows in the center of screen after a purple crossing (lasting 2 s both). 4 Food categories are Sweet, FP, Ch and FV. (ii) Task 2: For each stimulus, the information of food/non-food picture shows on the screen before a purple crossing dismissing. Information is the calorie of food (" ≈ " how many bowls of rice) / the category of non-food (“belongs to” what category) in the picture. Others are same as (i).
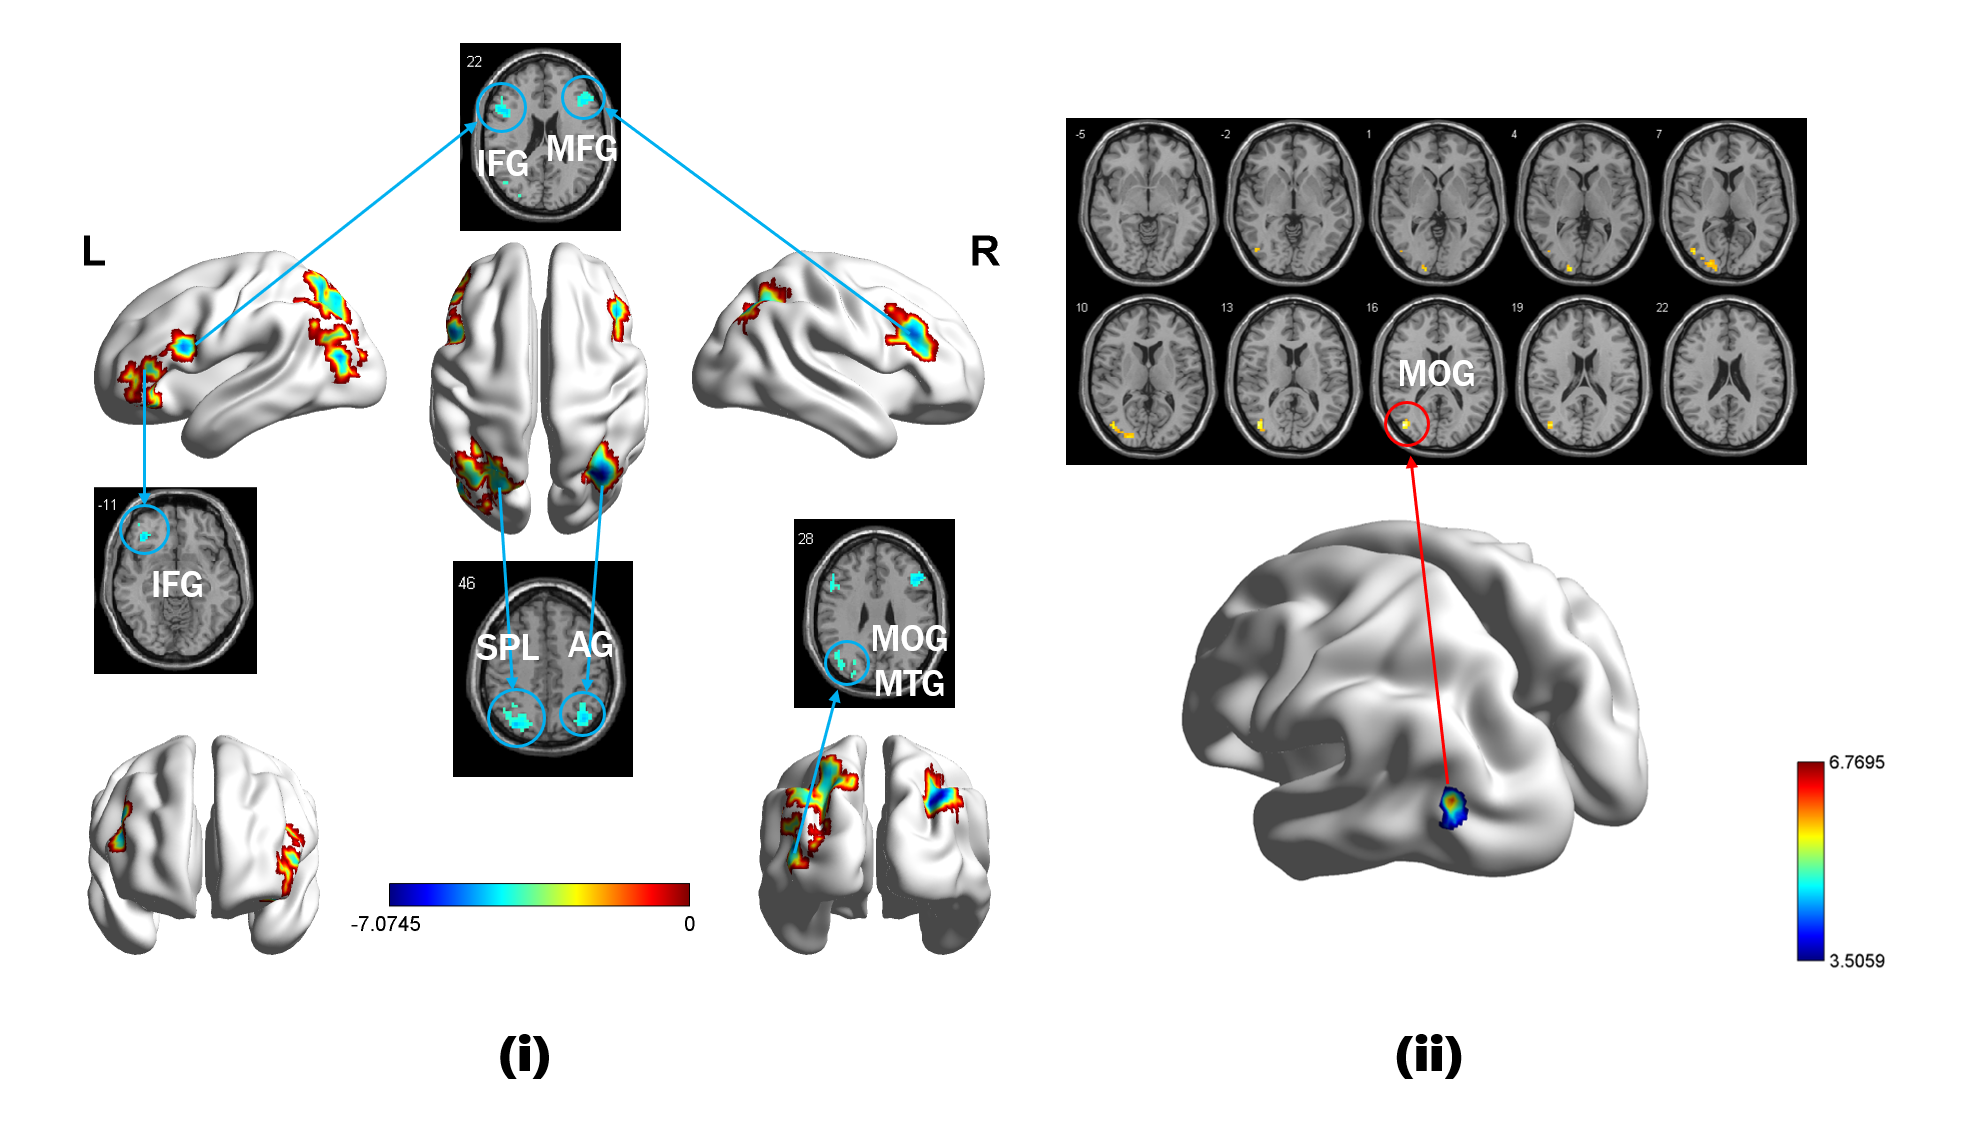
Figure 2. (i) Non-food vs. Crossing items, negative activity. (ii) Food vs. Non-food items, positive activity. IFG, inferior frontal gyrus; MFG, middle frontal gyrus; SPL, superior parietal lobule; AG, angular gyrus; MOG, middle occipital gyrus; MTG, middle temporal gyrus; L, left; R, right. Colorbar, T value.
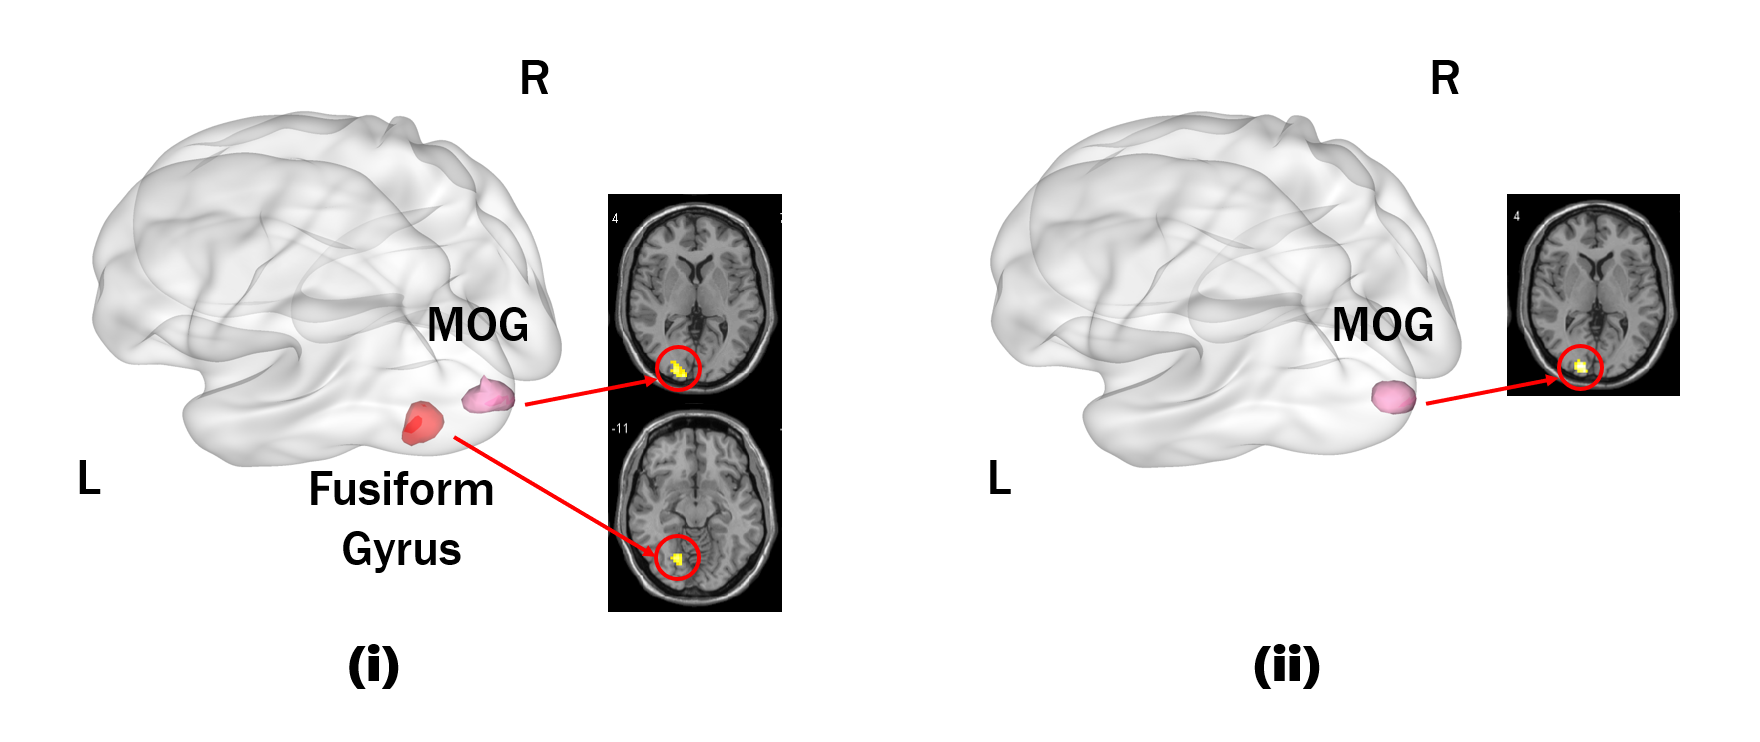
Figure 3. (i) Sweet vs. Crossing items, positive activity. (ii) Ch vs. Non-food items, positive activity. MOG, middle occipital gyrus; L, left; R, right.