3037
Improved reliability of functional connectivity with multi-echo task fMRI1GE Global Research, Bangalore, India, 2GE Healthcare, Niskayuna, NY, United States, 3GE Global Research, Niskayuna, NY, United States, 4GE Healthcare, Buc, France, 5Walter Reed National Military Medical Center, Bethesda, MD, United States
Synopsis
Signal from conventional single-echo fMRI depends on multiple factors including cerebral metabolic rate for oxygen (CMRO2), blood flow (CBF) and blood volume (CBV). Interpretation of functional connectivity analyses derived from conventional single-echo fMRI is complicated due to coupling of various factors in the fMRI signal. In this work, we use multi-echo task-fMRI to estimate functional connectivity from fluctuations in R2* (transverse relaxation rate) assumed to be surrogates for fluctuations in CMRO2. We also investigate the similarities and differences between single-echo and R2* multi-echo fMRI derived functional activation in a visuo-motor decision task paradigm.
Introduction
Neuronal functional connectivity is typically assessed from blood oxygen level-dependent (BOLD) MRI signal contrast using gradient-echo echo-planar-imaging (EPI) based single-echo fMRI1. fMRI signal intensity depends on multiple factors including cerebral metabolic rate for oxygen consumption (CMRO2), blood volume (CBV), blood flow (CBF), other non-BOLD physiological factors (such as hematocrit concentration, cardiac rate, breathing rate and end tidal inhalation volume), head motion, magnetic field-strength and inhomogeneity2,3. CMRO2, CBV and CBF are typically altered concomitantly due to neuronal activity4. However, neurovascular coupling in MRI signal is known to vary across brain regions and across participants, rendering quantitative interpretation of functional connectivity complicated. Separating BOLD signal from non-BOLD fluctuations will help us better understand functional brain organization specific to metabolic demand. In this work, we evaluated single-echo fMRI, R2*, and a T2*-weighted optimal combination of multi-echo fMRI in terms of sensitivity and specificity using a visuo-motor task.Methods
Three healthy subjects (1 left-handed) were imaged under an IRB-approved protocol using multi-echo multiband EPI11 (hypermEPI) on whole-body 3T system (GE SIGNA MR750) equipped with a high-performance head-gradient coil MAGNUS5, and using a 32-channel phased array head coil (NOVA Medical, Wilmington, MA). The MAGNUS gradient coil operates at 200 mT/m with a maximum slew rate of 500 T/m/s5. A visuo-motor decision task was prescribed with the following scan parameters: repetition-time, TR=2000 ms, first echo TE1=11.8 ms, inter-echo interval, DTE =17.7 ms, in-plane acceleration factor 2.0, multi-band factor 2.0, flip-angle 40o, 2.5-mm isotropic resolution, and a total of 450 time-points (15:00 min scan time). The acquisition parameters resulted in echo-times TE1/TE2/TE3=11.8/29.5/47.2 ms. The second echo (TE2=29.5 ms) used as the reference, was assumed to be equivalent to conventional single-echo fMRI. A 1-mm isotropic resolution T1-weighted 3D MPRAGE acquisition was also acquired for spatial registration purposes. Subjects were instructed to look at images of two categories (faces/landscapes) presented randomly in the center of the screen for 20 s (Figure 1A), identify the picture category and provide an appropriate motor response (right-hand finger tapping for faces and left-hand finger tapping for landscapes). Each subject was scanned twice and the image order was shuffled to avoid bias.R2* Estimation: The single-compartment mono-exponential MR signal model assumed for the hypermEPI signal (s) is shown in Eqn.(1), where TEi is the ith echo-time, S0 is the initial magnetization (approximating single-echo rs-fMRI signal at TE=0) and R2* is the transverse relaxation rate. Assuming additive noise, R2* and S0 were estimated using least-squares estimation.
$$s({TE}_{i}) = s_i \approx S_0\exp(-R^{*}_{2} \times {TE}_{i}).[1]$$
In addition, voxel-wise linear weighted combination of echoes optimized for T2*6,7 (an output of the tedana software)13,14 was computed for each fMRI series, denoted as OC.
Pre-processing: Pre-processing of single-echo, R2*, and OC series was performed using a custom-built pipeline8 (Figure 1B). In this work, motion correction, co-registration to T1-weighted images and normalization to MNI atlas were performed on first-echo data and the same parameters were used for processing the later echoes, R2*, and OC. Following pre-processing, activation maps for the task vs. rest contrast were obtained separately for each subject using SPM129 for single echo, R2*, and OC. Motion parameters were used as covariates of no interest.
Performance metrics and statistical analysis: Performance of single-echo, R2*, and OC were evaluated in terms of activation extent10, t-statistic magnitude10, average effect size10, number of false positives11, area under the precision-recall curve (AUPRC) in the ROIs derived from the reverse inference map generated by the Neurosynth tool12 for the concept of finger-tapping and faces/places visual task.
Results
Group level statistical analysis across 3 subjects (each scanned twice) revealed repeatable regions of functional activation in the primary motor, secondary visual and parietal cortices (Figure 2) for single echo, R2*, and OC data. Comparing performance metrics, activation extent and average t-value was significantly higher in OC compared single-echo and R2* for the ROIs corresponding to finger tapping and faces & places (Figure 3A). In contrast, R2* maps showed significantly higher effect size and significantly lower false positive rate compared to single-echo and OC (Figure 3B-C). Intra-subject repeatability evaluated by calculating the Dice coefficient between active regions between the two scans (Table 1) was similar across single-echo, R2* and OC. Inter-scan repeatability evaluated by number of voxels consistently appearing in >50% (4 out of 6) scans was highest for OC. For the finger tapping task, AUPRC for single echo activations (0.137) was lower than R2* (0.140) and OC (0.157), suggesting that across different t-statistic thresholds, R2*, and OC identify active voxels in the ROI with higher precision and recall. For the faces/places task, all AUPRC values were similar.Discussion and Conclusion
In this work, R2* computed using hypermEPI was used to estimate functional connectivity. While activation extent was lower with R2* as shown previously10, R2* showed the largest effect size and lower false positive rates compared to single echo. With almost no compromise on repeatability compared to conventional single-echo acquisition, multi-echo derived R2* and OC fMRI provides complementary information on functional connectivity and may improve the understanding of functional brain organization specific to BOLD activation.Acknowledgements
Grant funding from NIH U01EB026976 and CDMRP W81XWH-16-2-0054.
References
1. Biswal, B., Yetkin, F. Z., Haughton, V. M. & Hyde, J. S. Functional connectivity in the motor cortex of resting human brain using echo-planar MRI. Magn. Reson. Med. 34, 537–541 (1995).2. Greve, D. N. et al. A survey of the sources of noise in fMRI. Psychometrika 78, 396–416 (2013).
3. Zhao, J. M., Clingman, C. S., Närväinen, M. J., Kauppinen, R. A. & van Zijl, P. C. M. Oxygenation and hematocrit dependence of transverse relaxation rates of blood at 3T. Magn. Reson. Med. 58, 592–597 (2007).
4. Shen, Q., Ren, H. & Duong, T. Q. CBF, BOLD, CBV, and CMRO(2) fMRI signal temporal dynamics at 500-msec resolution. J. Magn. Reson. Imaging JMRI 27, 599–606 (2008).
5. Foo, T. K. F. et al. Highly efficient head-only magnetic field insert gradient coil for achieving simultaneous high gradient amplitude and slew rate at 3.0T (MAGNUS) for brain microstructure imaging. Magn. Reson. Med. 83, 2356–2369 (2020).
6. Poser, B. A. & Norris, D. G. Investigating the benefits of multi-echo EPI for fMRI at 7 T. NeuroImage 45, 1162–1172 (2009).
7. Posse, S. et al. Enhancement of BOLD-contrast sensitivity by single-shot multi-echo functional MR imaging. Magn. Reson. Med. 42, 87–97 (1999).
8. Madhavan, R. et al. Longitudinal Resting State Functional Connectivity Predicts Clinical Outcome in Mild Traumatic Brain Injury. J. Neurotrauma 36, 650–660 (2019).
9. Friston, KJ, Ashburn J, Kiebel, SJ, Nichols, TE & Penny, WD. Statistical Parametric Mapping: The Analysis of Functional Brain Images. (Academic Press, 2007).
10. Gonzalez-Castillo, J. et al. Evaluation of multi-echo ICA denoising for task based fMRI studies: Block designs, rapid event-related designs, and cardiac-gated fMRI. NeuroImage 141, 452–468 (2016).
11. Fernandez, B., Leuchs, L., Sämann, P. G., Czisch, M. & Spoormaker, V. I. Multi-echo EPI of human fear conditioning reveals improved BOLD detection in ventromedial prefrontal cortex. NeuroImage 156, 65–77 (2017).
12. Yarkoni, T., Poldrack, R. A., Nichols, T. E., Van Essen, D. C. & Wager, T. D. Large-scale automated synthesis of human functional neuroimaging data. Nat. Methods 8, 665–670 (2011).
13. Kundu, Prantik, Noah D. Brenowitz, Valerie Voon, Yulia Worbe, Petra E. Vértes, Souheil J. Inati, Ziad S. Saad, Peter A. Bandettini, and Edward T. Bullmore. “Integrated Strategy for Improving Functional Connectivity Mapping Using Multiecho FMRI.” Proceedings of the National Academy of Sciences 110, no. 40 (October 1, 2013): 16187–92.
14. Kundu, Prantik, Souheil J. Inati, Jennifer W. Evans, Wen-Ming Luh, and Peter A. Bandettini. “Differentiating BOLD and Non-BOLD Signals in FMRI Time Series Using Multi-Echo EPI.” NeuroImage 60, no. 3 (April 15, 2012): 1759–70.
15. “ME-ICA/Tedana: 0.0.11 | Zenodo.” Accessed November 10, 2021. https://zenodo.org/record/5541689#.YYt4d2BBw2w.
Figures
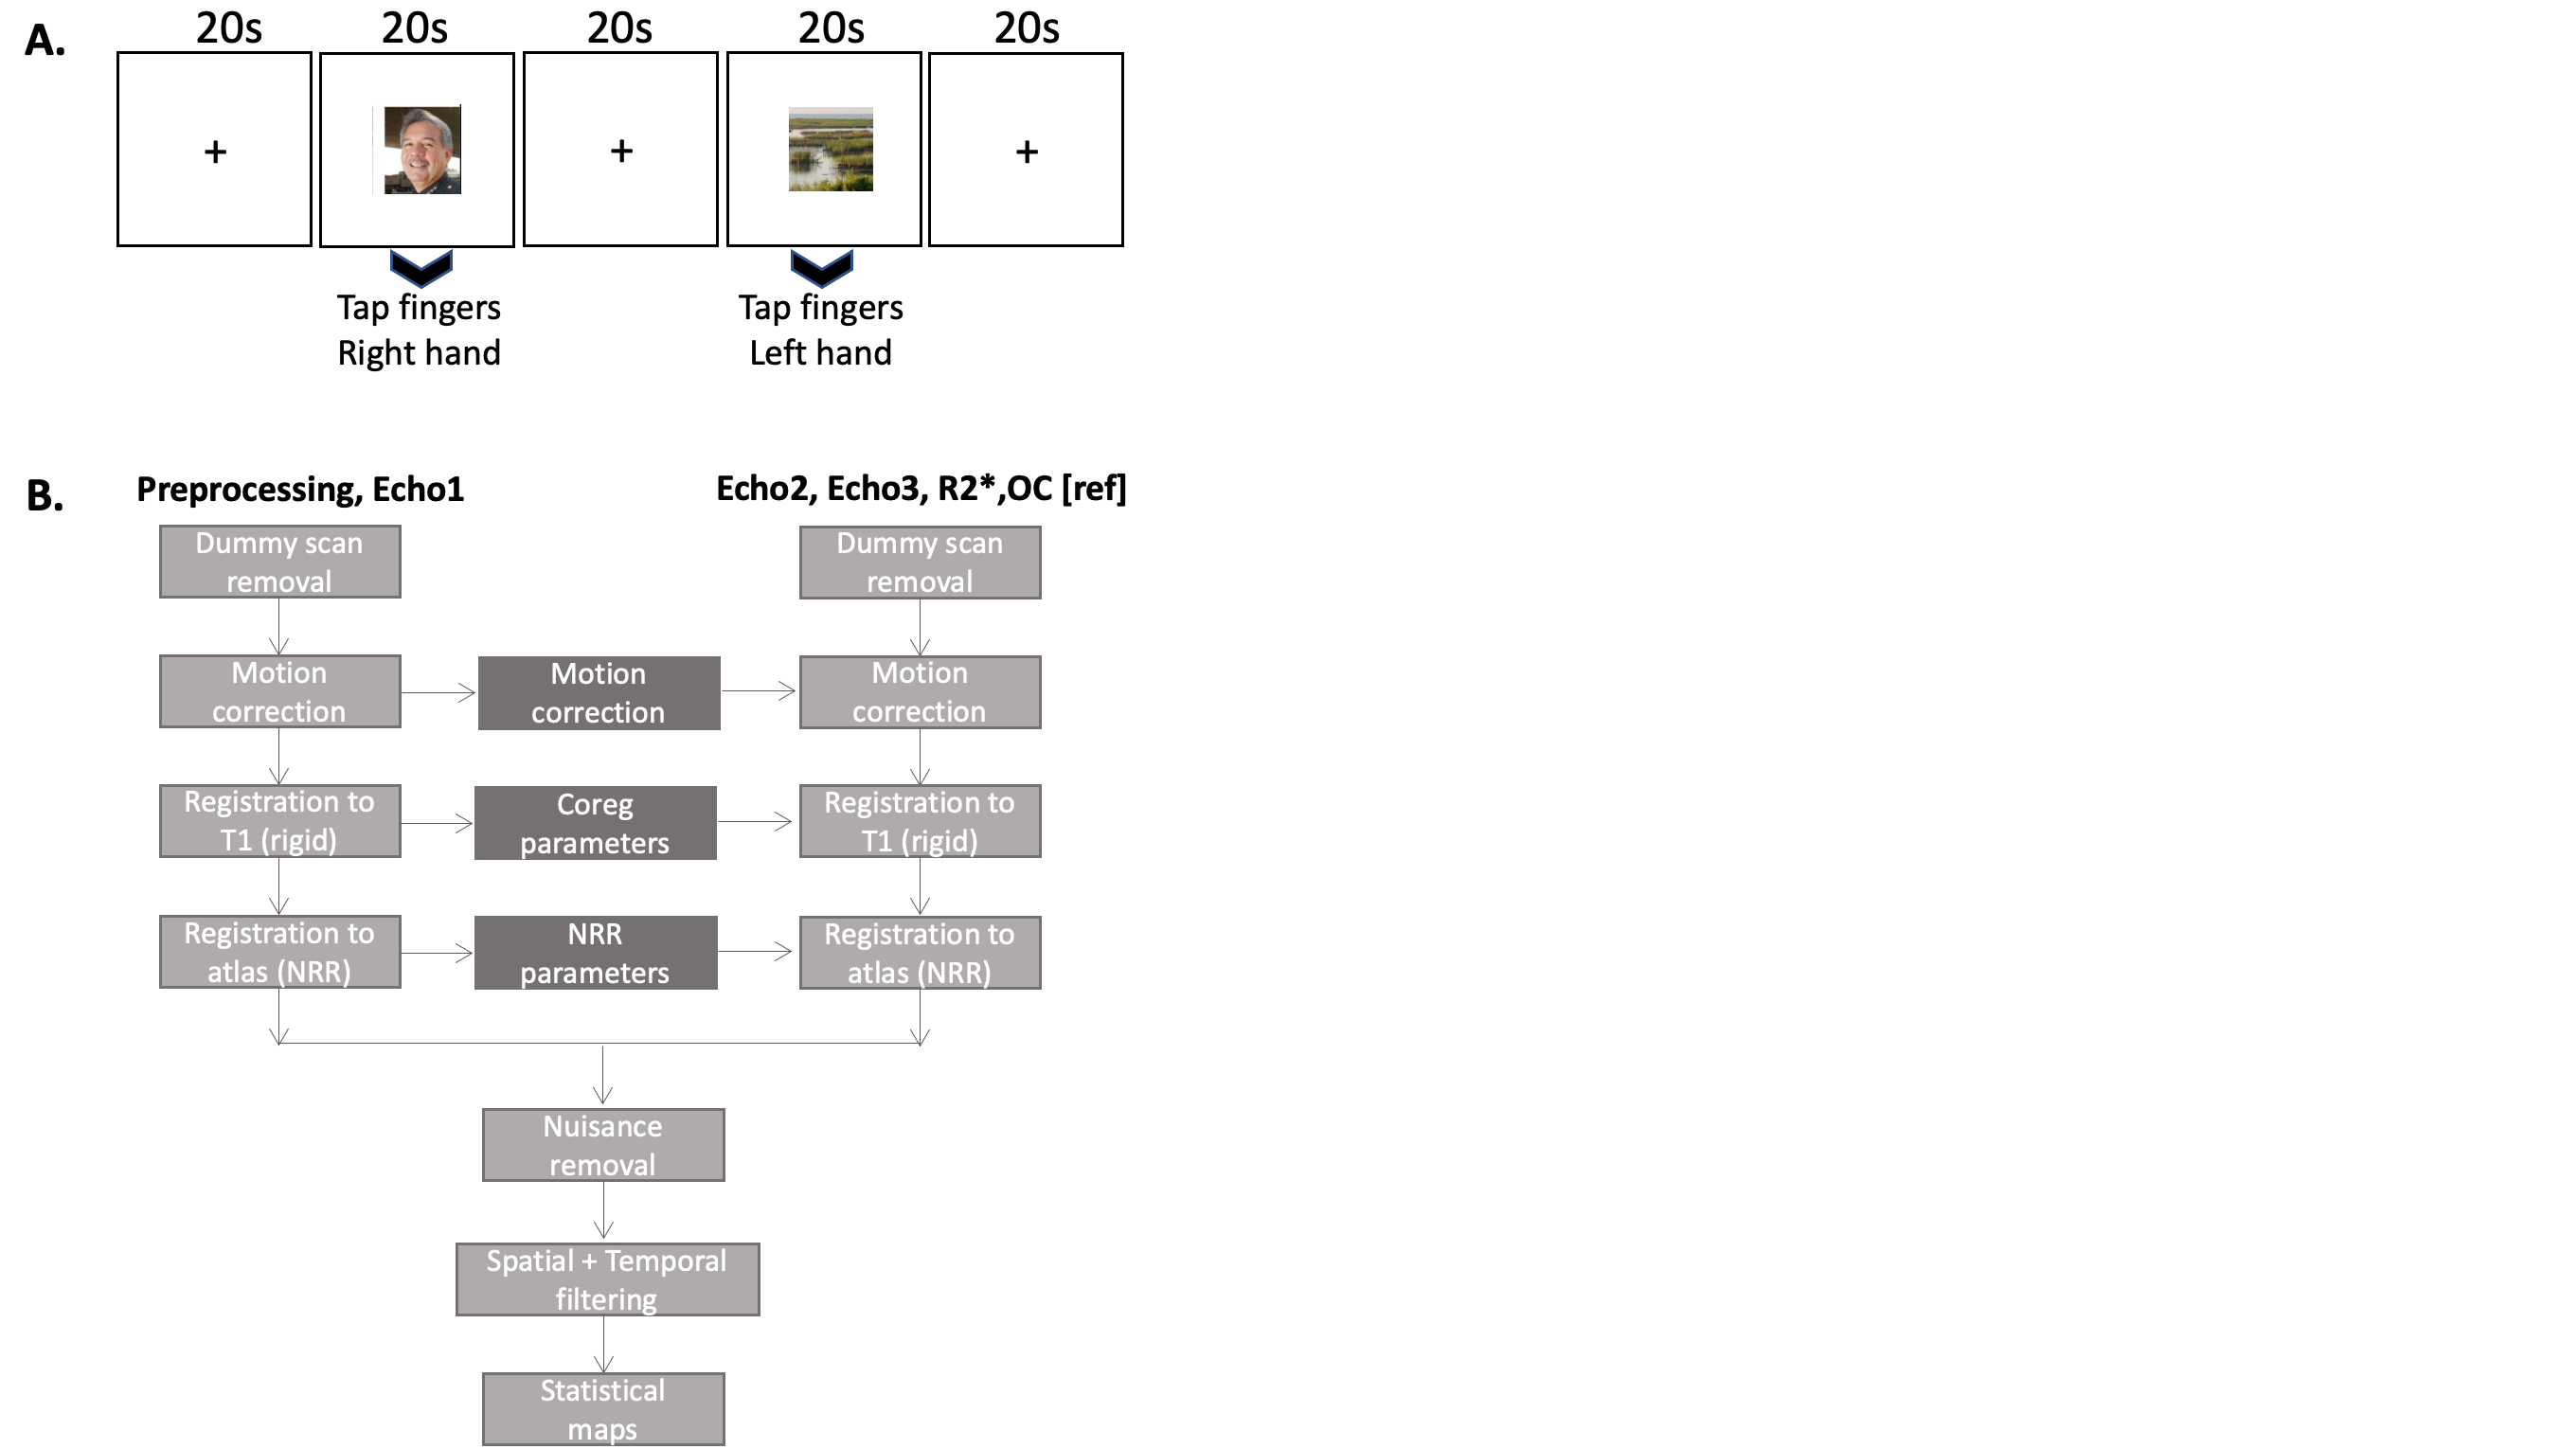
Figure 1: Visuo-motor task details and multi-echo preprocessing pipelines (A) Multi-echo visuo-motor tasks paradigm. The order of the image categories was randomized, and a different set of images were used for the two scan sessions for each subject. Cross hair images were presented for 20s between image transitions. (B) Custom-built preprocessing pipeline8 adapted for multi-echo processing.
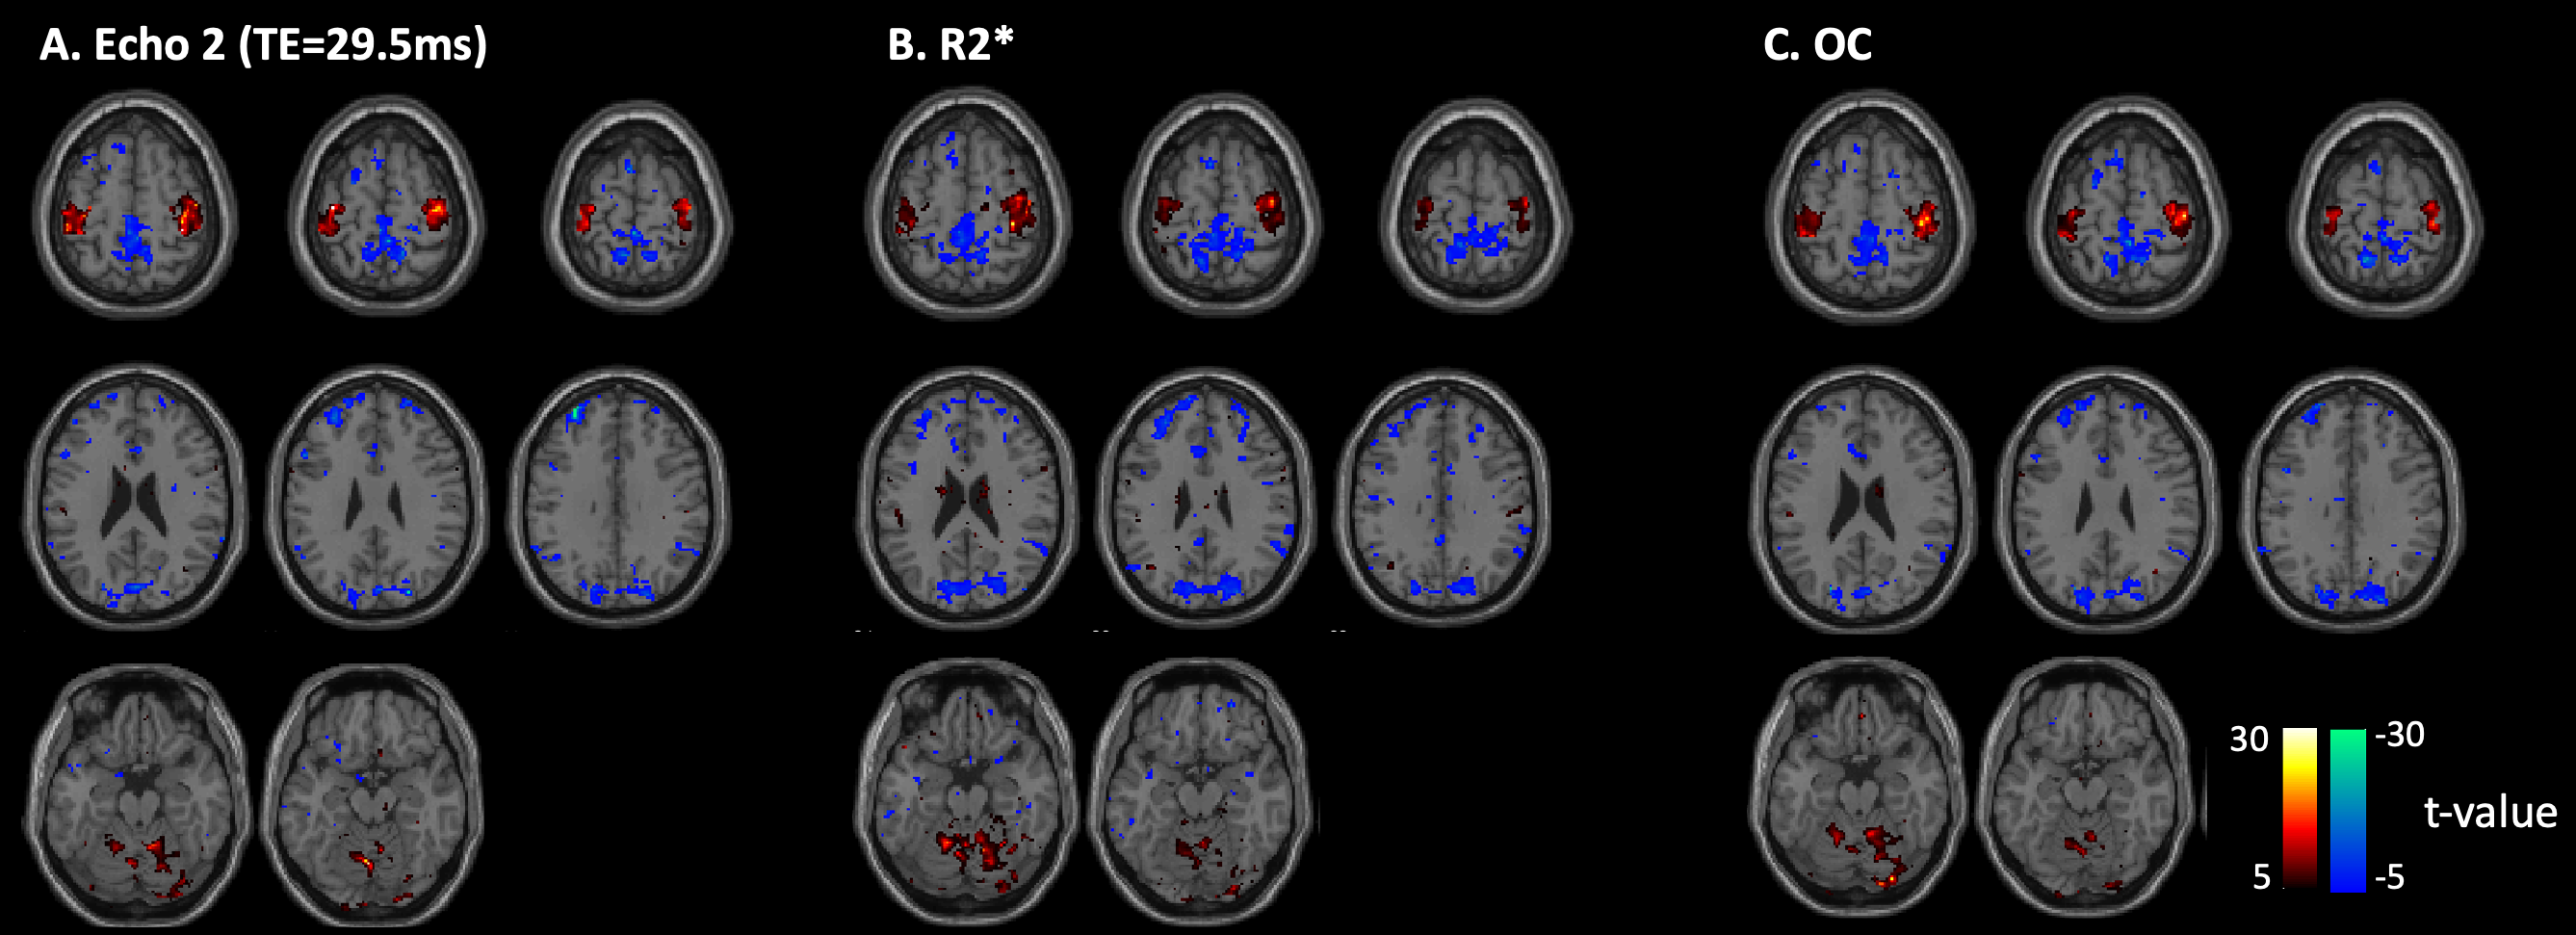
Figure 2: Task activation maps comparing Echo 2, R2*, and OC. Group level (N=3 subjects each scanned twice) statistically significant (p<0.001, cluster threshold = 50 voxels) functional activation regions for task ON vs. OFF for (A) Echo 2, (B) R2* and (C) Optimal combination (OC) across echoes. Warm colors (red-yellow) are regions that positively correlate with task. Cold (blue-cyan) are regions that negatively correlate with task.
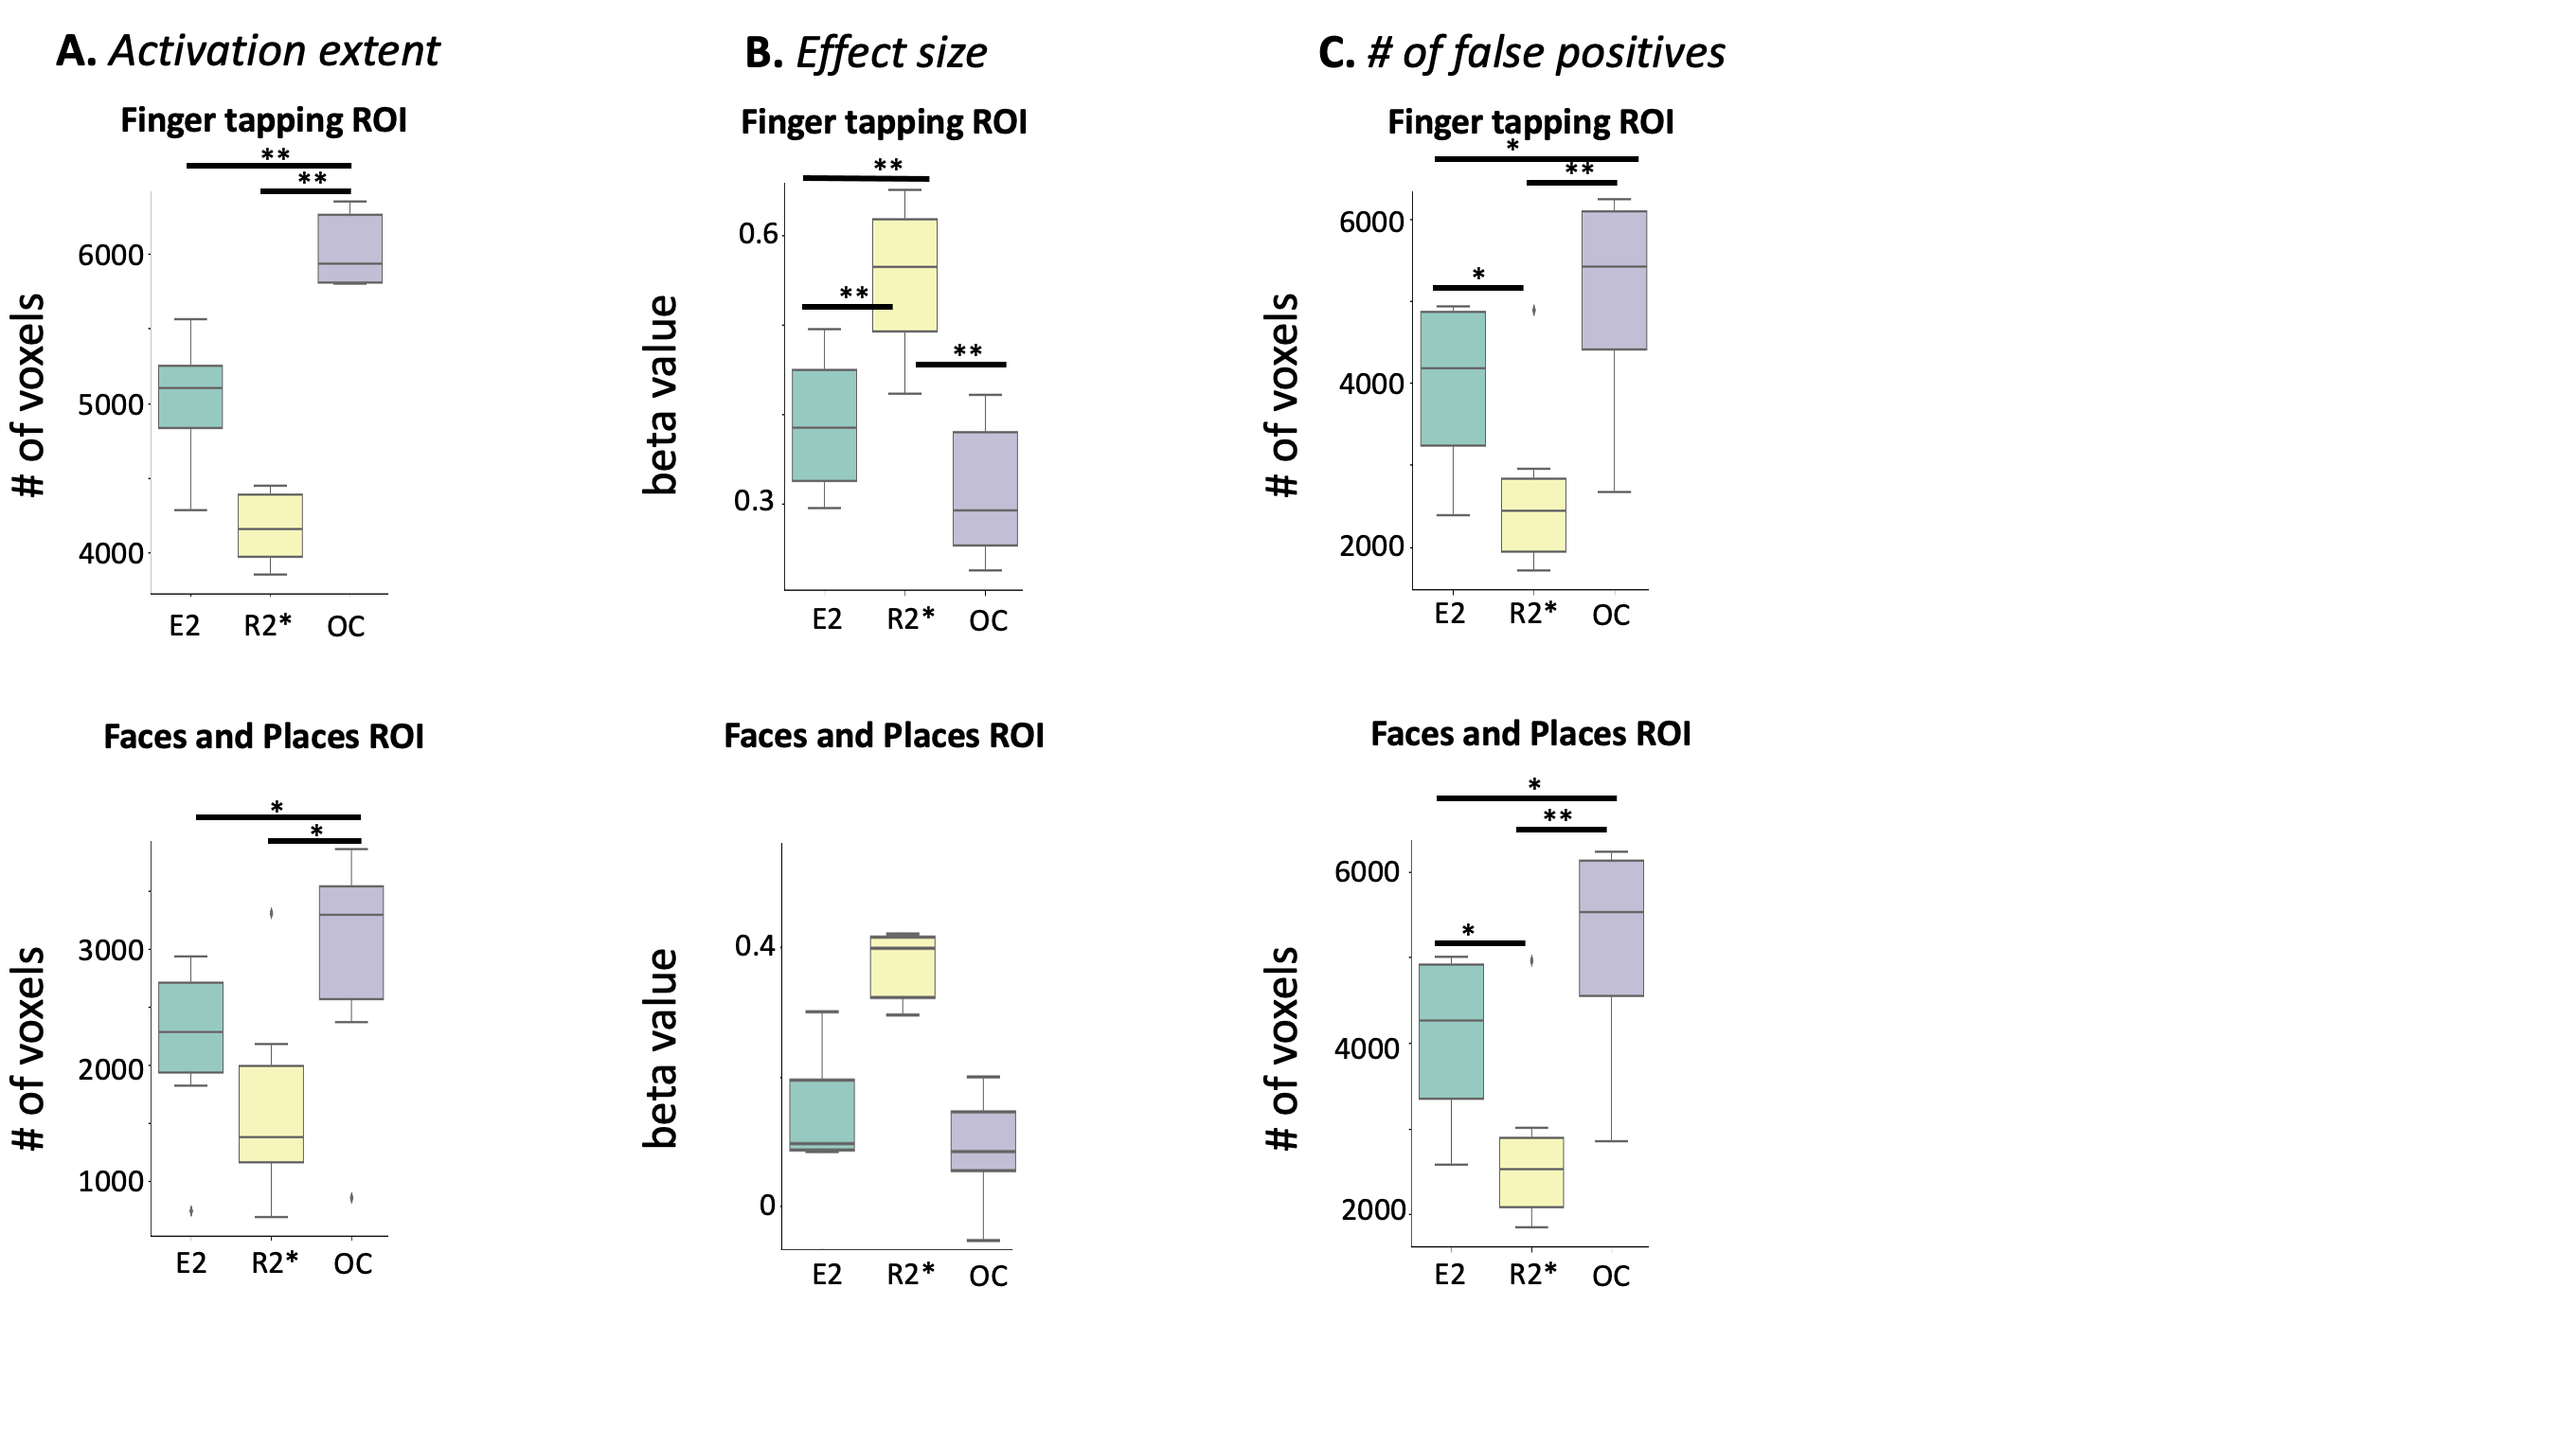
Figure 3: Performance metrics comparing single echo, R2*, and OC. (A) Activation Extent (B) Effect size and (C) Number of false of positives for finger tapping and faces+places ROIs derived from Neurosynth. * indicates p<0.05 and ** indicates p<0.005 using a paired t-test. All metrics were computed for significantly activated voxels at significance level of p<0.001 at cluster threshold of 50 voxels.
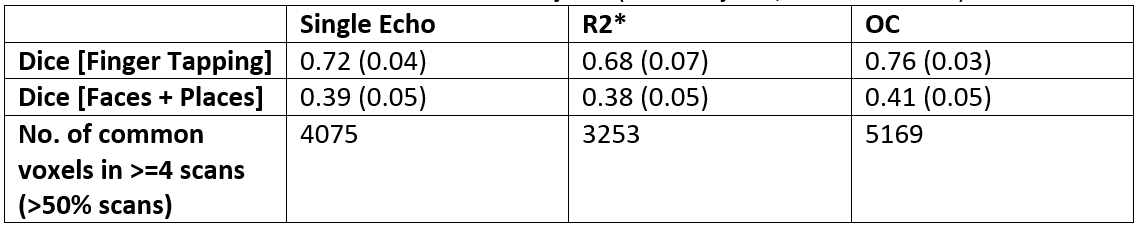
Table 1: Repeatability across subjects and scans. Dice was calculated across scans for the same subject. Numbers indicate mean (standard deviation) dice across subjects. Number of common voxels were calculated across all scans and subjects (N=3 subjects, scanned twice).