3034
Altered macroscale neurovascular coupling in vascular cognitive impairment1Department of Radiology, Zhongnan Hospital of Wuhan University, Wuhan, China, 2GE Healthcare, Beijing, China
Synopsis
This study aims to integrate psychological behavior, clinical biochemistry and other indicators, and use multi-mode MRI technology to explore specific imaging indicators of VCIND neurovascular coupling (NVC). NVC analysis and CBF/ ALFF ratio calculation were performed to investigate the neurovascular coupling changes and clinical significance of LVCI, SVCI and HC. Regardless of the level of the whole brain or brain regions, we have found neurovascular uncoupling in VCIND patients compared with healthy controls. These findings will be helpful in screening patients with VCIND, and has important theoretical and clinical significance in preventing and delaying the development of dementia.
Introduction
The diagnosis of vascular cognitive impairment non-dementia (VCIND) requires multiple imaging examinations, neuropsychological and laboratory tests[1]. Traditional MRI is still an essential method for diagnosing and evaluating VCIND, but it has many limitations such as long scan time, non-quantitative evaluation, etc[2]. In order to better understand the pathogenesis of VCIND and early diagnosed patients who have VCIND, we aim to provide meaningful and objective functional imaging indicators. Therefore, we applied the neurovascular coupling theory to distinguish patients with large/small vessel disease vascular cognitive impairment non-dementia (LVCI/SVCI) with healthy controls to offer better diagnosis and treatment choices.Materials and Methods
Forty patients with LVCI, 42 patients with SVCI, and 42 demographically matched healthy controls were included. Demographic, clinical data for each participant were shown in Table 1. All participants underwent resting-state fMRI (rs-fMRI), arterial spin labeling (ASL), and T1 BRAVO images on a 3.0T MR scanner (Signa 750w, GE Healthcare, USA). The amplitude of low-frequency fluctuation (ALFF) of rs-fMRI and regional cerebral blood flow (CBF) of ASL were calculated using dpabi open software. The spatial ratio between ALFF and CBF at the voxel-wise level was defined as a surrogate of neurovascular coupling[3]. Significant regions showing intergroup differences in neurovascular coupling were separated out for further correlational analyses with clinical data in patients with LVCI and SVCI via Pearson correlation[4].Results
Compared with healthy controls, patients with LVCI and SVCI demonstrated neurovascular uncoupling in the left superior frontal gyrus, inferior frontal gyrus, left central sulcus, left insula, right paracentral lobule, middle temporal gyrus, cerebellar hemisphere and cerebellar vermis. Imaging biomarkers were positively related to the health condition and negatively related to disease severity, consistent with our hypothesis. Besides, disease history is positively related to imaging biomarkers, which may result from the long-term compensatory effect.Discussion and conclusion
To the best of our knowledge, this is the first study investigating CBF–ALFF coupling changes in VCIND patients using a combination of BOLD and ASL techniques[5]. Compared with healthy controls, the SVCI and LVCI patients showed reduced across-voxel CBF–ALFF correlations of global neurovascular coupling at the whole GM level. Moreover, at the brain region level, neurovascular biomarkers in VCIND patients were significantly decreased in 14 brain regions and increased in 4 brain regions. This study may provide objective neuroimaging evidence and improve understanding neural mechanisms from the perspective of neurovascular coupling in VCIND patients. In the future, neuropsychological assessments and neurovascular biomarkers could be combined for monitoring therapeutic efficacy and progression of VCIND[6].Keywords
vascular cognitive impairment, primary dysmenorrhea; neurovascular coupling; resting-state functional magnetic resonance imaging; arterial spin labelingAcknowledgements
We thank the reviewers for their assistance on data processing and discussion.References
[1] Dichgans M, Leys D. Vascular cognitive impairment. CircRes, 2017, 120(3): 573-591.
[2] Corriveau RA, Bosetti F, Emr MA, et al. The science of vascular contributions to cognitive impairment and dementia (VCID): a framework for advancing research priorities in the cerebrovascular biology of cognitive decline. Cell Mol Neurobiol, 2016, 36(2): 281-288
[3] Rockwood K, Black SE, Song X, et al. Clinical and radiographic subtypes of vascular cognitive impairment in a clinic-based cohort study. J Neural Sci, 2006, 240(1-2): 7-14
[4] Rosenberg, G. A., Bjerke, M., and Wallin, A. (2014). Multimodal markers of inflammation in the subcortical ischemic vascular disease type of vascular cognitive impairment. Stroke 45, 1531–1538. doi: 10.1161/STROKEAHA.113. 004534
[5] Sachdev, P., Kalaria, R., O’Brien, J., Skoog, I., Alladi, S., Black, S. E., et al.(2014). Diagnostic criteria for vascular cognitive disorders: a V ASCOG statement. Alzheimer Dis. Assoc. Disord. 28, 206–218.
[6] Fride Y, Adamit T, Maeir A, et al. What are the correlates of cognition and participation to return to work after first ever mild stroke? Top Stroke Rehabil. 2015;22(5):317– 25
Figures
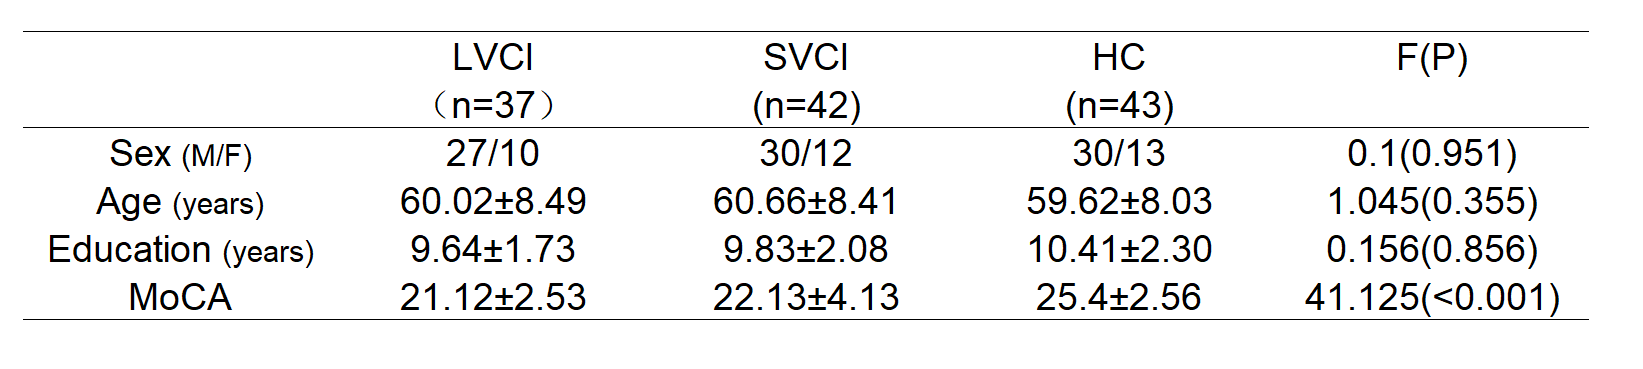
TABLE 1 Demographics of 122 subjects recruited in this study.
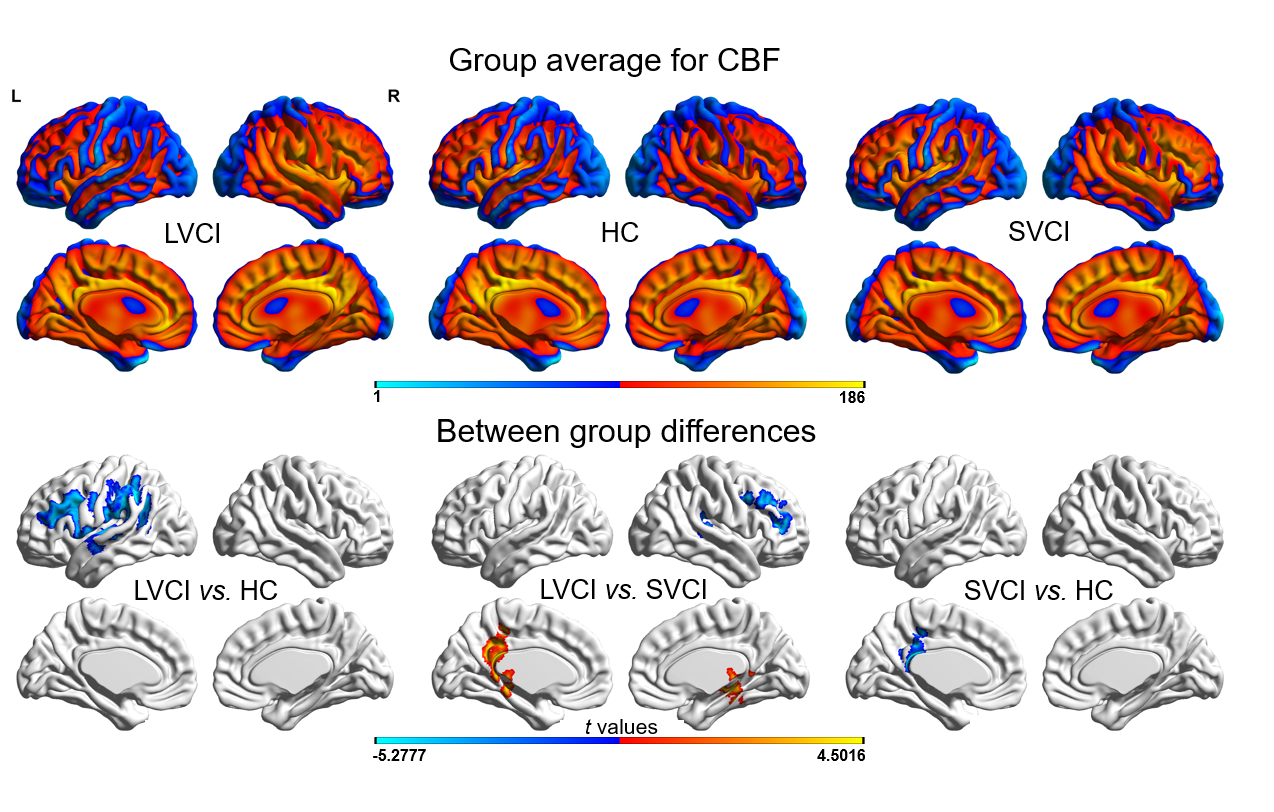
FIGURE 1 Group-level difference of CBF. Obviously decreased CBF in Supra-marginal gyrus, central front-rear gyrus. In LVCI and SVCI compared to HC groups while increased CBF mainly in the right ventral posterolateral nucleus, right hippocampus and cerebellar vermis; decreased CBF mainly in left lower parietal gyrus, left frontal gyrus, right middle frontal gyrus and right temporal gyrus
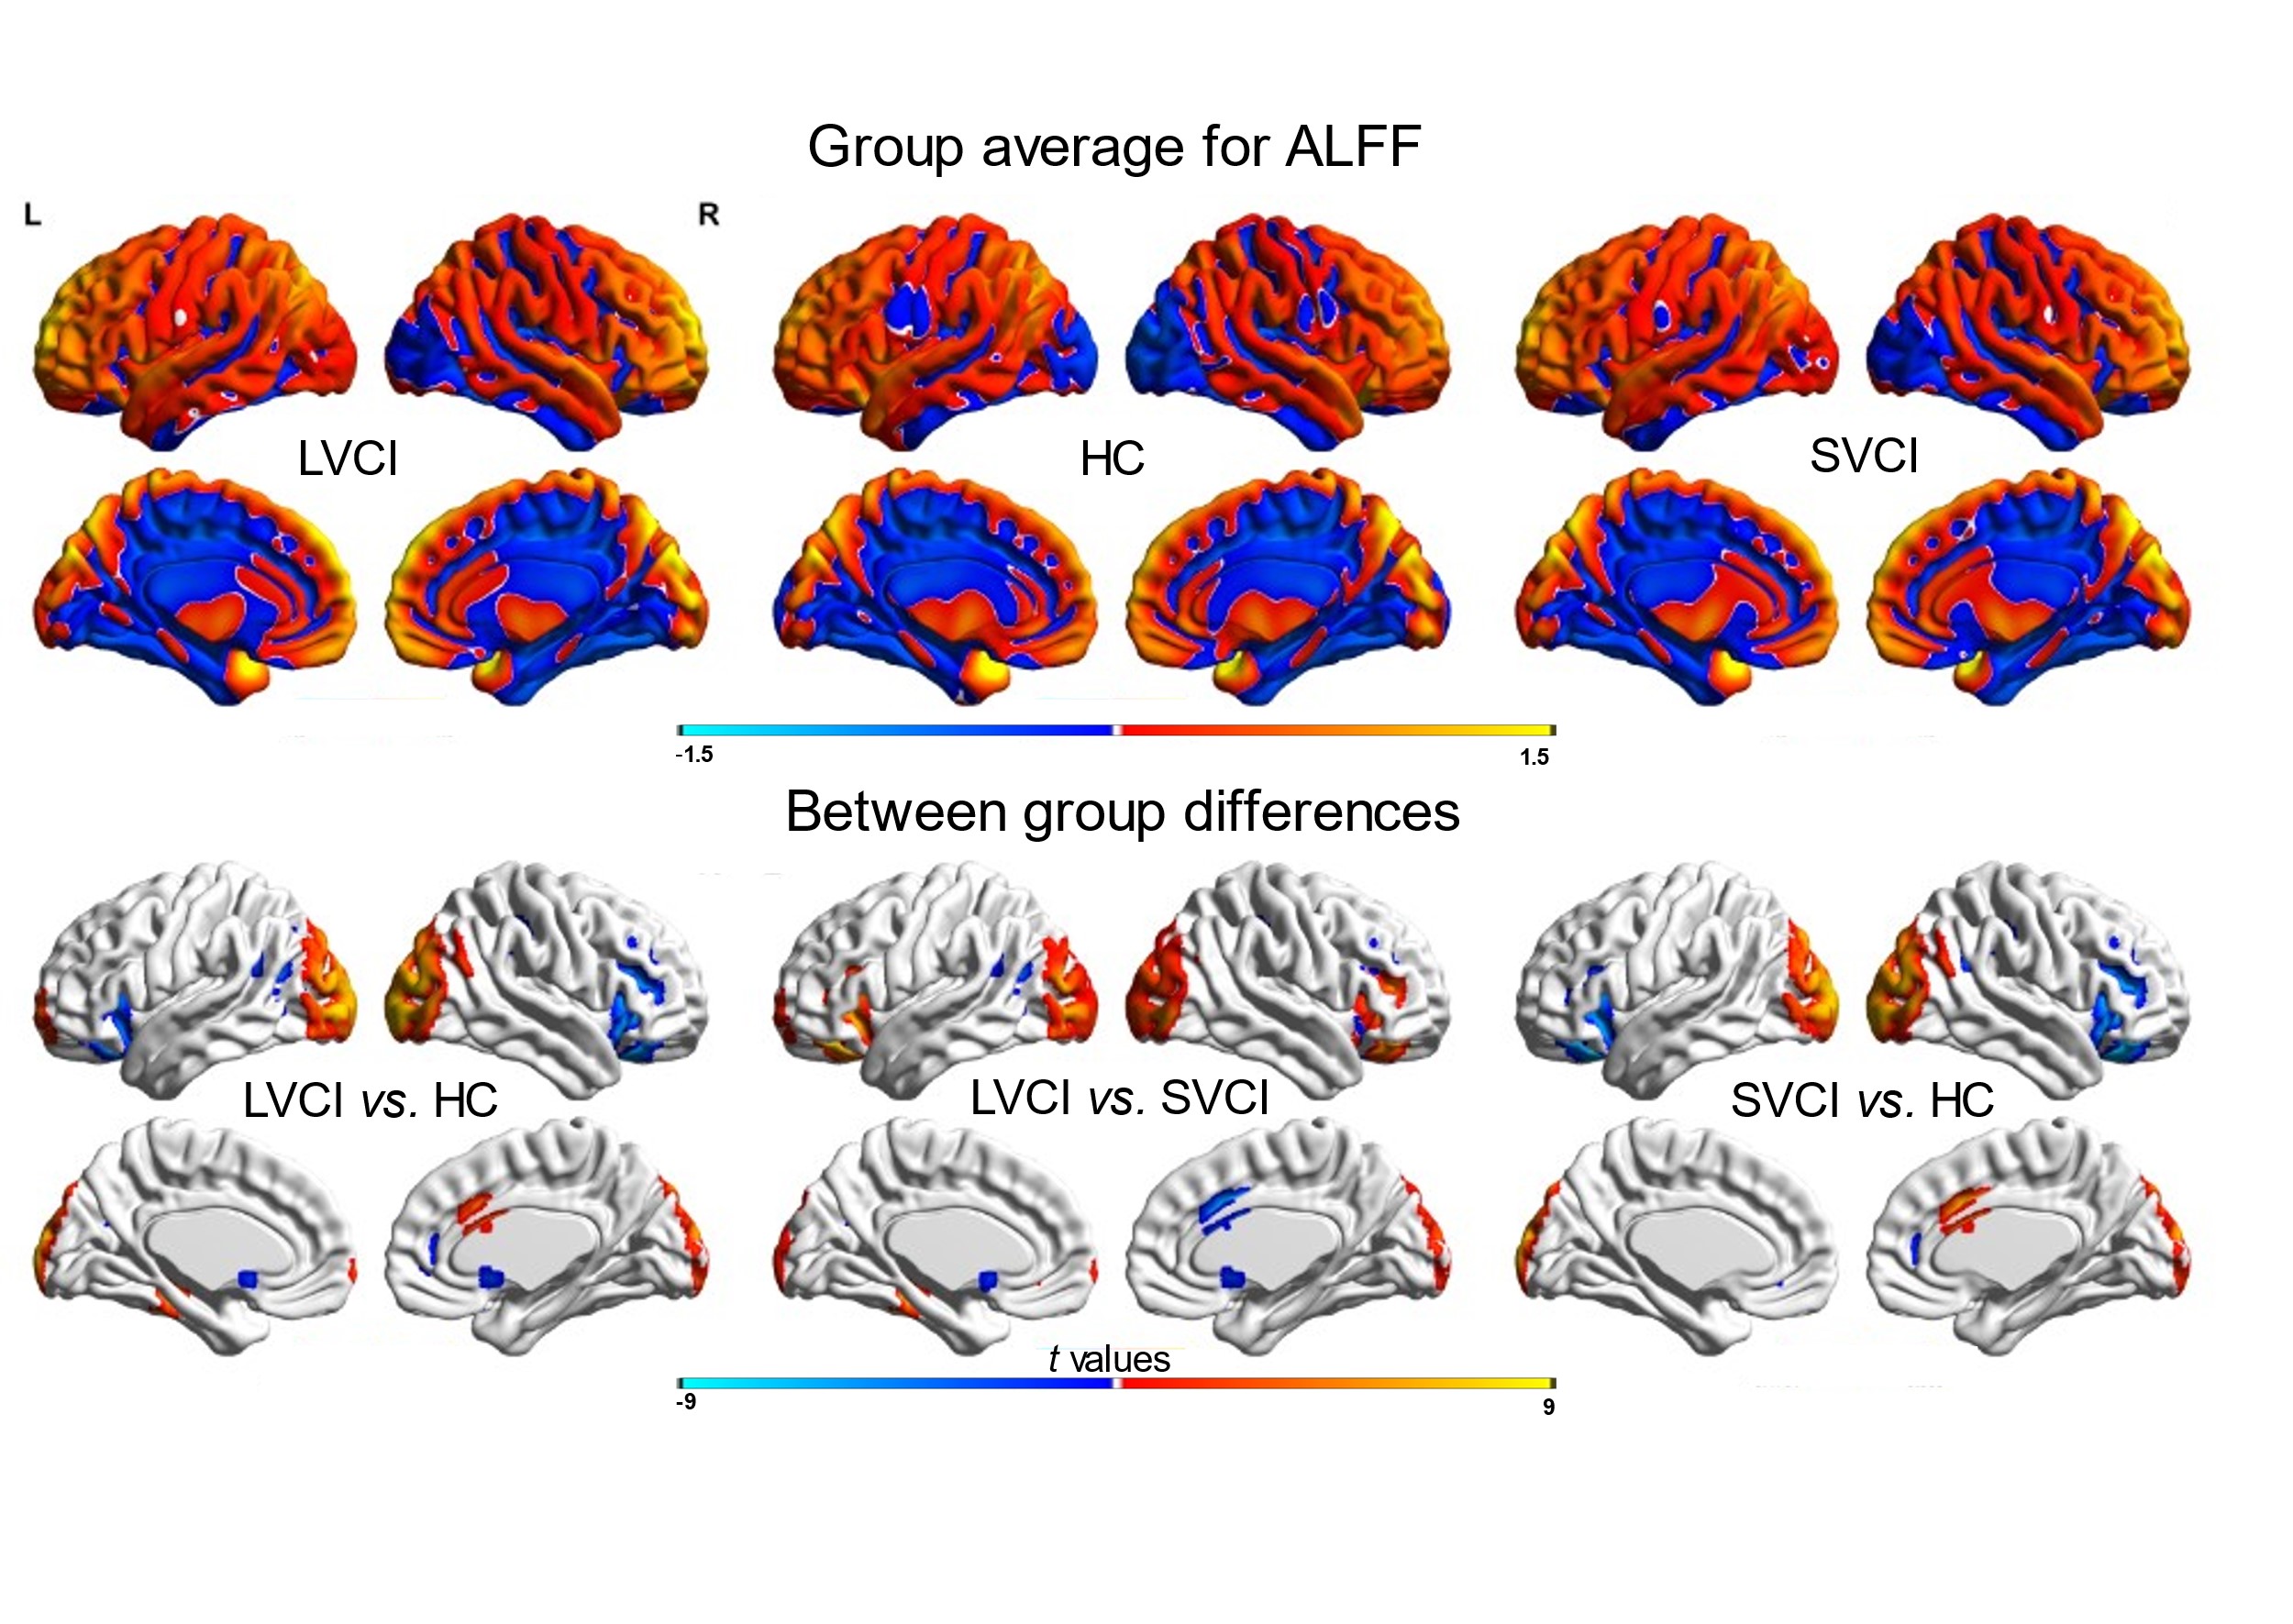
FIGURE 2 Group-level ALFF differences. Obviously decreased and increased ALFF in many brain regions of HC compared to LVCI and SVCI.
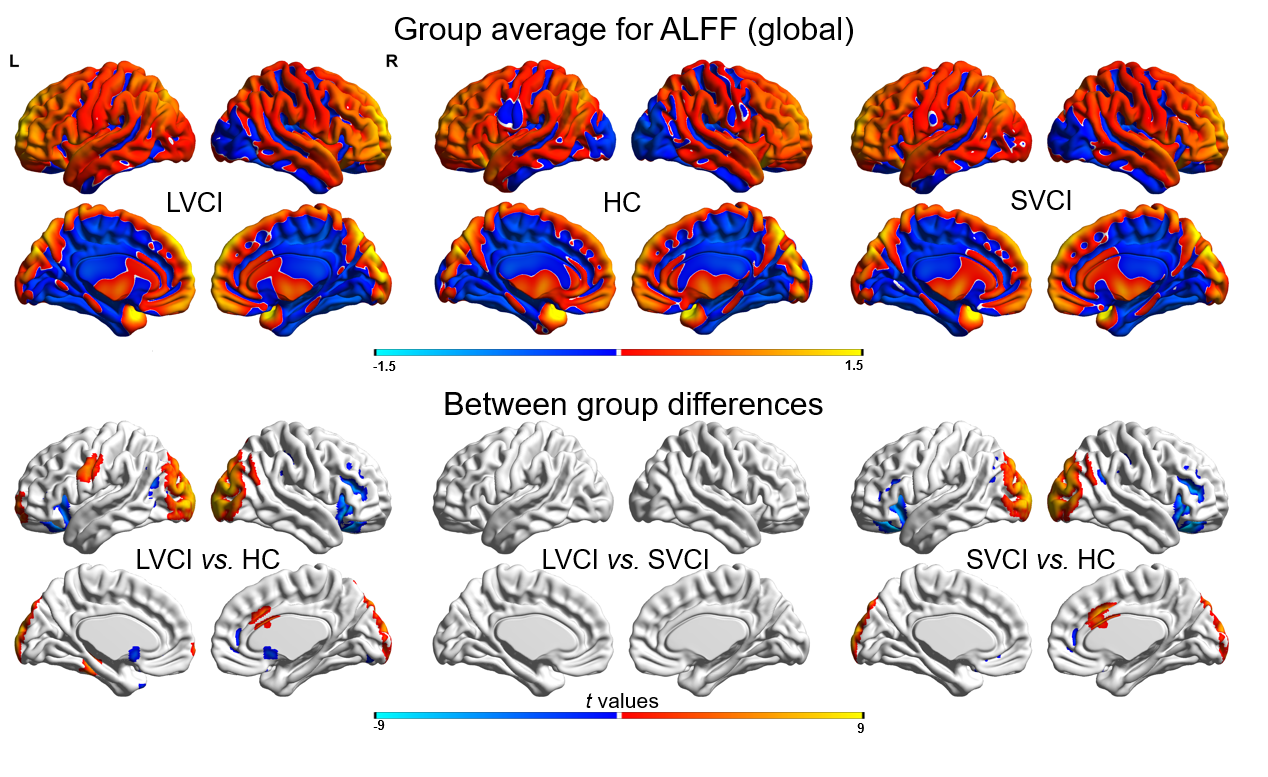
FIGURE 3 Group-level global ALFF differences. Obviously decreased and increased global ALFF in many brain regions of HC compared to LVCI and SVCI.
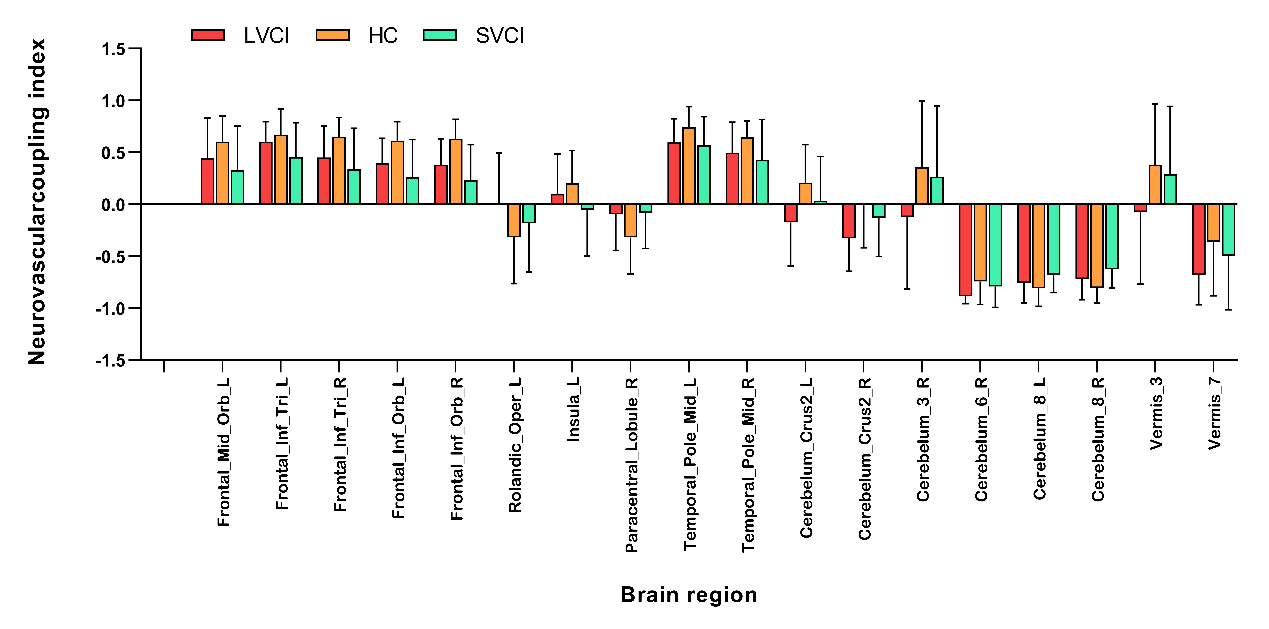
FIGURE 4 Neurovascularcoupling index in the different brain region
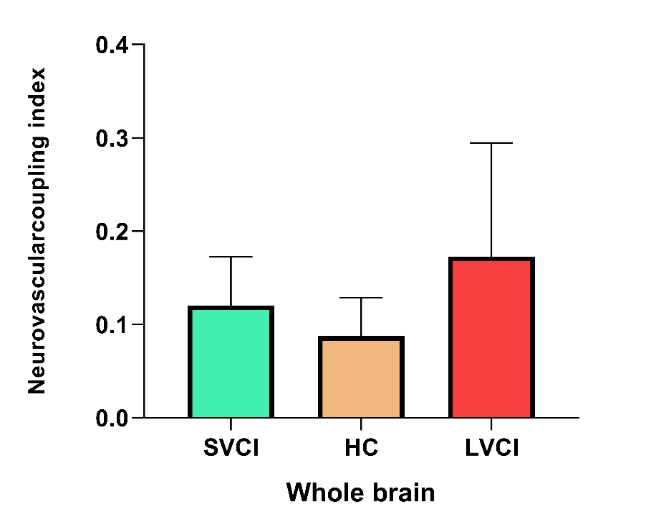
FIGURE 5 Neurovascularcoupling index in GM level