3033
Abnormal functional stability in patients with minimal hepatic encephalopathy.1Fujian Medical University Union Hospital, Fuzhou, China
Synopsis
We investigated the stability of brain functional architectures and its relationship with cognitive impairment in cirrhotic patients. From healthy controls, to NHE, and to minimal hepatic encephalopathy(MHE) group, a stepwise reduction of FS was found in right supramarginal gyrus , right middle cingulate cortex, left superior frontal gyrus, and BPCC; whereas, a progressive increment of FS was observed in left middle occipital gyrus and right temporal pole. Mean FS was correlated with Psychometric Hepatic Encephalopathy Score among cirrhotic patients. FS index showed moderate discrimination potential between NHE and MHE. FS alteration could be potential biomarkers serving for diagnosis about MHE.
Introduction
Resting state functional magnetic resonance imaging (rs-fMRI) constitutes a fundamental tool for non-invasively investigating the collections of distinct brain regions that exhibit low-frequency, temporally correlated blood oxygen level–dependent (BOLD) signal fluctuations in the absence of an explicit task1. Functional connectivity (FC) analysis is one of the most common approach for analyzing rs-fMRI data, which has obtained a series of research achievements. For instance, based on voxel-wise correlation analysis, functional connectivity density (FCD) can measure the strength of functional connections throughout the normal brain to reflect the amount of communication between brain regions2. Moreover, the significant FCD alteration within the cortico-striato-thalamic circuit has also been revealed in cirrhotic patients with MHE and is associated with cognitive impairment as well as HE development3. There is increased focus on dynamic functional connectivity (dFC) analysis, which enables the capture of spontaneously reoccurring FC patterns and reflects the properties of brain dynamics4. Based on the dynamic functional connectivity analysis, recent studies have revealed the distribution of brain functional stability in resting state and explored its modifiability during task execution to reveal the underlying mechanisms of the realization and maintenance of high-level cognition5. To date, this functional stability analysis has already been conducted in studies involving neurological and psychiatric conditions (such as major depressive disorder) to explore the relevant neuropathological mechanisms6. However, the stability property of brain functional organization has not yet been explored in MHE that is related to cognitive impairment in cirrhotic patients. In the present study, we aimed to identify the changes of brain functional stability in MHE, based on analysis for rs-fMRI data. This approach may facilitate our understanding of the neural mechanisms of MHE from a new perspective and offer a potential imaging biomarker for diagnosis.Methods
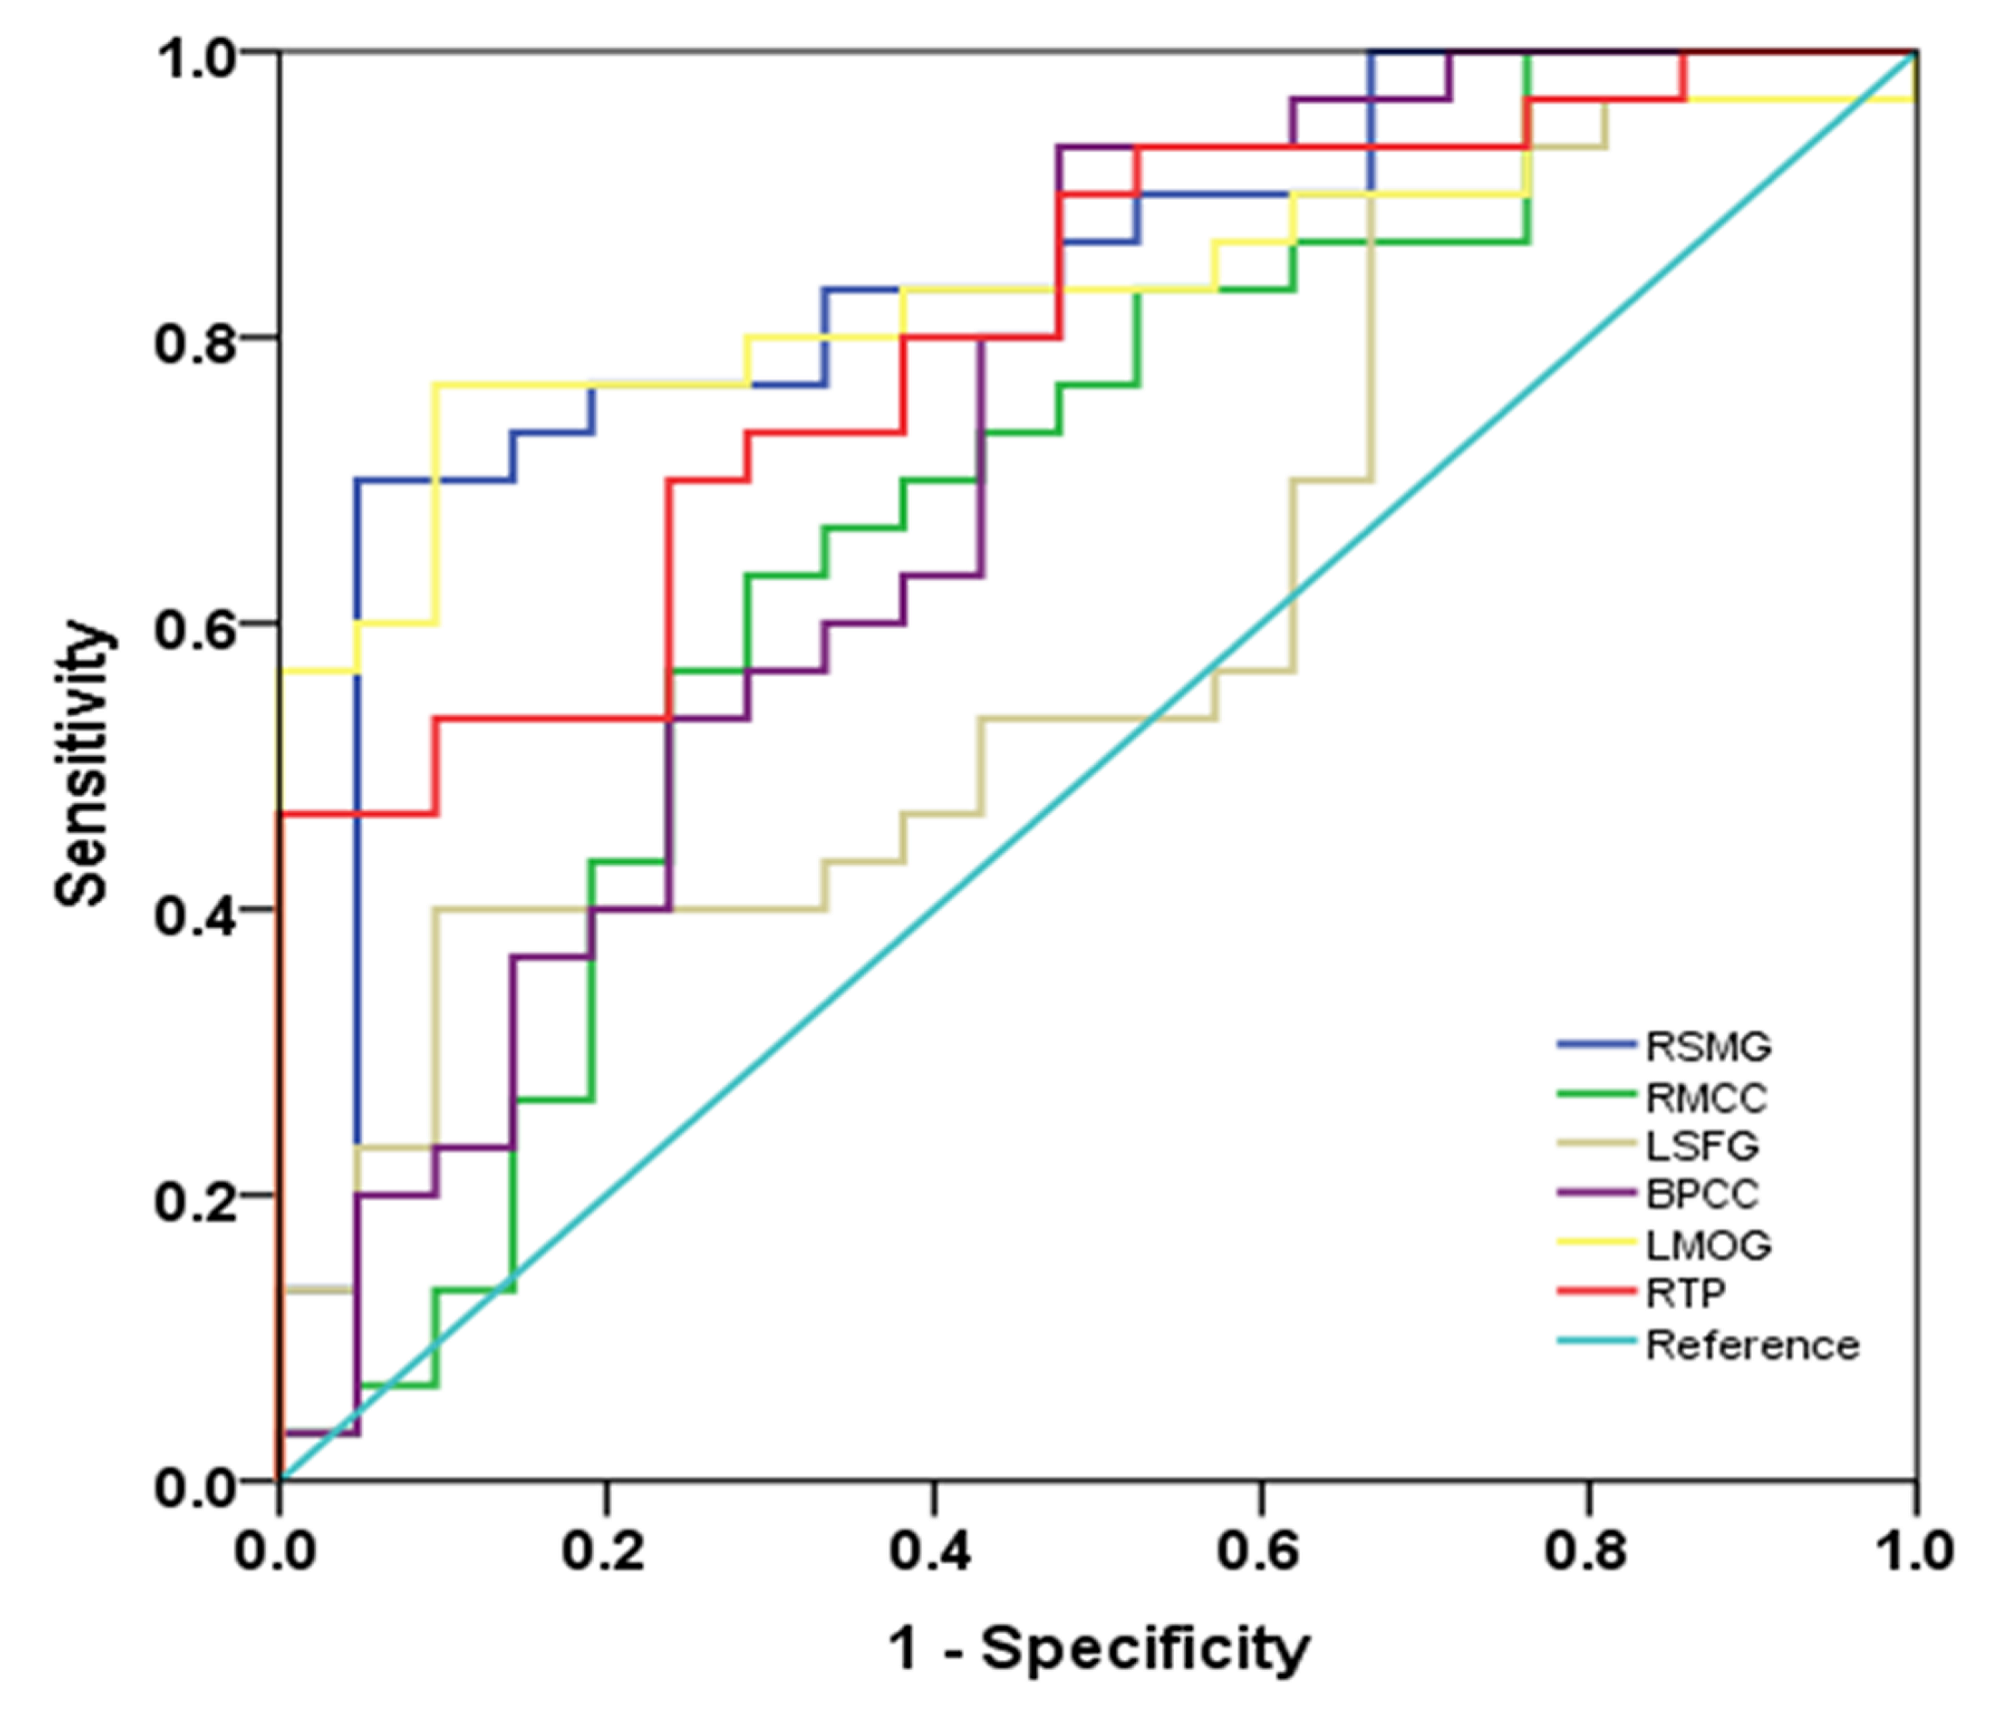
Fifty-one cirrhotic patients (30 without and 21 with MHE) and 29 healthy controls (HC) were enrolled to undergo resting-state functional magnetic resonance imaging and neurocognitive assessment using Psychometric Hepatic Encephalopathy Score (PHES). Voxel-wise functional connectivity density (FCD) was computed as the sum of connectivity strength between one voxel and others within the whole brain; then, sliding window correlation approach was employed to calculate the dynamic of FCD over time. Functional stability (FS) is measured as the concordance of dynamic FCD (dFCD). The one-way analysis of variance was utilized to assess FS difference across three groups. Spearman’s correlation analyses were used to evaluate the relationship between FS index and PHES in cirrhotic patients. Receiver operating characteristic curve analysis was conducted to assess the potential of FS index for discriminating NHE and MHE groups.Results
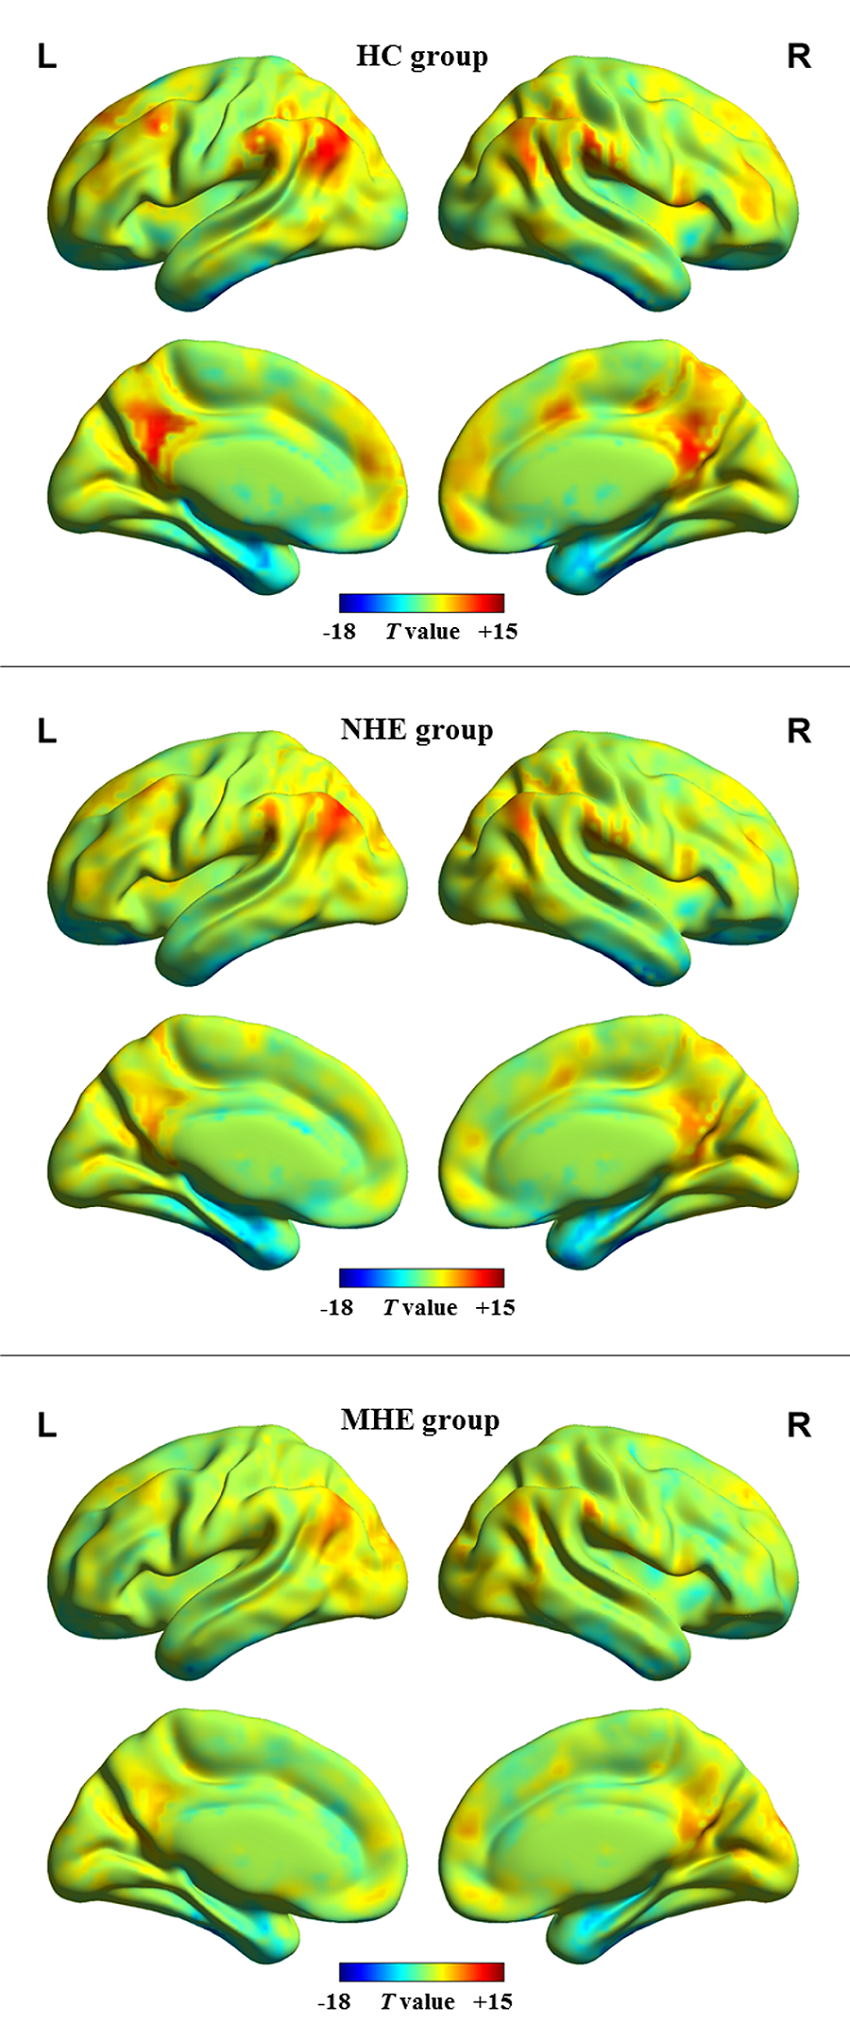
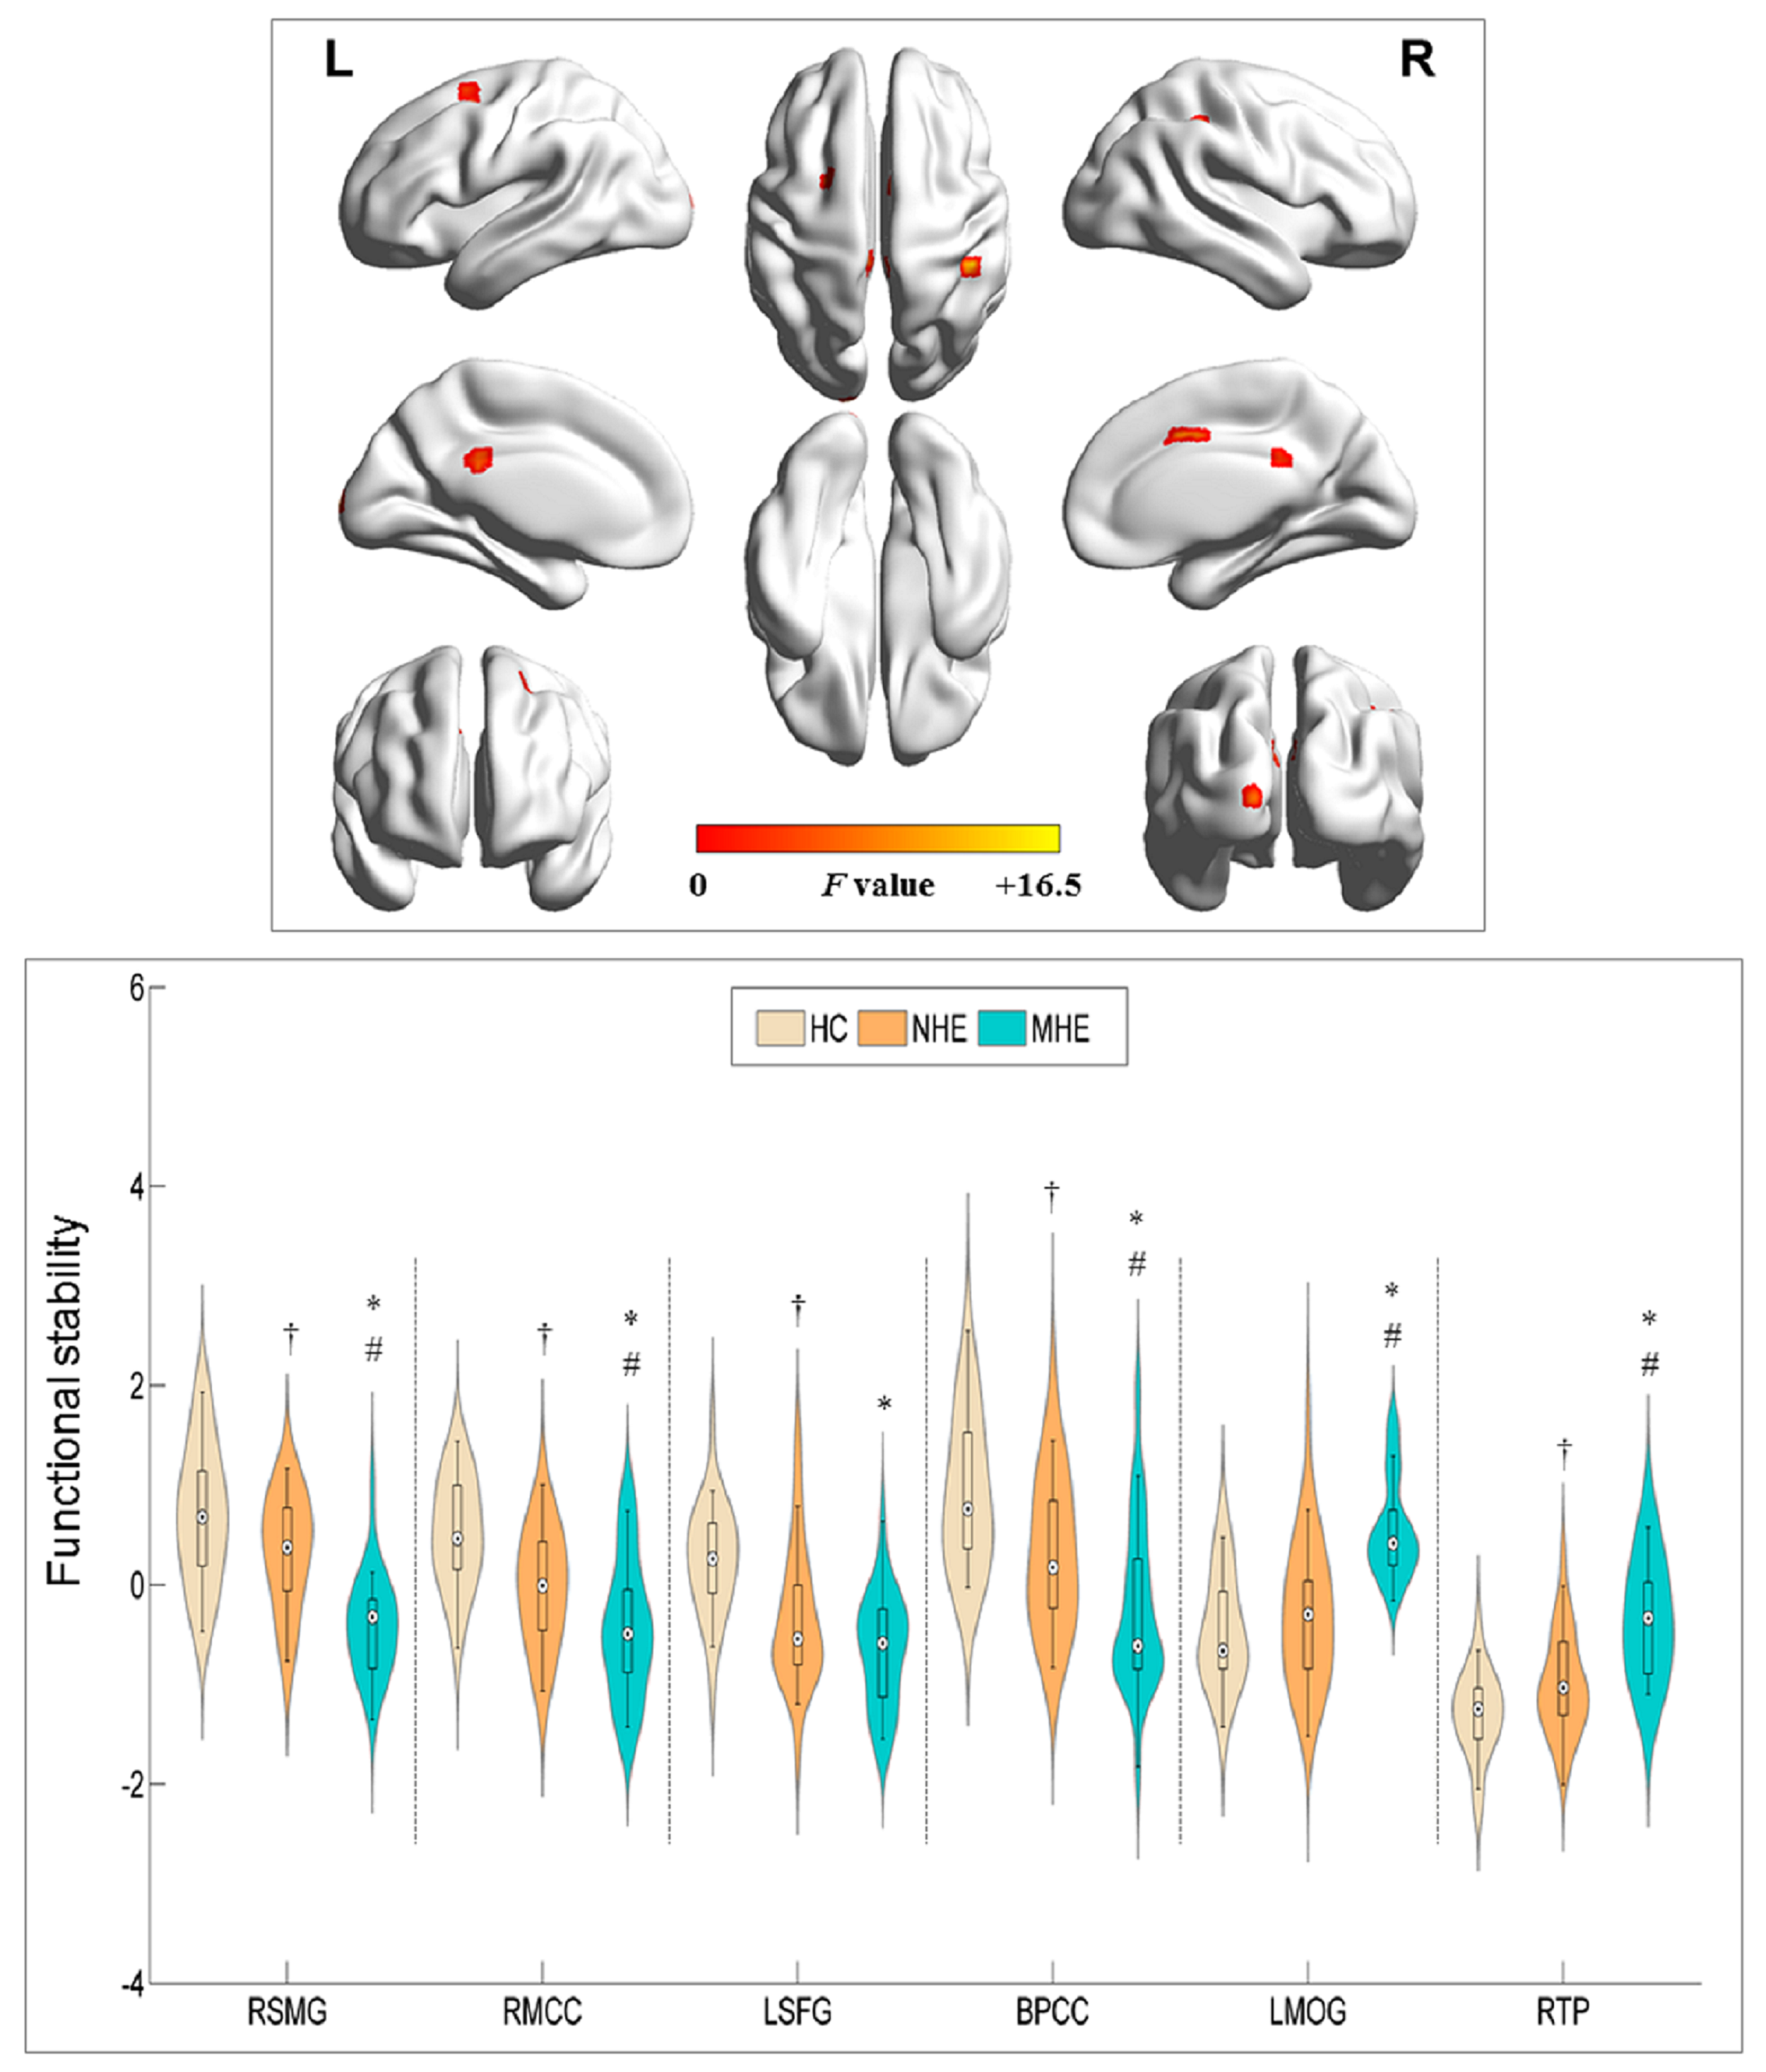
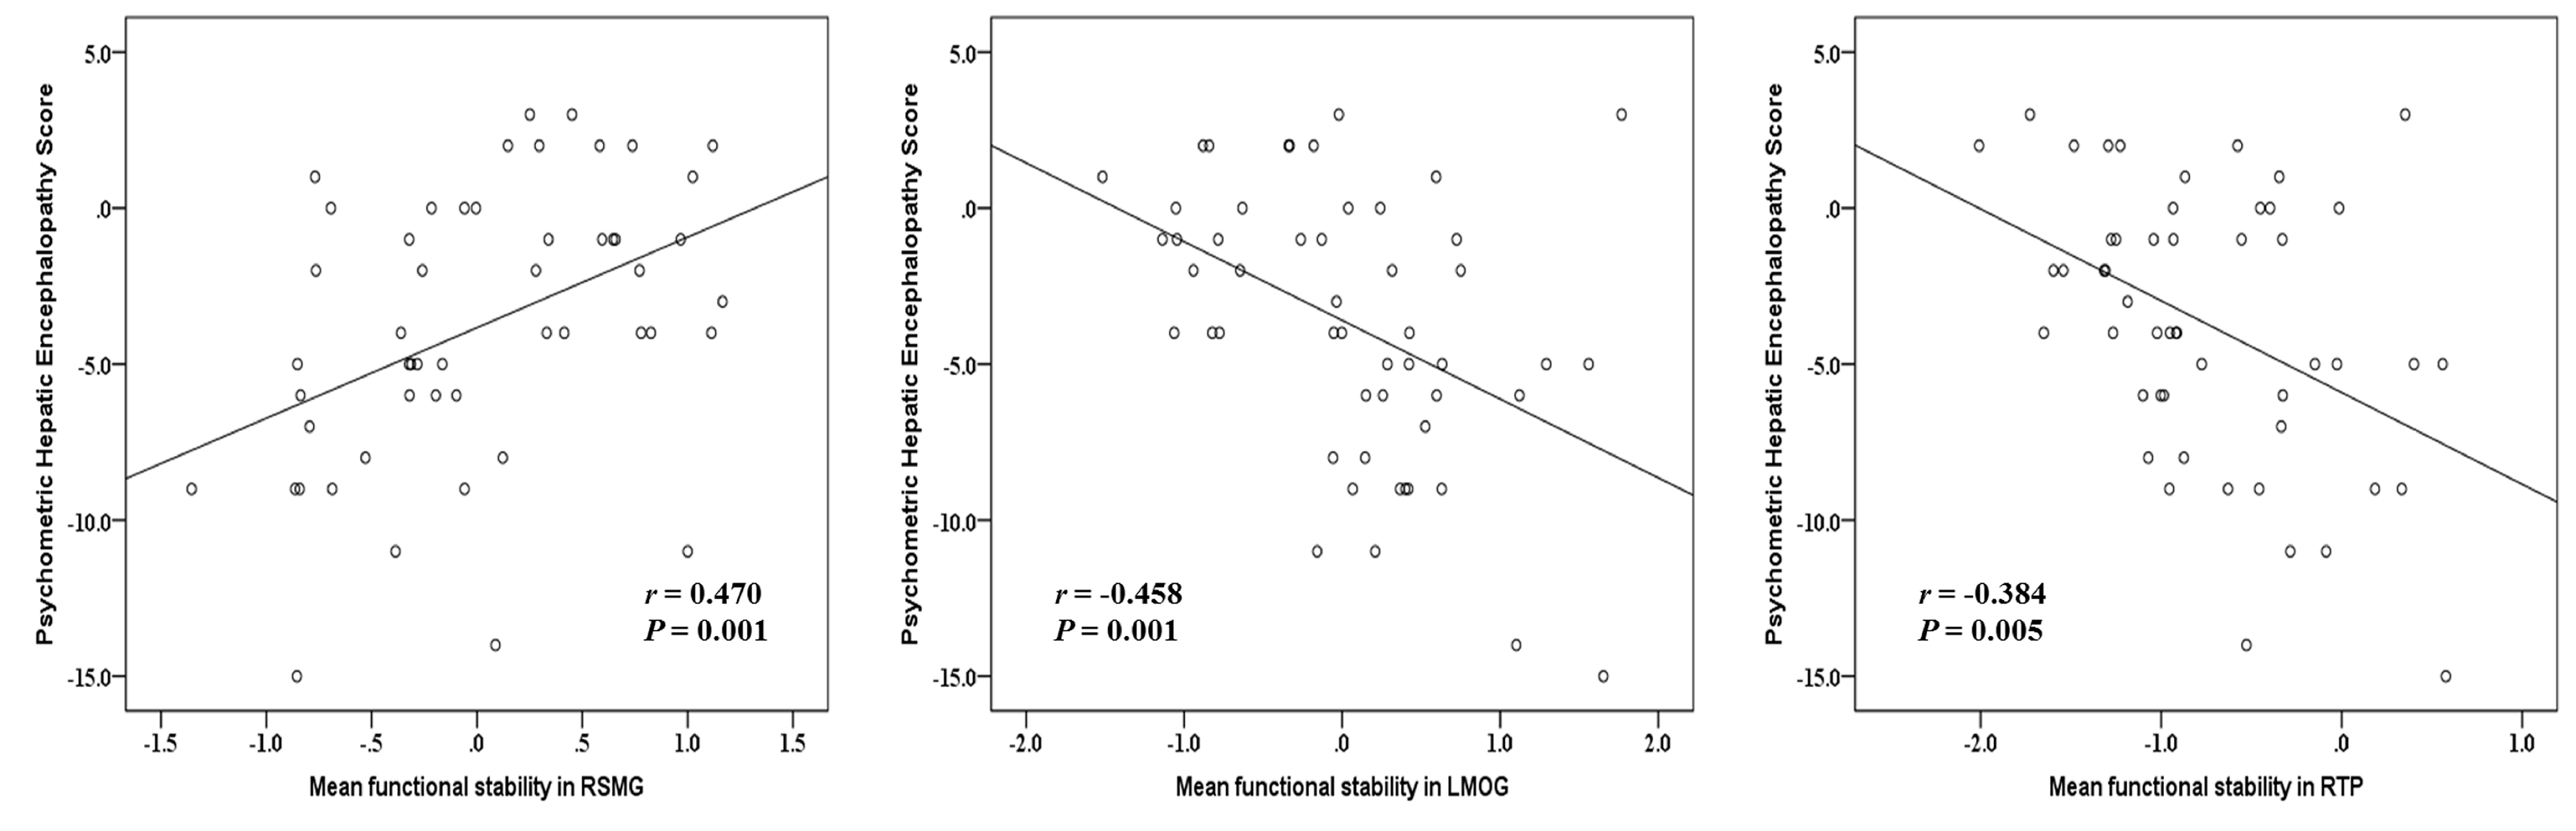
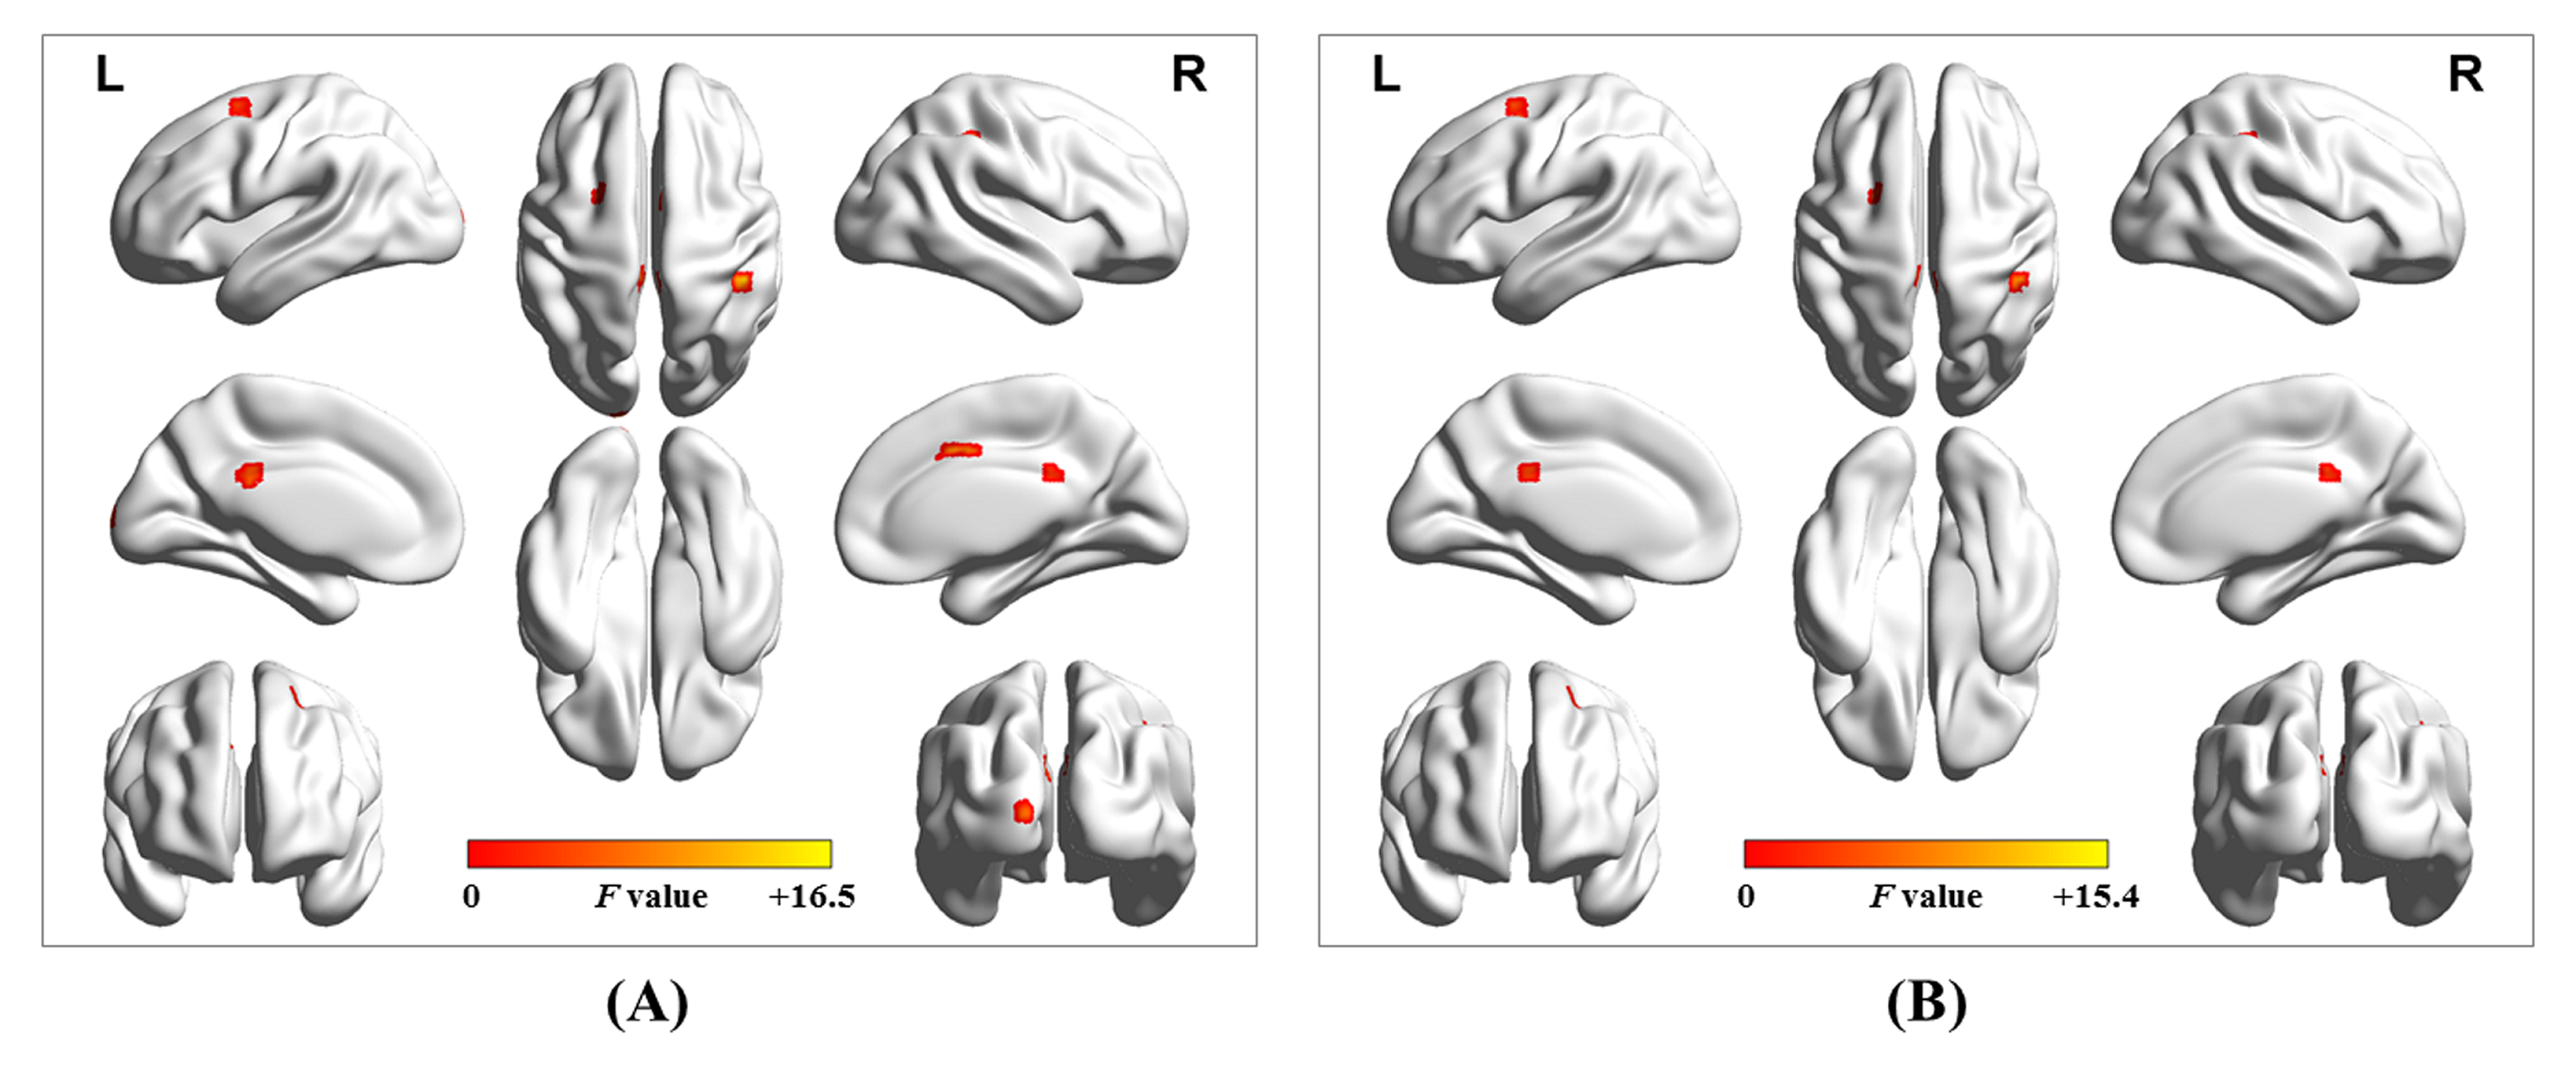
MHE patients required more time to complete the number connection test A and B as well as the serial dotting test, obtained lower scores in the digit symbol test, and poorly performed in the line tracing test. The progressively worse neurocognitive performance was found from NHE to MHE group. A set of brain areas with relatively higher value of functional stability were bilaterally observed in HC group, mainly involving the lateral prefrontal cortex, superior and inferior parietal lobule, posterior cingulate cortex and precuneus, middle cingulate cortex, medial prefrontal cortex, occipital cortex, insula, and lateral temporal cortex. Whereas, several brain areas, including the orbitofrontal cortex, precentral and postcentral cortex, paracentral lobule, temporal pole, medial temporal cortex, and subcortical nucleus, showed the relatively lower functional stability. Also, the NHE and MHE groups exhibited the similar spatial distribution of functional stability (Figure 1). From HC, to NHE, and to MHE group, a stepwise reduction of functional stability was found in right supramarginal gyrus (RSMG), right middle cingulate cortex (RMCC), left superior frontal gyrus (LSFG), bilateral posterior cingulate cortex (BPCC); whereas, a progressive increment of functional stability was observed in left middle occipital gyrus (LMOG), and right temporal pole (RTP)(Figure 2). Correlation analyses revealed a significant positive correlation between mean functional stability in RSMG and PHES score (r = 0.470 and P = 0.001) and the negative correlation between mean functional stability in LMOG/RTP and PHES score (r = -0.458 and P = 0.001; r = -0.384 and P = 0.005, respectively) in the cirrhotic patients (Figure 3). The FS index in RSMG/LMOG/BPCC/RTP showed moderate discrimination potential between NHE and MHE groups.Conclusions
FS alteration may be related to neuropathological bias of cognitive impairment in cirrhotic patients and could be potential biomarkers serving for the diagnosis about MHE and monitoring progression of hepatic encephalopathy.Acknowledgements
The National Natural Science Foundation of China (No. 82071900), Fujian Provincial Science Fund for Distinguished Young Scholars (No. 2018J06023), and Fujian Province Joint Funds for the Innovation of Science and Technology (No. 2019Y9067) supported this study.References
- <biswal1995.pdf>.
- Tomasi D, Volkow ND (2010) Functional connectivity density mapping. Proc Natl Acad Sci U S A 107:9885-9890
- Qi R, Zhang LJ, Chen HJ et al (2015) Role of local and distant functional connectivity density in the development of minimal hepatic encephalopathy. Sci Rep 5:13720
- Deco G, Jirsa VK, McIntosh AR (2011) Emerging concepts for the dynamical organization of resting-state activity in the brain. Nat Rev Neurosci 12:43-56
- Li L, Lu B, Yan CG (2020) Stability of dynamic functional architecture differs between brain networks and states. Neuroimage 216:116230
- Li X, Zhang Y, Meng C et al (2021) Functional stability predicts depressive and cognitive improvement in major depressive disorder: A longitudinal functional MRI study. Prog Neuropsychopharmacol Biol Psychiatry 111:110396
Figures
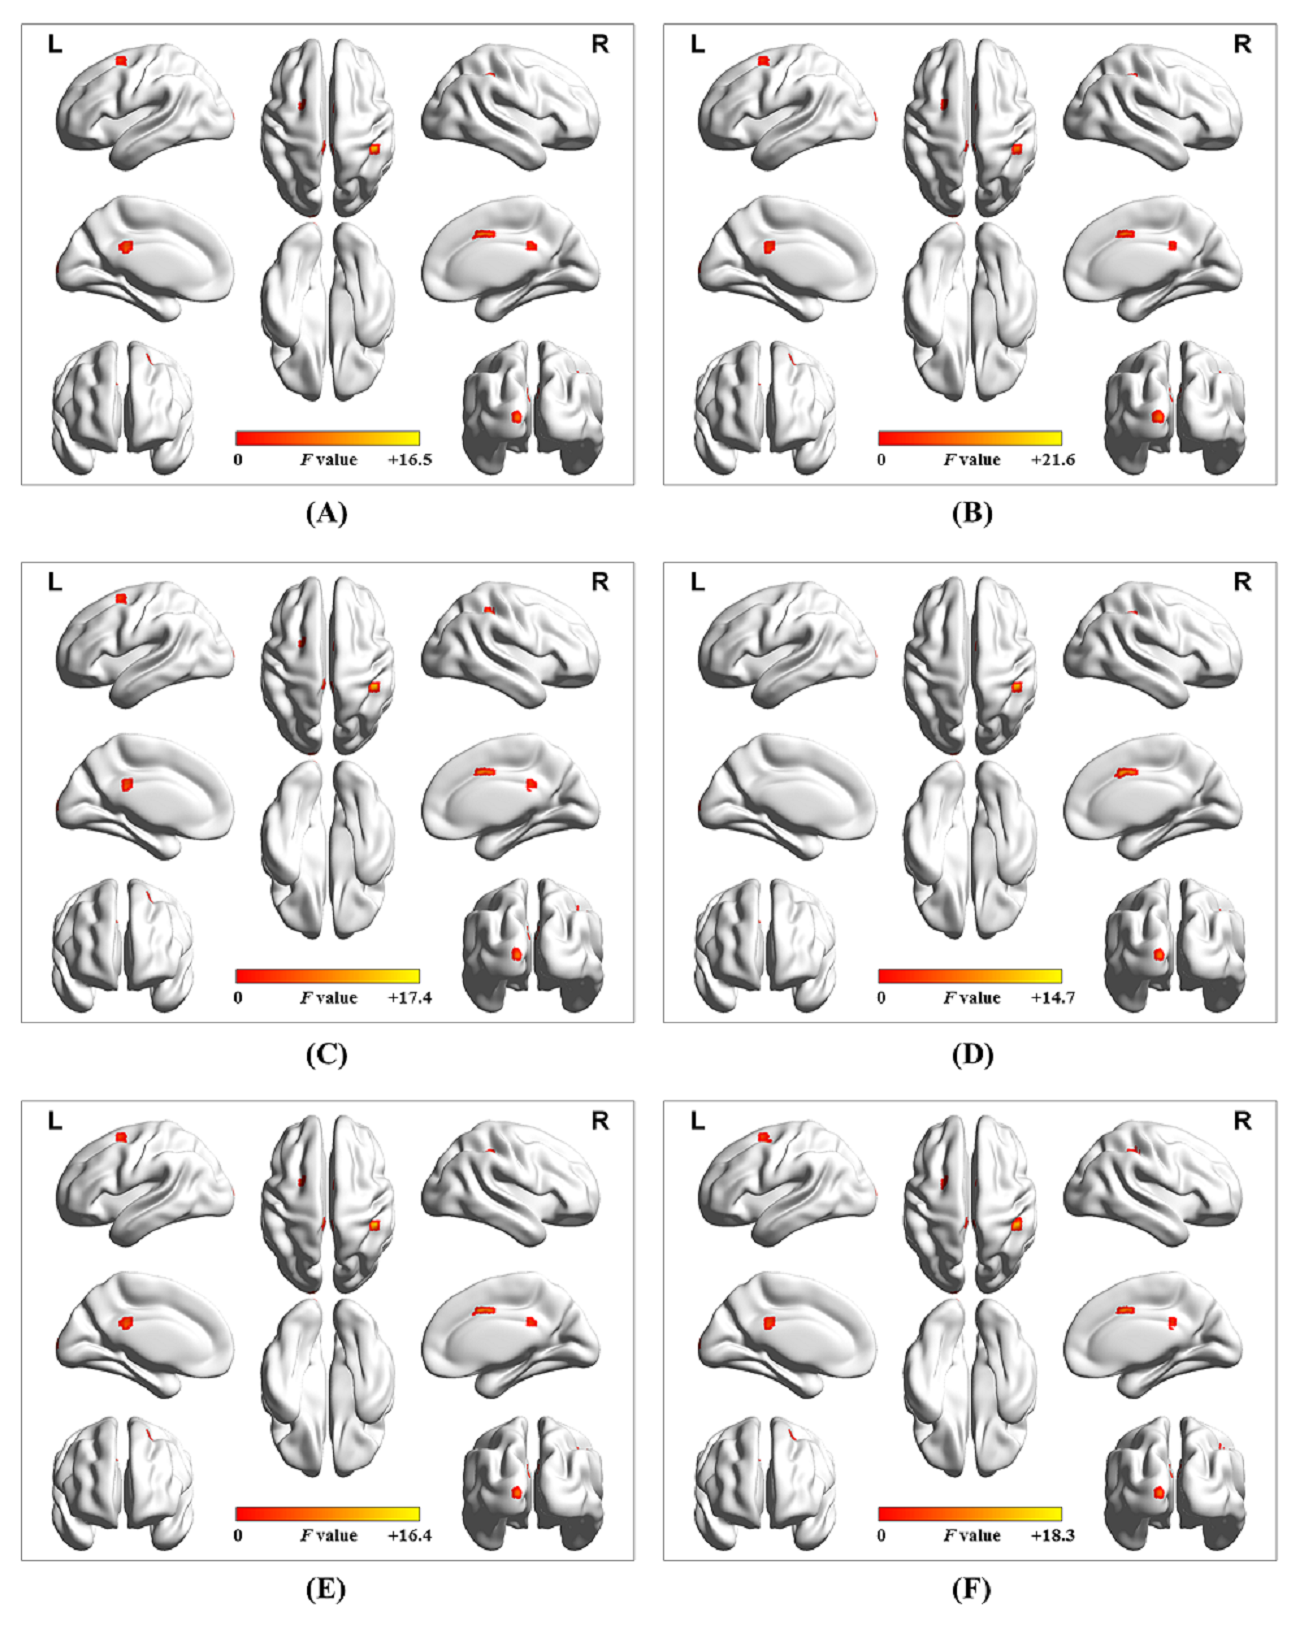
Supplementary figure 2.Findings showed no significant difference among different sliding-window parameter settings: (A) window size = 64 s, sliding step = 4 s, and rectangular window type; (B) window size = 32 s, sliding step = 4 s, and rectangular window type; (C) window size = 48 s, sliding step = 4 s, and rectangular window type; (D) window size = 80 s, sliding step = 4 s, and rectangular window type; (E) window size = 64 s, sliding step = 2 s, and rectangular window type; and (F) window size = 64 s, sliding step = 4 s, and Hamming window type.