3031
Altered functional connectivity associated with cognitive impairment in neuromyelitis optica spectrum disorder1The First Affiliated Hospital of Soochow University, Suzhou, China, 2Philips Healthcare, Shanghai, China
Synopsis
Patients with neuromyelitis optica spectrum disorder (NMOSD) develop cognitive symptoms during the course of disease. We observed decreased intra- and internetwork connectivity in the main cognitive networks by Independent Component Analysis in cognitively impaired patients compared to cognitively preserved patients and healthy controls. The decreased intra- and internetwork connectivity was significantly correlated with cognitive performance in the whole NMOSD group. Our findings indicated that aberrant connectivity patterns across the main cognitive networks might suggest the neural substrates underlying cognitive decline in NMOSD.
Introduction
In recent years, cognitive impairment in NMOSD has attracted increasing attention. It has been highlighted that 29%–67% of cases could develop cognitive symptoms during the course of disease1, which exerts a significant impact on patient’s quality of life and disease prognosis. Independent Component Analysis (ICA) represents a data-driven method that allows for the identification and extraction of brain networks and the further study of intra- and internetwork functional connectivity (FC)2. We aimed to investigate the FC abnormalities within and between the main cognitive networks in cognitively impaired patients with NMOSD and reveal the correlations with cognitive performance.Methods
Thirty-four patients with NMOSD and 39 healthy controls (HC) were included and underwent neuropsychological evaluations. The resting-state functional magnetic resonance imaging (rs-fMRI) scanning was performed on a 3.0 T MRI scanner (Philips Ingenia, Philips Healthcare, Best, The Netherlands). Patients were classified as cognitively impaired (CI; n = 16) and cognitively preserved (CP; n = 18) according to their neuropsychological performance3. Seven components representing six main cognitive networks (left and right frontoparietal networks [lFPN and rFPN], anterior and posterior default mode networks [aDMN and pDMN], dorsal attention network [DAN], and executive control network [ECN]) (Figure 1) were selected by group ICA of fMRI Toolbox (GIFT)4. The difference in intranetwork FC among CI, CP, and HCs was evaluated using the Data Processing & Analysis of Brain Imaging (DPABI) toolbox5. The difference in internetwork FC among groups and the association of the altered FC measures with clinical and neuropsychological characteristics of patients were assessed using the SPSS software (version 26.0). The ability of altered FC measures in differentiating between CI and CP patients was evaluated by receiver operating characteristic analyses in MedCalc software (version 20.0.4).Results
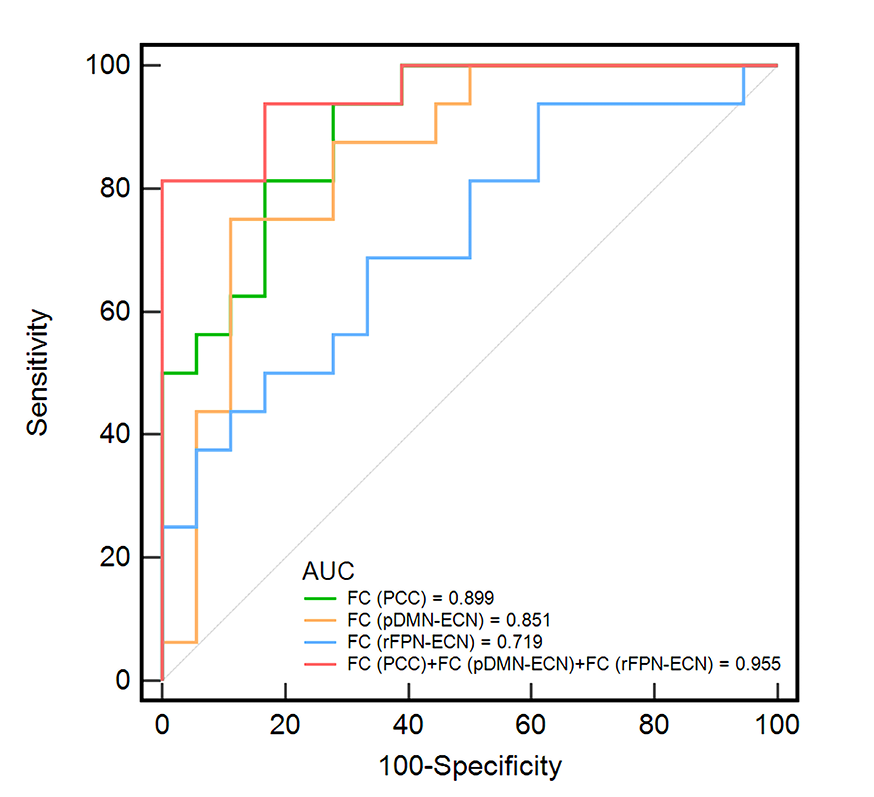
The CI group showed decreased intranetwork connectivity in the pDMN compared with HCs (P < 0.05, GRF corrected; Figure 2), as well as decreased internetwork connectivity between the ECN and pDMN, and between the ECN and rFPN compared with CP and HC groups (Figure 3). Decreased FC measures were significantly correlated with cognitive performance and EDSS scores in the whole NMOSD group (Figure 2 and 4). The combined application of the three FC measures showed a high area under the curve of 0.955 (95% confidence interval 0.823–0.997) (Figure 5).Discussion
The reduced network interaction in pDMN may contribute to ineffective information transfer and processing, thus resulting in worse cognitive performance. Consistently, previous studies also demonstrated the involvement of DMN in cognitive decline in NMOSD, as manifested by structural and functional alterations6, 7. Taken together, these findings reflected the vulnerability of DMN in NMOSD, which may be partly attributable to its high oxygen consumption and blood flow8. In addition, we found a negative association between the disrupted FC in pDMN and the EDSS scores in NMOSD patients, indicating that a decline in FC might be the result of brain damage following diverse types of noxious events. The CI group showed decreased internetwork connectivity between the ECN and pDMN, and between the ECN and rFPN. Thus, our study provides evidence that the disconnection involving the executive control (ECN, rFPN) system and the default mode system mediates the deterioration of cognitive performance in NMOSD patients. Interestingly, the decreased internetwork connectivity in the CI group was dominated by ECN-related alterations, suggesting the vulnerability of ECN in NMOSD and its role as a major contributor to brain network reconfiguration in cognitive decline in NMOSD.Conclusion
Our findings indicated that aberrant connectivity patterns across the main cognitive networks may suggest the neural substrates underlying cognitive decline in NMOSD and FC analysis might contribute to the detection of cognitive impairment in NMOSD.Acknowledgements
This work was supported by the program for Gusu Medical Talent of Suzhou City [GSWS2020009, GSWS2020019]; the Translational Research Grant of NCRCH [2020WSB06]; the National Natural Science Foundation of China [81671743, 81971573]; the Clinical Key Diseases Diagnosis and Therapy Special Project of Health and Family Planning Commission of Suzhou [LCZX201801]; the program for Advanced Talents within Six Industries of Jiangsu Province [WSW-057]; and the High-level Health Personnel ‘six-one’ Project of Jiangsu Province in China [LGY2016035].References
1. Czarnecka D, Oset M, Karlinska I, Stasiolek M. Cognitive impairment in NMOSD-More questions than answers. Brain Behav. 2020;10(11):e01842.
2. van de Ven VG, Formisano E, Prvulovic D, Roeder CH, Linden DE. Functional connectivity as revealed by spatial independent component analysis of fMRI measurements during rest. Hum Brain Mapp. 2004;22(3):165-178.
3. Liu Y, Fu Y, Schoonheim MM, et al. Structural MRI substrates of cognitive impairment in neuromyelitis optica. Neurology. 2015;85(17):1491-1499.
4. Calhoun VD, Adali T, Pearlson GD, Pekar JJ. A method for making group inferences from functional MRI data using independent component analysis. Hum Brain Mapp. 2001;14(3):140-151.
5. Yan CG, Wang XD, Zuo XN, Zang YF. DPABI: Data Processing & Analysis for (Resting-State) Brain Imaging. Neuroinformatics. 2016;14(3):339-351.
6. Zheng Q, Chen X, Xie M, et al. Altered structural networks in neuromyelitis optica spectrum disorder related with cognition impairment and clinical features. Mult Scler Relat Disord. 2021;48:102714.
7. Savoldi F, Rocca MA, Valsasina P, et al. Functional brain connectivity abnormalities and cognitive deficits in neuromyelitis optica spectrum disorder. Mult Scler. 2020;26(7):795-805.
8. Crossley NA, Mechelli A, Scott J, et al. The hubs of the human connectome are generally implicated in the anatomy of brain disorders. Brain. 2014;137(Pt 8):2382-2395.
Figures
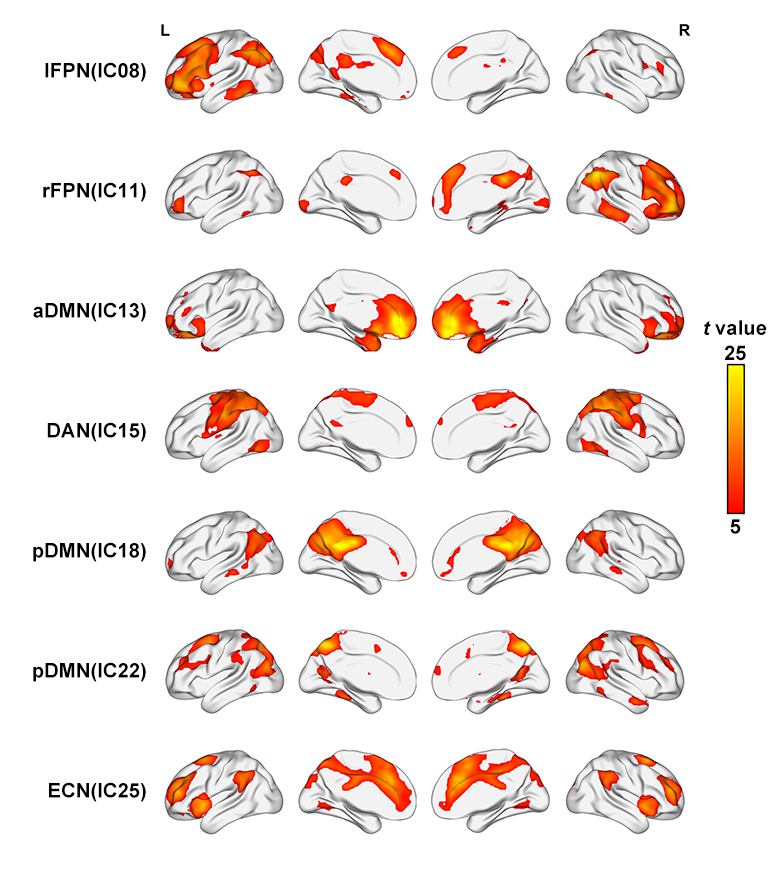
Figure 1 Spatial maps of 7 selected independent components. L, left; R, right; IC, independent component; lFPN, left frontoparietal network; rFPN, right, right frontoparietal network; aDMN, anterior default mode network; DAN, dorsal attention network; pDMN, posterior default mode network; ECN, executive control network.
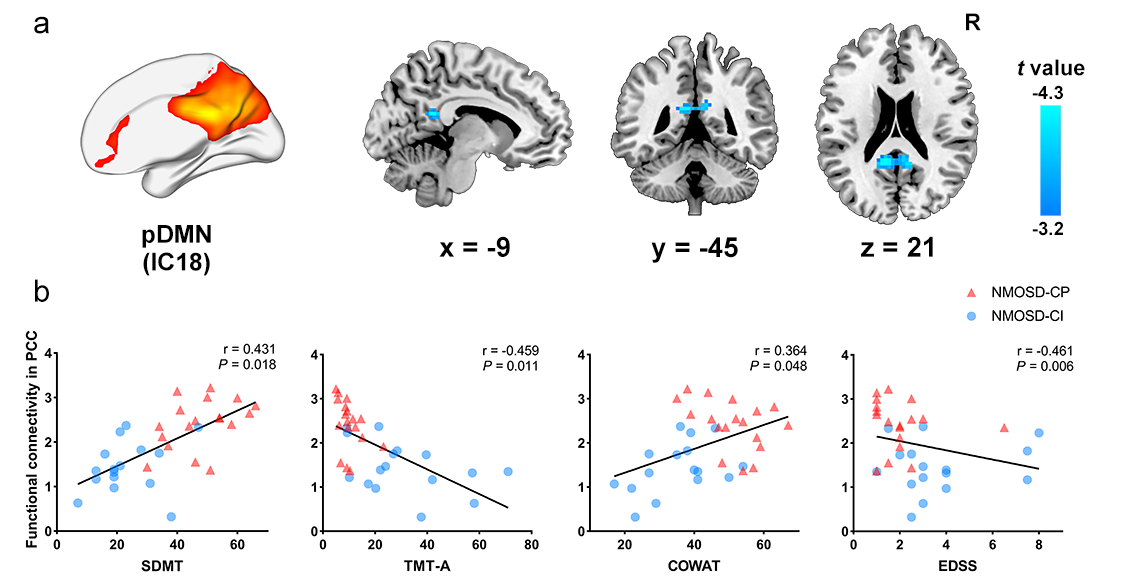
Figure 2 Difference in intranetwork functional connectivity between CI and HC groups and its correlations with EDSS and cognitive scores in NMOSD. pDMN, posterior default mode network; IC, independent component; PCC, posterior cingulate cortex; SDMT, Symbol Digit Modalities Test; TMT-A, Trail-making test part A; COWAT, Controlled Oral Word Association Test; EDSS, Expanded Disability Status Scale.
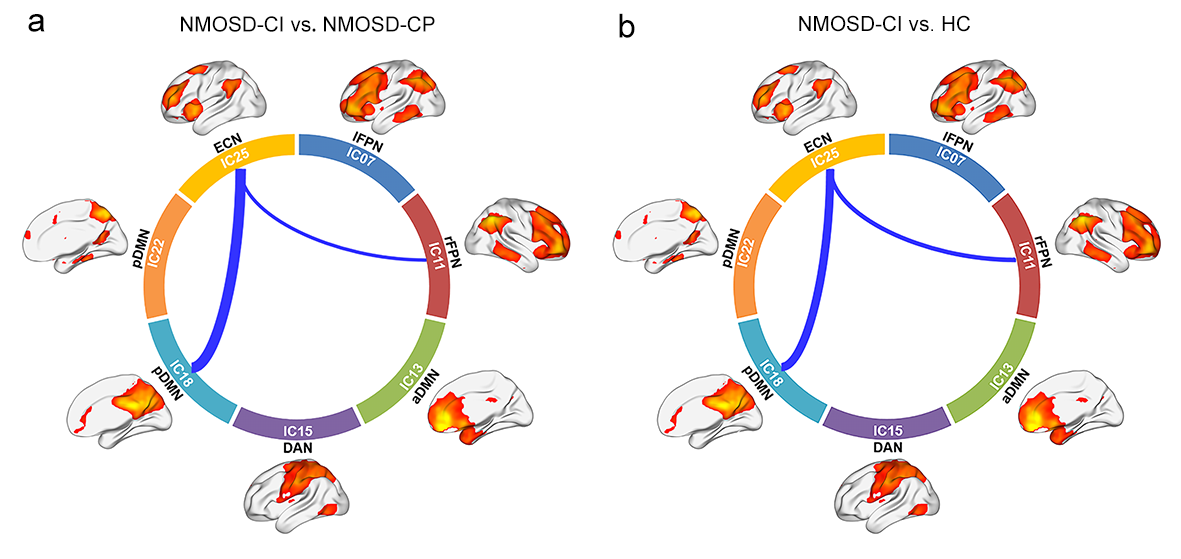
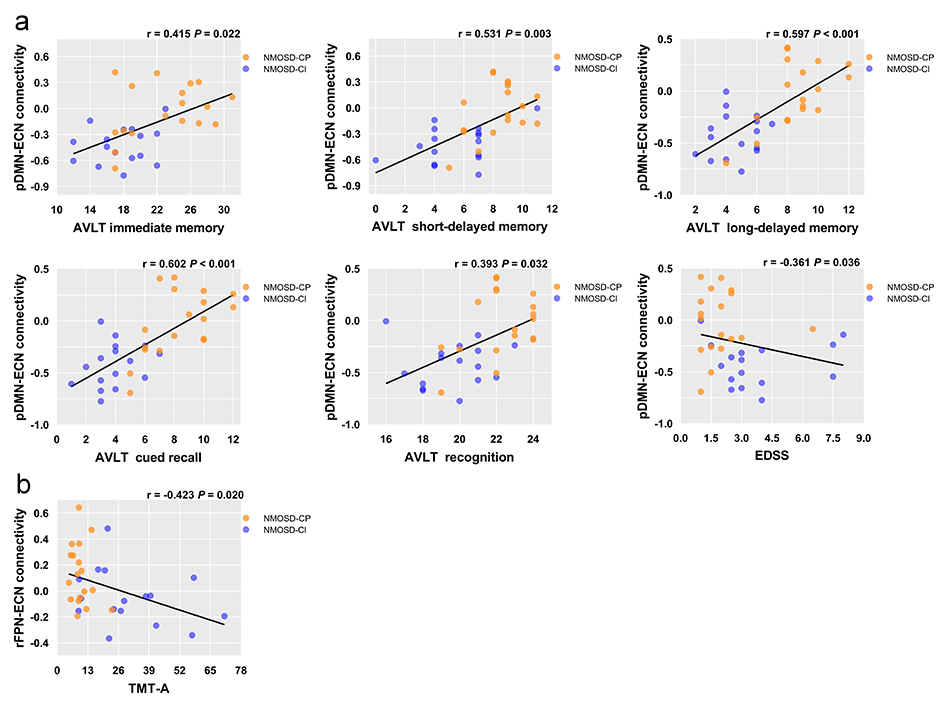
Figure 4 Correlations between internetwork functional connectivity and EDSS and cognitive scores in the whole NMOSD group. NMOSD-CI, cognitively impaired patients with NMOSD; NMOSD-CP, cognitively preserved patients with NMOSD; pDMN, posterior default mode network; ECN, executive control network; AVLT, Auditory Verbal Leaning Test; EDSS, Expanded Disability Status Scale; rFPN, right frontoparietal network; TMT-A, Trail-making test part A.