3018
Characterising the Common Wiring of the Human Brain1School of Biomedical Engineering, University of Sydney, Sydney, Australia, 2Brain and Mind Centre, University of Sydney, Sydney, Australia, 3Sydney Imaging, University of Sydney, Sydney, Australia
Synopsis
To compare white matter fibre tracks between individuals or within the same individual over time, a diffusion MRI tractography template is essential. Tractography template describes the location and orientation of fibre bundles that build a representative organization of human white matter. Despite numerous recent advances in methods to map human brain connectivity, tractography suffers from several limitations, including the over- and the under-representation of certain fibre populations. By integrating multimodal registration and SIFT2 quantification approach, we explore the most consistent bundles across subjects, which could help us advance our understanding of the common wiring in the human brain.
Introduction
Diffusion MRI tractography is a non-invasive three-dimensional technique to construct representations of white matter fibre tracts, which has many applications for brain connectivity studies1,2,3. Reliable registration is essential when comparing white matter fibre bundles across individuals or in the same individual at different time points to ensure one-to-one fibre correspondence. Multimodal MRI registration yields improved results with high spatial specificity near the cortical grey matter4; yet, the streamlines from the resulting whole-brain template tractogram are still partially over- or under-represented, severely limiting our comprehension of fibre tract variability across subjects. Here, we transform the template tractogram to subject space and apply SIFT25 to inform us about the inter-subject consistency in fibre bundles.Method
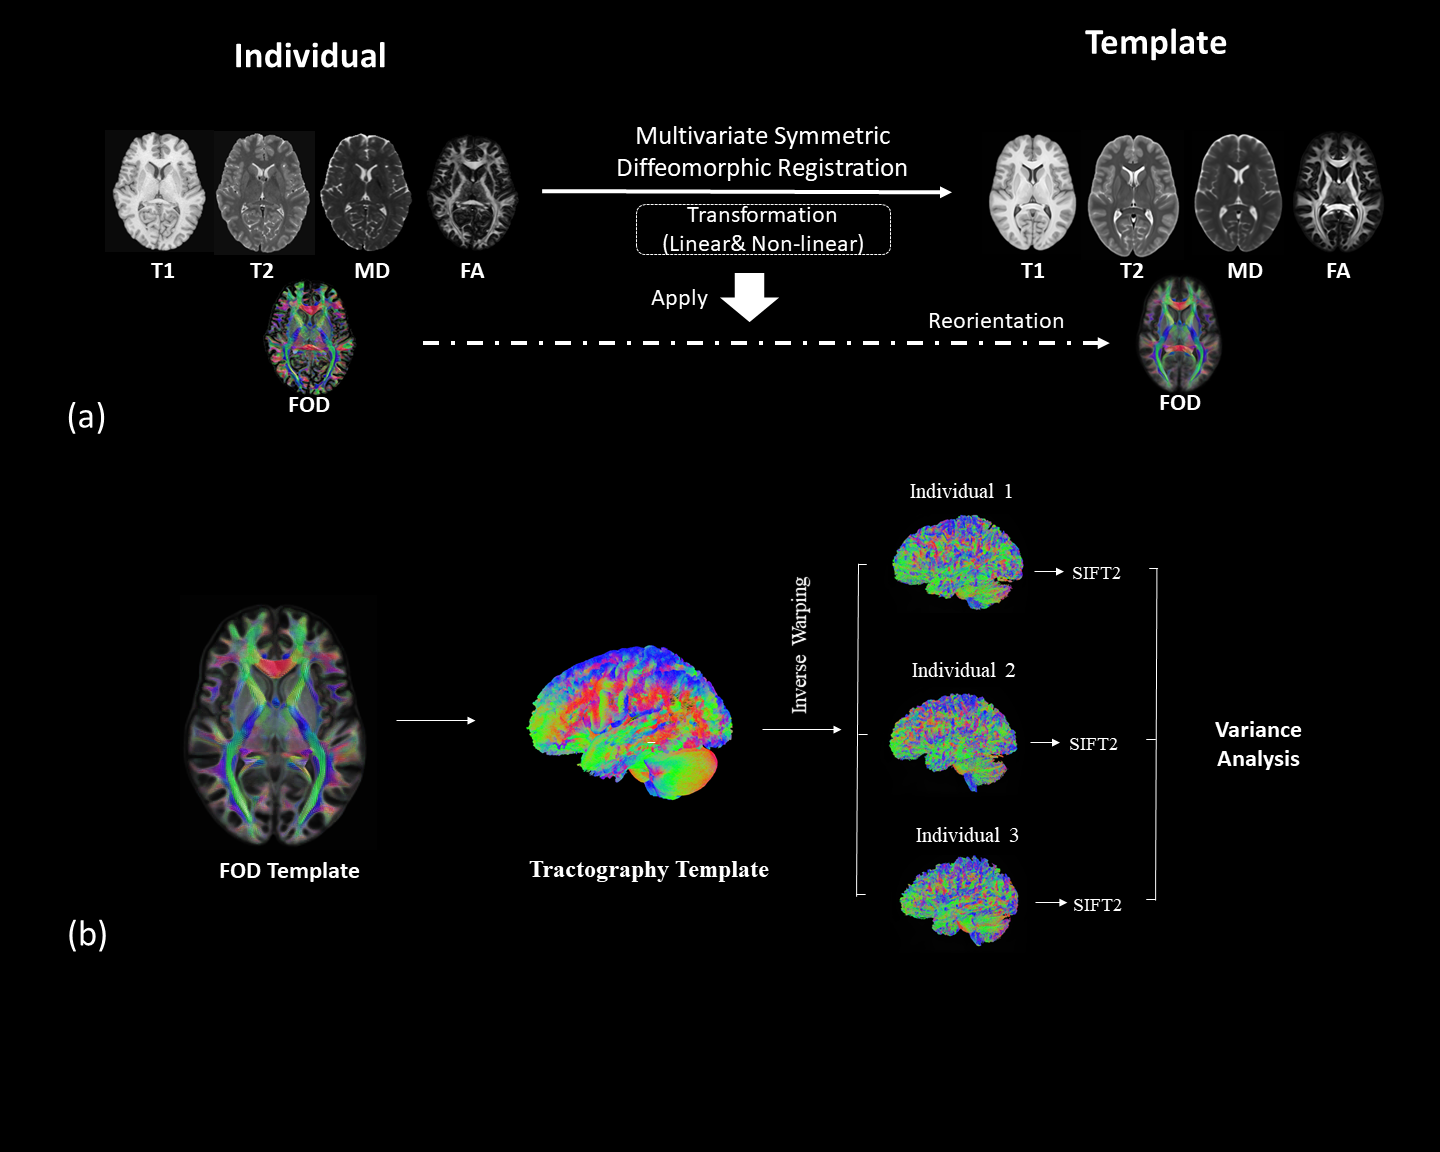
We employed the T1 and T2 weighted MRI and diffusion MRI data of 50 randomly selected healthy young adults from the Human Connectome Project6.We first create multimodal templates from 50 subjects by employing the multivariate symmetric group-wise normalization4,7 method implemented in ANTS (https://github.com/ANTsX/ANTs). Specifically, T1, T2 images and the tensor-based features including mean diffusivity (MD) and fractional anisotropy (FA) derived from dMRI are used as multi-channels to build up a template space. Following that, we warp the fibre orientation distribution (FOD)8 of individuals into template space and averaged them to build up the FOD template (Fig.1a). The FOD template was used to construct a tractography template with 10 million streamlines, which were generated using probabilistic fibre-tracking and the anatomical constrained tracking framework9 using the segmentation of the template T1 (Fig.1b). Later, we warped the tractography template back into each individual space and the SIFT2 algorithm5 was used to compute weights for each streamline, which reflects the agreement between the density of the tractography template and the local FOD in subject space. The Coefficient of Variation (CoV, corresponding to the ratio of the standard deviation to the mean) of SIFT2 weights per streamline across subjects was used as measure of the streamline ‘consistency’ across subjects (e.g. a low CoV indicates a streamline of the template tractogram that was assigned a similar SIFT2 weight for all subjects, and therefore has a similar contribution to structural connectivity quantification for all subjects). To examine the consistent bundles between subjects, we have extracted streamlines using four lowest CoV percentile values: 1) 25-th percentile CoV; 2) 15-th percentile CoV; 3) 10-th percentile CoV; 4) 5-th percentile CoV. These streamlines are mapped on to the track density images10.Results
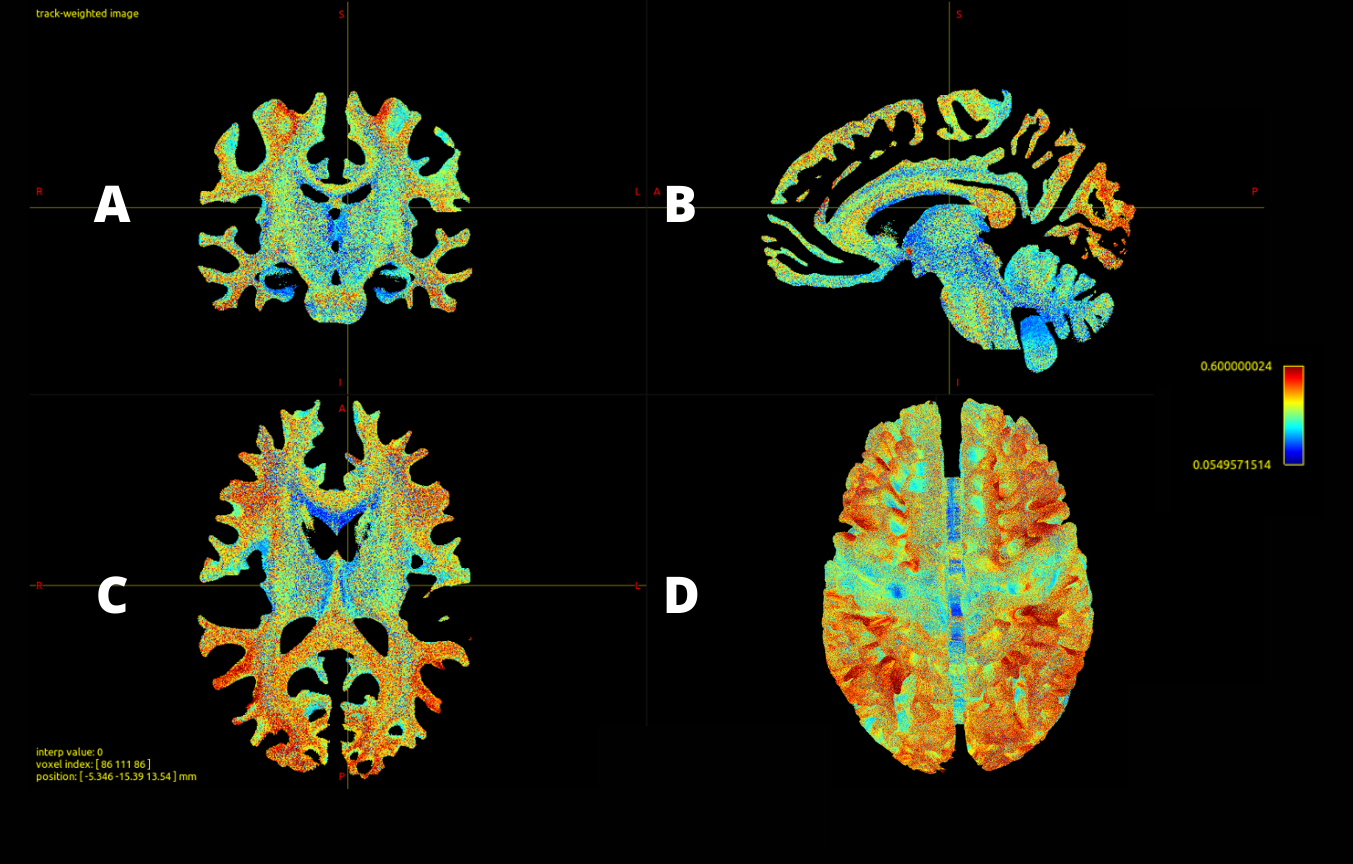
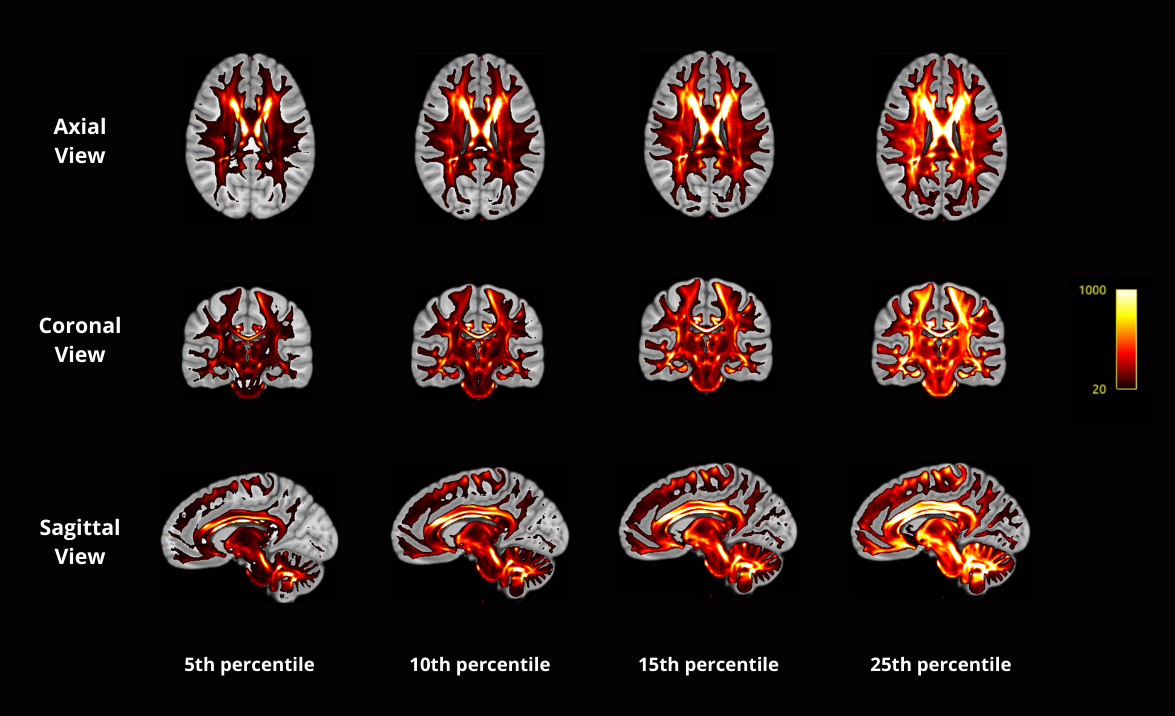
Out of 10 million streamlines, the CoV values of SIFT2 weights across 49 subjects ranged from 0.05 to 1.13, with mean±STD=0.37±0.13, and median±IQR= 0.37±0.18, where STD is standard deviation and IQR the interquartile range. This shows that there is not much difference in the variability of SIFT2 streamline quantification between individuals. The calculated weights CoV are visualized in Fig.2. As can be seen in Fig.2, the level of dispersion around the mean of blueish bundles (e.g. around parts of the corpus callosum, cingulum, superior cerebellar peduncle, among others) are relatively lower than some of the other parts of the brain. In contrast, the pattern of streamlines near the white-matter-grey-matter boundaries are overall more inconsistent, as illustrated by their more reddish colour in Fig.2. These are bundles with larger CoV, which mean either unreliable streamlines or that the variability on SIFT2 weights reflect important ‘personalized’ features between subjects. To better observe the relatively consistent bundles, we display the track density images of streamlines with very low CoV value by filtering the 10m streamlines with lowest 25, 15, 10 and 5 percentile CoV, as shown in Fig.3. The visualization indicates that the low CoV streamlines are spread throughout the whole brain, including both associative and commissural fibres, such as parts of the corpus callosum, cingulum, superior cerebellar peduncle, among others. This either means these streamlines are common wiring, or very easy to track that make SIFT2 model yield a consistent result across individuals.Conclusion
While the multimodal registration gives us a FOD template with very good spatial specificity throughout the white matter (including in the sub-cortical white matter regions), the estimate of accurate representation of the underlying biological fibre densities from the raw diffusion data between template streamlines near the cortical boundaries are inconsistent. The level of dispersion around the mean of weights obtained by the SIFT2 approach around parts of the corpus callosum and other bundles, on the other hand, is relatively low, indicating that they are common bundles between individuals or just simply easy-tracking streamlines. This result provides a step towards our understanding of the common wiring of the human brain.Acknowledgements
No acknowledgement found.References
1Jbabdi, S. et al. Tractography: Where Do We Go from Here?. Brain Connectivity 1, 169-83 (2011).
2He, Y. et al. Graph Theoretical Modeling of Brain Connectivity, Current Opinion in Neurology 23, 341–50 (2010).
3Lazar, M. MAPPING BRAIN ANATOMICAL CONNECTIVITY USING WHITE MATTER TRACTOGRAPHY. NMR in Biomedicine 23, 821-35 (2010).
4Lv, J. et al. Towards an Unbiased Brain Template of Fiber Orientation Distribution Using Multimodal Registration, ISMRM 2021, p. 2849.
5Smith, R. E. et al. SIFT2: Enabling Dense Quantitative Assessment of Brain White Matter Connectivity Using Streamlines Tractography. NeuroImage 119, 2 (2015).
6Van Essen, D. C. et al. The WU-Minn Human Connectome Project: An overview. Neuroimage 80, 62–79 (2013).
7Avants, B. B., Duda, J. T., Zhang, H. & Gee, J. C. Multivariate normalization with symmetric diffeomorphisms for multivariate studies. Lect. Notes Comput. Sci. (including Subser. Lect. Notes Artif. Intell. Lect. Notes Bioinformatics) 4791 LNCS, 359–366 (2007).
8Tournier, J. D. et al. Direct estimation of the fiber orientation density function from diffusion-weighted MRI data using spherical deconvolution. NeuroImage 23, 715-727 (2004).
9Smith, R. E. et al. Anatomically-constrained tractography: Improved diffusion MRI streamlines tractography through effective use of anatomical information. Neuroimage 62, 1924-1938 (2012).
10Calamante, F. et al. Track-density imaging (TDI): Super-resolution white matter imaging using whole-brain track-density mapping. NeuroImage 53, 1233-1243 (2010).
Figures