3016
Pyramidal tract visualization ability of automatic brain white matter extraction software in patients with brain arteriovenous malformations1Radiology Center, The University oh Tokyo Hospital, Tokyo, Japan, 2Department of Neurosurgery, The University oh Tokyo Hospital, Tokyo, Japan, 3Department of Radiology, The University oh Tokyo Hospital, Tokyo, Japan
Synopsis
There are no reports on the use of TractSeg in patients with brain arteriovenous malformations (BAVMs). This study aimed to investigate the effect of the presence of BAVMs on TractSeg findings of the corticospinal tract (CST) and their clinical usefulness. In case of BAVMs through which the CST runs, the visualization was affected, but in most cases, tractography reconstruction was possible. In case of BAVMs through which the CST does not run, the same results as that of normal volunteers were obtained.
Purpose
Recently, the number of studies and clinical reports that combine magnetic resonance imaging (MRI) and artificial intelligence has increased1-4. One approach involves an automatic white matter bundle segmentation software (TractSeg) that uses data from the Human Connectome Projects and research imaging conditions5. There are no reports on the use of TractSeg in patients with cerebrovascular diseases. Originally, our hospital has used Tensor or Q-ball imaging tractography for patients with brain arteriovenous malformations (BAVMs) treated with γ-Knife surgery6. This study aimed to investigate the effect of the presence of BAVMs on TractSeg findings of the corticospinal tract (CST) and their clinical usefulness.Materials and Methods
We used a Siemens 3.0 T MRI MAGNETOM Skyra VE11 system and 20-channel head coil. The study included 7 healthy men and 14 patients with BAVMs localized in the left cerebral hemisphere. Among 14 patients, 7 had AVMs through which the CST run (group A) and 7 had BAVMs through which the CST doesn’t run (group B). For the grouping criteria for patients with BAVMs, after extracting tractography of right CST, We made the mirror tractography (flip left and right). And we set region of interest (ROI) of BAVMs manually and overlaid the tractography result and ROI to T1-weighted imaging. One neurosurgeon and one radiological technologist visually determined how much the affected (left) CST and BAVMs overlapped. If red and blue voxel overlapped even one pixel, it was judged as group A (Fig.1). The parameters were as follows: SMS factor = 2, b-value = 0, 3000 s/mm2, motion probing gradient = 64 directions and b0 image = 1, phase encoding direction = anterior-posterior, field of view = 240 × 240 mm2, number of slices = 60, slice gap = 0, slice thickness = 2.5 mm, matrix = 96 × 96 (voxel size = 2.5 × 2.5 × 2.5 mm3), repetition time (TR)/echo time (TE) = 8900/103 ms, NEX = 1, and scan time = 372 s. Moreover, three-dimensional T1-weighted images (MP-RAGE, TR/TI/TE=1900/962/3.16 ms; flip angle = 9 °; slice thickness/gap = 1.25/0 mm; number of slices = 128, FOV=240 × 240 mm2; matrix size =192 × 192; voxel size = 1.25 × 1.25 × 1.25 mm3; acquisition time = 210 s) were acquired for anatomical information. For distortion correction of diffusion weighted imaging, we added a b0 image with posterior-anterior phase-encoding direction by each condition. As part of the preprocessing, denoising and Gibb’s artifact removal were performed using MRtrix37-11, and distortion correction was performed using FSL version 5.0.9 (topup and eddy)12, 13. Bias correction14 with MRtrix3 was applied to the corrected data. After these preprocessing, volume extraction and depiction of tractography for CST with TractSeg was done. For evaluation, we calculated the number of voxels in the left and right CST and tested the significant differences between the number of voxels of each CST using Wilcoxon signed-rank test. A P-value < 0.05 was considered significant. Moreover, the drawing degree of tractography compared with normal anatomy was evaluated visually.Results
In group A, volume extraction of CST was performed in all cases, but the whole CST in the affected side could not be visualized in one case and the part of the CST beyond the lesion was not visualized in two cases. (Fig.2). The numbers of voxels were as follows: right, 1942, and left, 1610, which showed a significant difference (p < 0.05). The numbers of voxels in healthy subjects and group B were as follows: right, 2137, and left, 2031 and right, 1930 and left, 1974, respectively. There was with no significant difference (p = 0.116 and p = 0.116, respectively) (Fig.3). About tractography, for normal volunteers and group B, all CST was depicted and there was no visual difference between left and right CSTs (Fig.4).Discussion
For group A, the affected side had a significantly lower number of voxels. The localization of BAVMs seems to be related to visualization ability. Moreover, tractography could not be visualized in one. This case may be affected by bleeding and size. However, the area of CST was extracted from the cranial and foot sides, which is more informative than traditional deterministic tractography (Q-ball imaging tractography), suggesting that this method is sufficiently useful (Fig.5). Accuracy verification of the extracted area and investigation of the effects of bleeding and size of BAVMs are necessary. Conversely, group B depicted the CST with the same tendency as normal volunteers. It seems highly clinically useful. There was no significant difference in group B, but the number of visualized voxels on the healthy side tended to be higher despite the presence of BAVMs. It is necessary to investigate whether this is due to the software or subjects. and we have to investigate for other fiber bundles with more cases.Conclusion
In group A (BAVMs through which the CST runs), the drawing was affected, but in most cases, drawing tractography was possible. In group B (BAVMs through which the CST doesn’t run), the same results as that of normal volunteers were obtained. The usefulness of CST visualization using TractSeg has been suggested in patients with BAVMs.Acknowledgements
This study was supported by Grants-in-Aid for Scientific Research (20K08016).References
1) CGB Yogananda, et al. A novel fully automated MRI-based deep-learning method for classification of IDH mutation status in brain gliomas. Neuro Oncol, 2020 Mar 5;22(3):402-411.
2) T Sichtermann, et al. Deep Learning–Based Detection of Intracranial Aneurysms in 3D TOF-MRA. AJNR Am J Neuroradiol, 2019 Jan;40(1):25-32.
3) E Gong, et al. Deep learning enables reduced gadolinium dose for contrast-enhanced brain MRI. J Magn Reson Imaging, 2018 Aug;48(2):330-340.
4) M Kidoh, et al. Deep Learning Based Noise Reduction for Brain MR Imaging: Tests on Phantoms and Healthy Volunteers. Magn Reson Med Sci, 2020: 19(3):195-206.
5) J Wasserthal, et al. TractSeg - Fast and accurate white matter tract segmentation. NeuroImage, 2018: 183:239-253.
6) K Maruyama, et al. Tolerance of pyramidal tract to gamma knife radiosurgery based on diffusion-tensor tractography.
Int J Radiat Oncol Biol Phys
. 2008 Apr 1;70(5):1330-5.
7) J Tournier, et al. MRtrix3: A fast, flexible and open software framework for medical image processing and visualisation. NeuroImage, 2019: 202:116137
8) J Veraart, et al. Diffusion MRI noise mapping using random matrix theory. Magn. Res. Med, 2016: 76(5):1582–1593.
9) J Veraart, et al. Denoising of diffusion MRI using random matrix theory. NeuroImage. 2016: 142:394–406.
10) L Cordero-Grande, et al. Complex diffusion-weighted image estimation via matrix recovery under general noise models. NeuroImage. 2019: 200: 391-404.
11) E Kellner, et al. Gibbs-ringing artifact removal based on local subvoxel-shifts. Magn Reson Med. 2016: 76:1574–1581.
12) S.M. Smith, et al. Advances in functional and structural MR image analysis and implementation as FSL. NeuroImage. 2004: 23(S1):208-219.
13) J.L.R. Andersson, et al. How to correct susceptibility distortions in spin-echo echo-planar images: application to diffusion tensor imaging. NeuroImage. 2003: 20(2):870-888.
14) N Tustison, et al. N4ITK: Improved N3 Bias Correction. IEEE Transactions on Medical Imaging. 2010: 29:1310-1320.
Figures
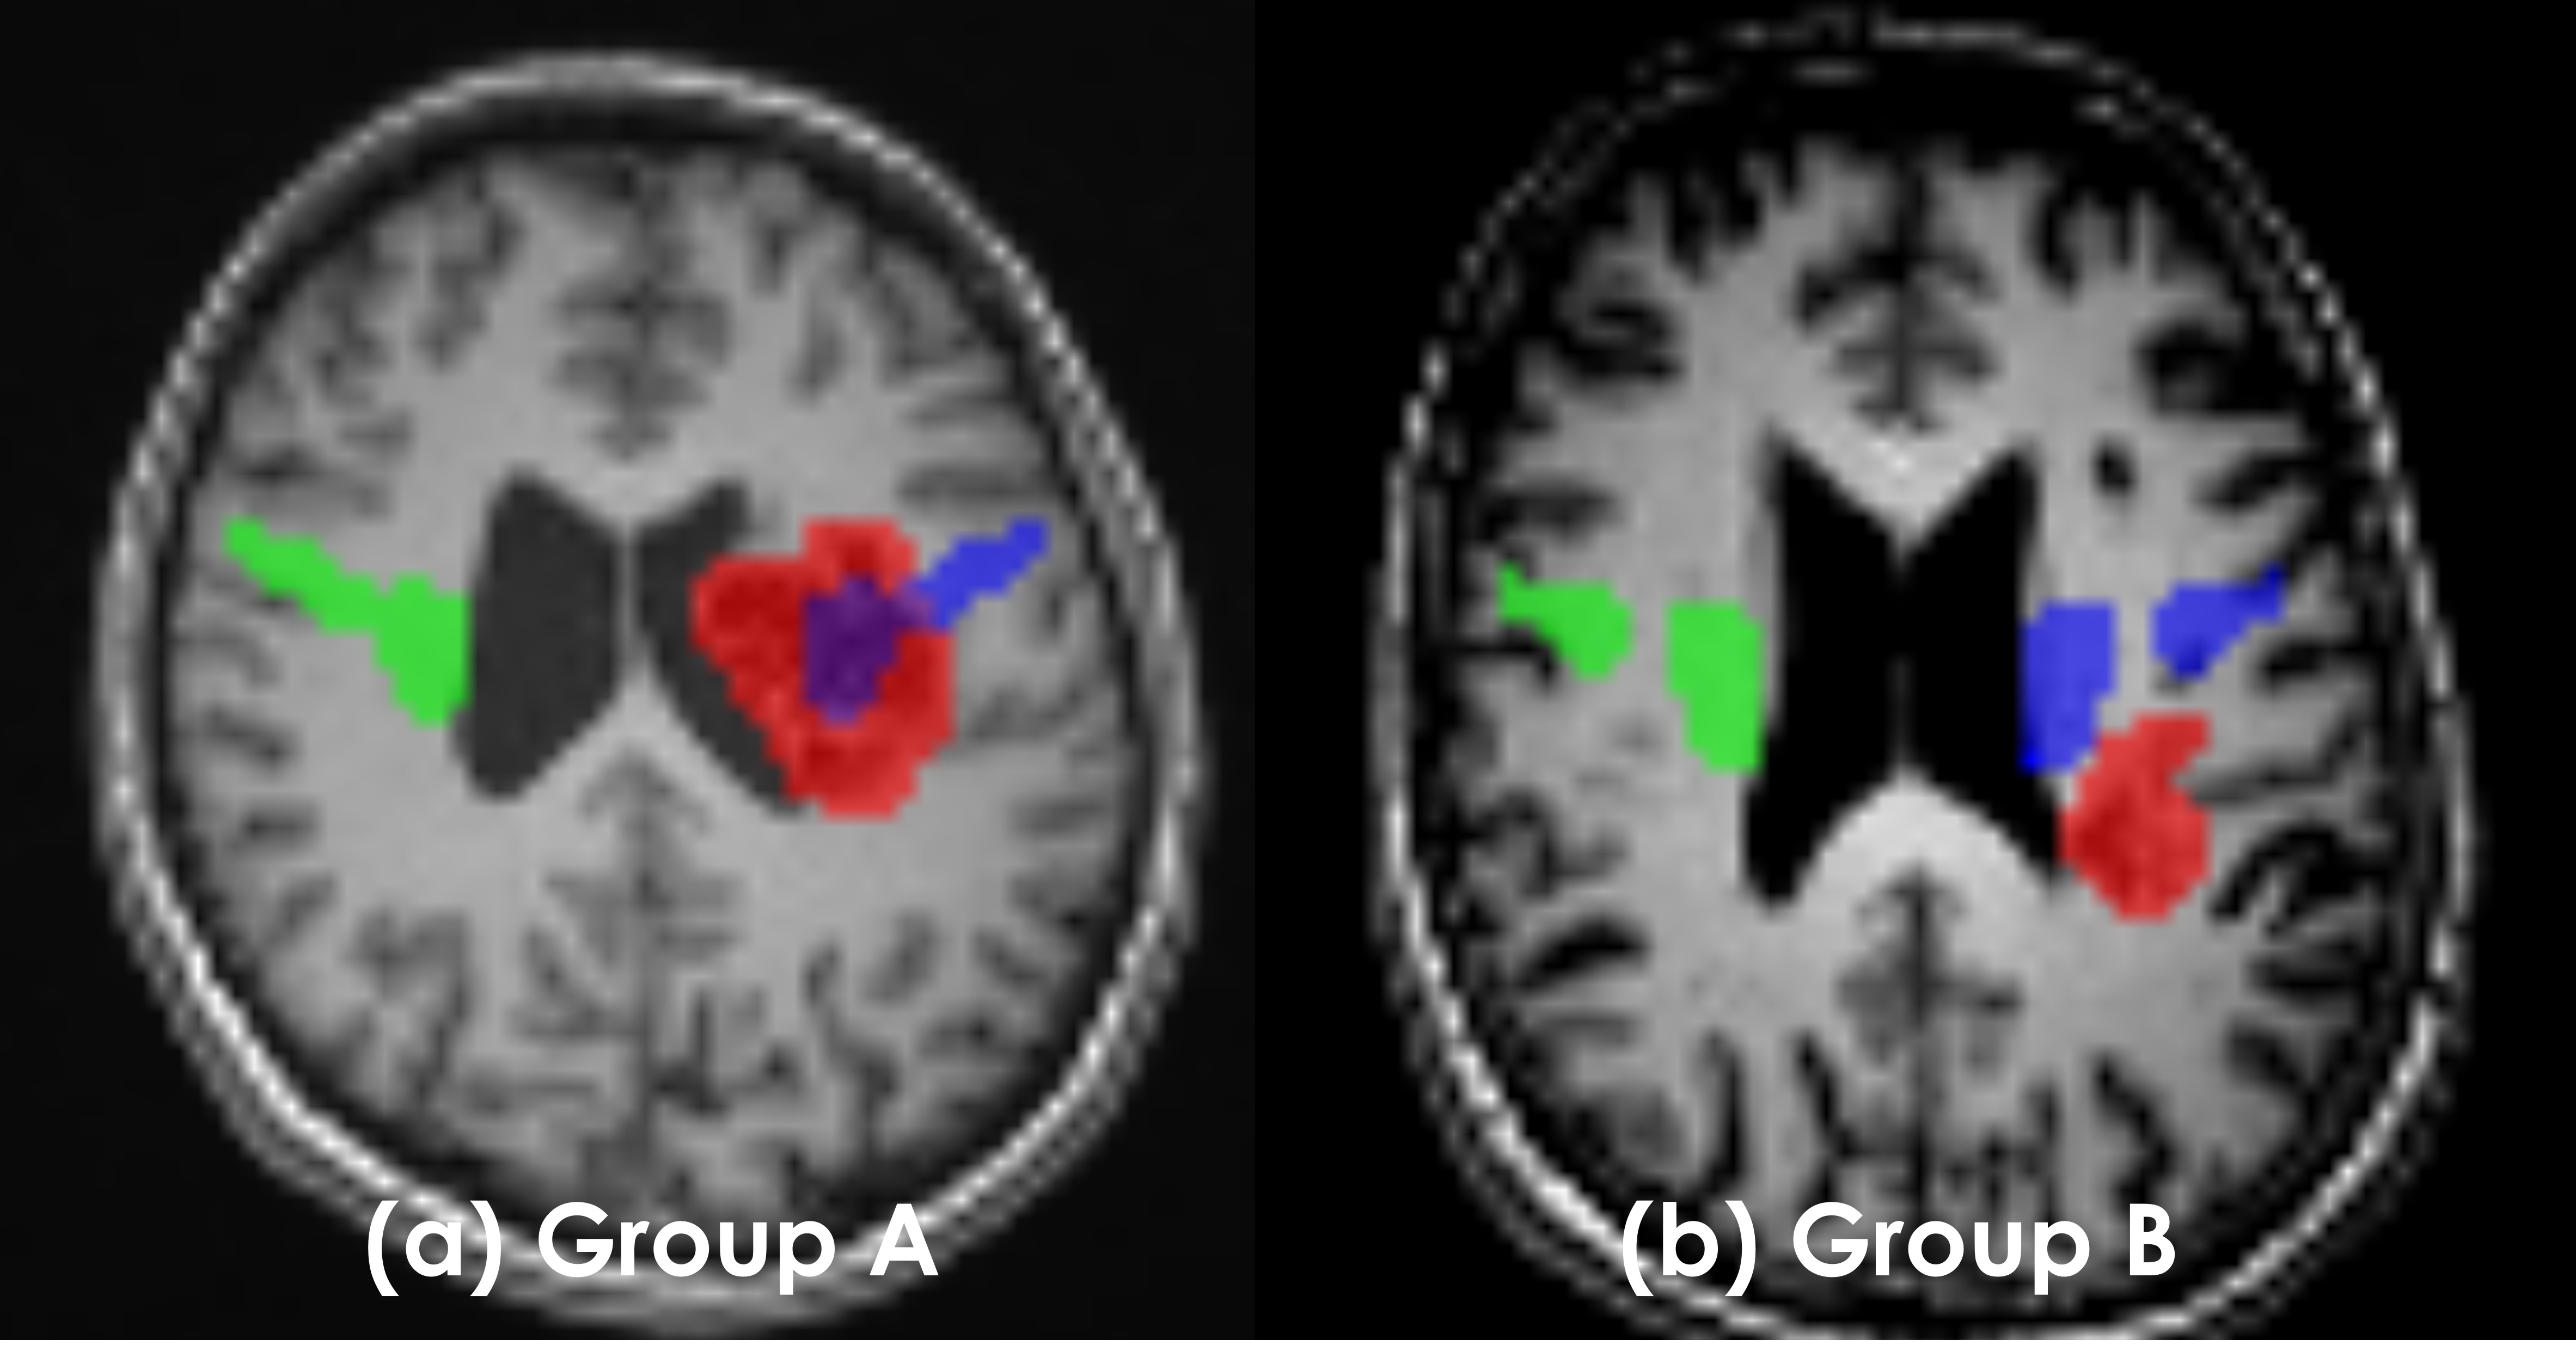
Fig.1. Grouping criteria for BAVM patients The categorization was decided by the consensus of one neurosurgeon and one radiological technologist. The flow was as follows.
1. Extraction tractography of right CST (green voxel)
2. Making the mirror tractography; LR flip right CST (blue voxel)
3. Setting ROI of BAVMs manually (red voxel)
4. Overlaid mirror tractography and ROI to TIWI
5. Visually determined how much the affected (left) CST and BAVMs overlapped
(If red and blue voxel overlapped even one pixel, it was judged as group A)
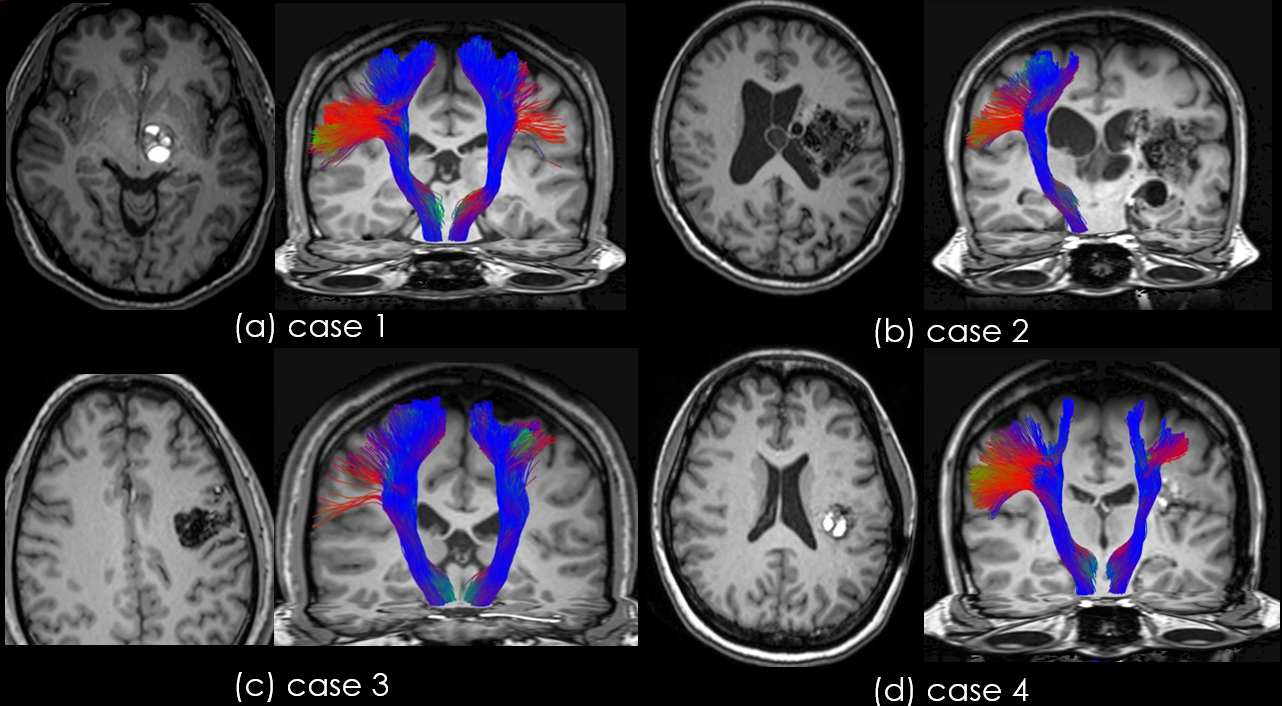
Fig.2. Example results image of group A The results showed various patterns. (a) AVM was present in the brain stem, but the left CST were not significantly different to the right CST
(b) left CST could not be visualized
(c) and (d) the part of the tractography beyond the lesion was not visualized in two cases
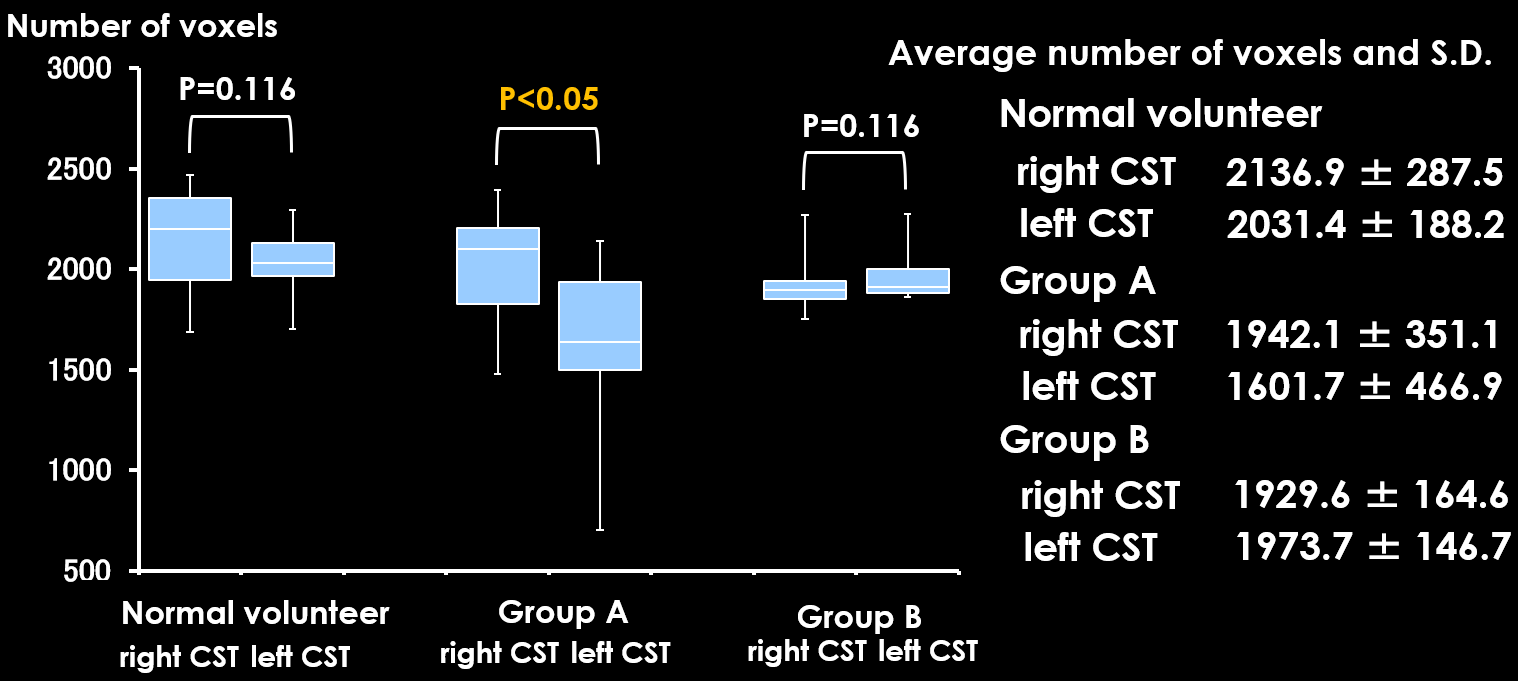
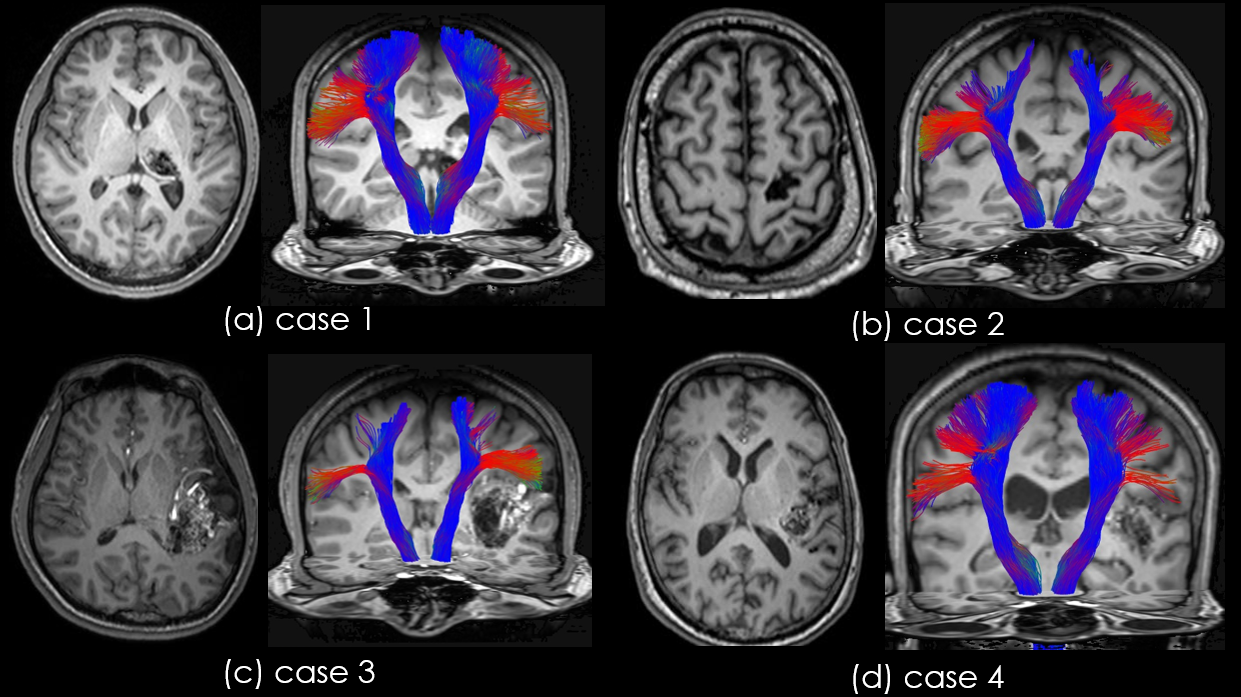
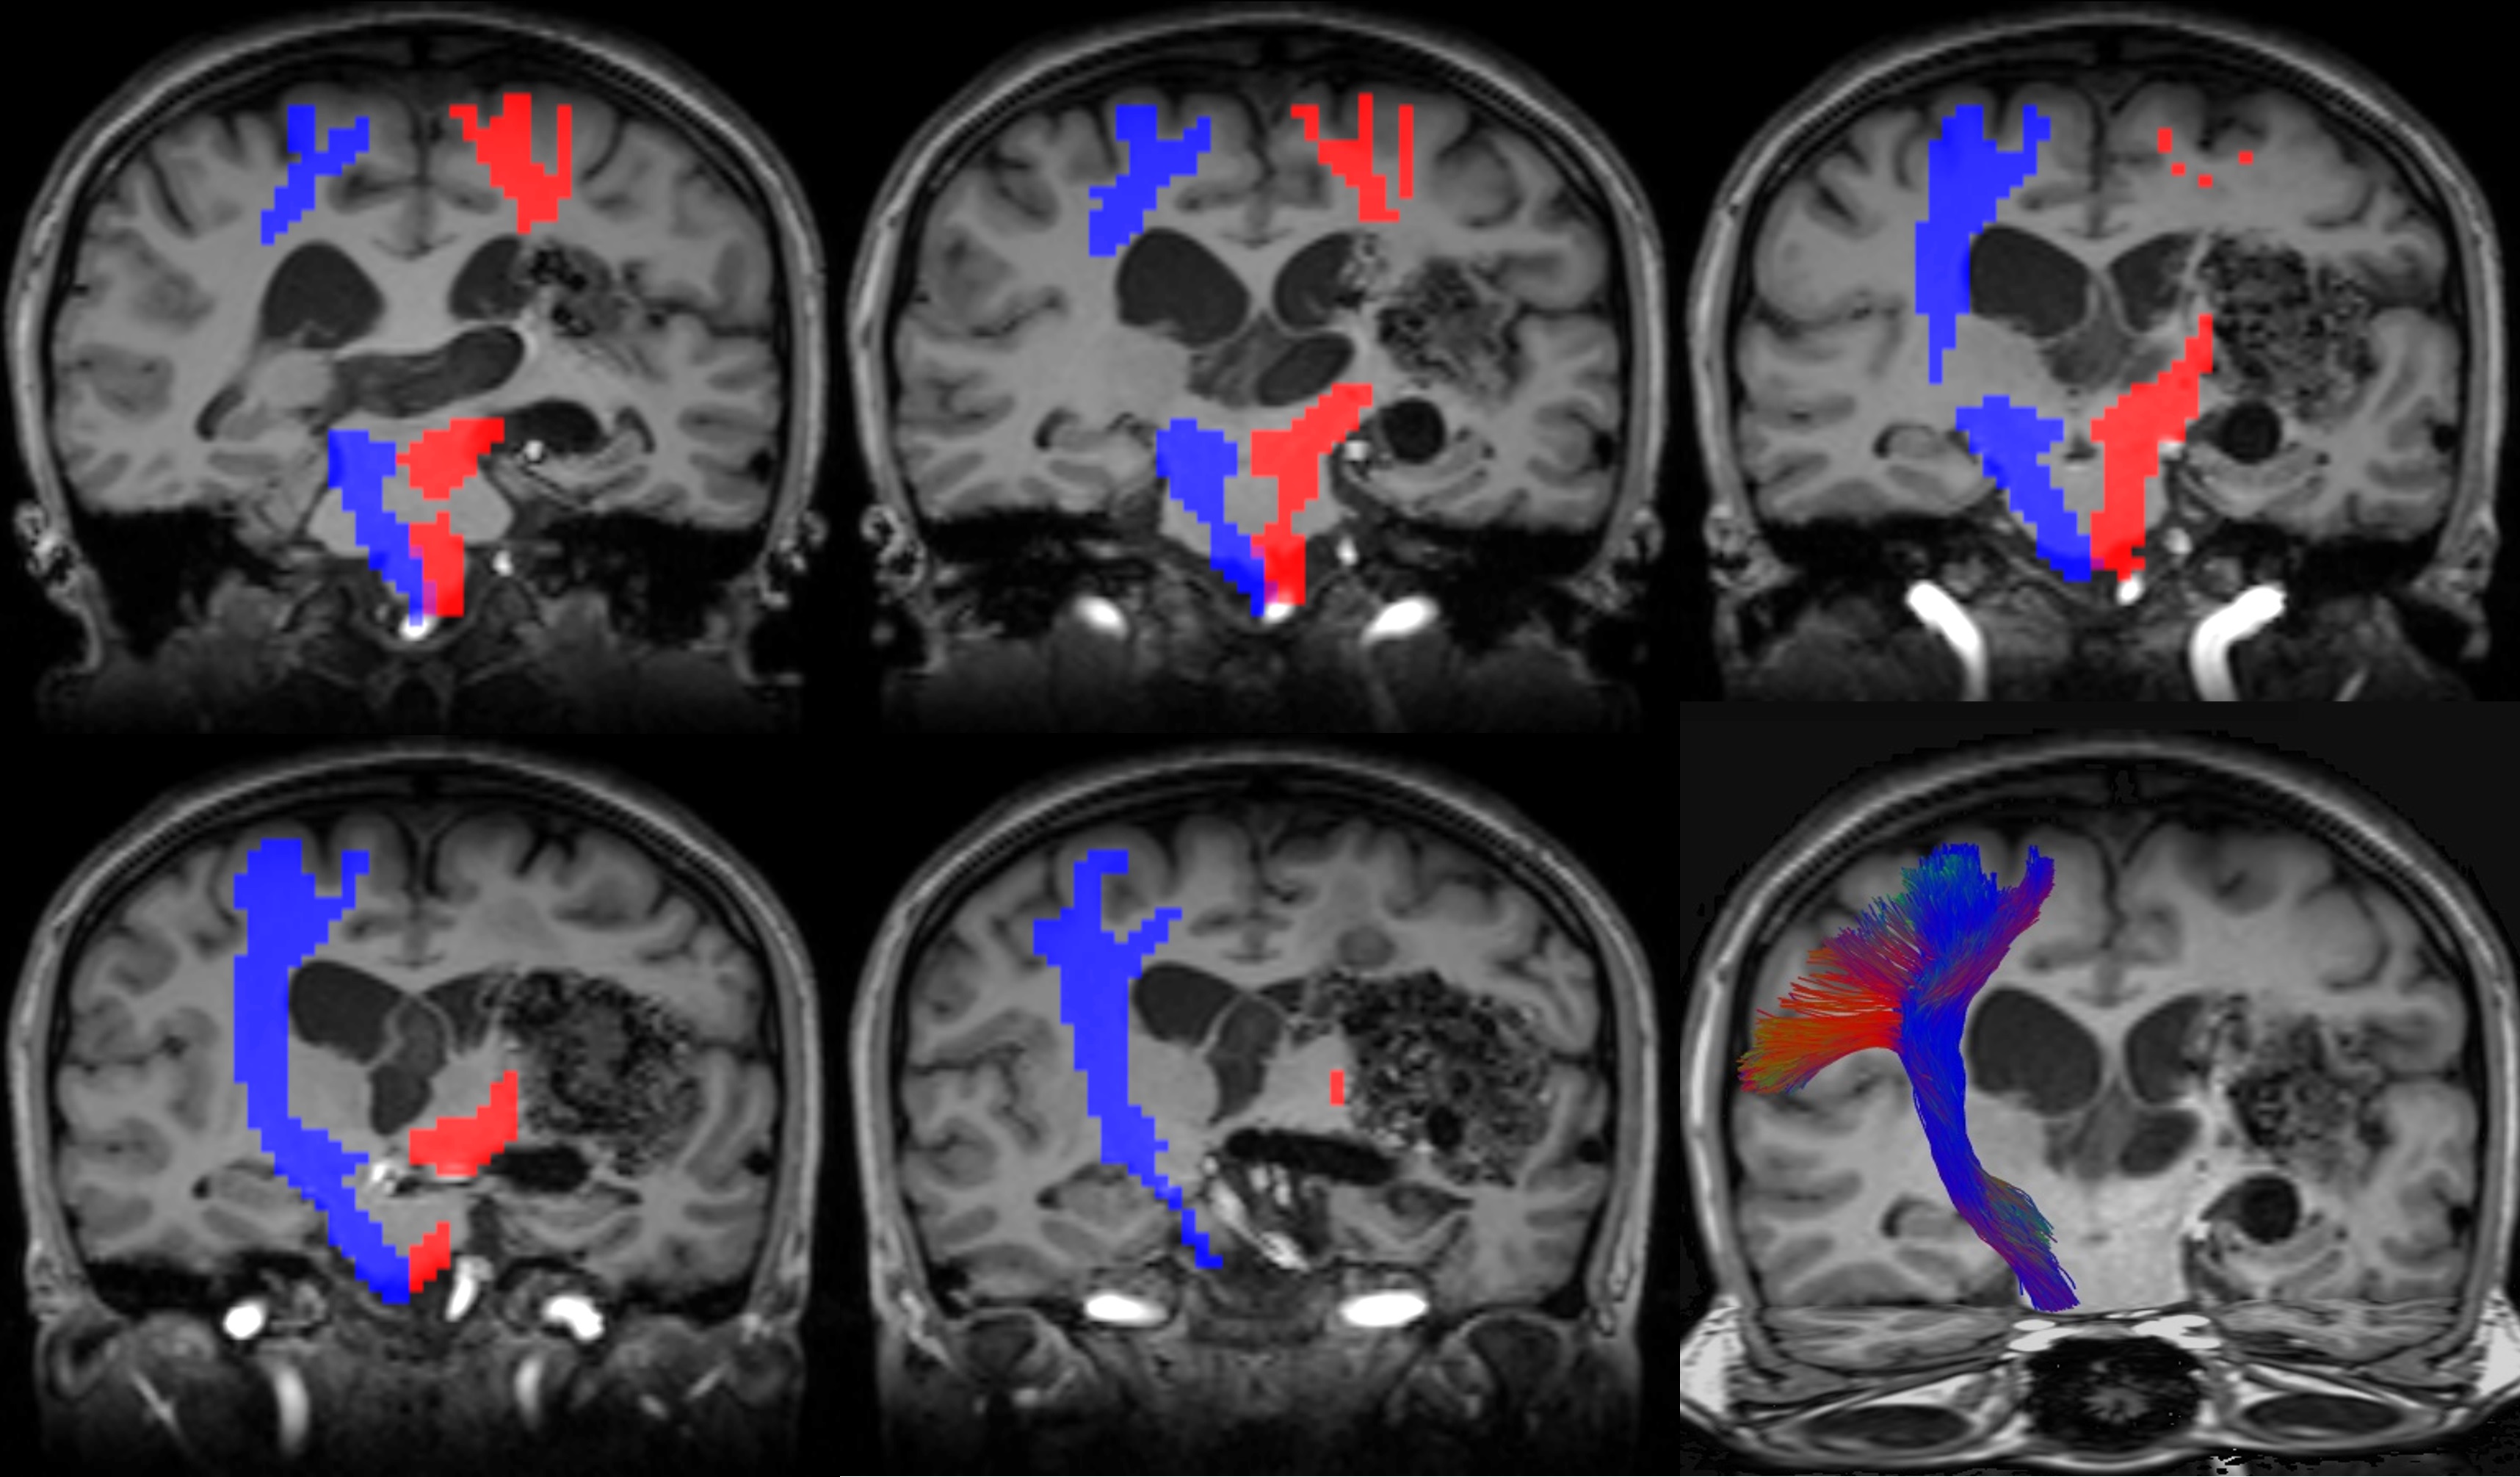
Fig.5. Result of case 2 in group A
Blue voxel indicates the extracted area of right CST.
Red voxel indicates the extracted area of left CST.
In left CST, the part of the tractography is not depicted because there is no continuity of area extraction of the area. However, the area of left CST was reconstructed from the cranial to foot sides, which is more informative than traditional tractography.