3015
Application of Deterministic Tractography Analysis Using SIGMA atlas: Stroke Model1Lee Gil Ya Cancer and Diabetes Institute, Incheon, Korea, Republic of
Synopsis
Unlike image analysis studies with human subjects, where various programs have been developed and validated to provide a complete assessment and step-by-step work procedure, methods for analyzing image data using MRI in preclinical research settings have not been agreed upon. Therefore, in this study, for the high-accuracy SIGMA atlas, we present a deterministic tractographic analysis pipeline that can perform detailed structural segmentation of the rat brain and confirm structural connectivity based on the segmented regions.
Introduction
Preclinical studies using rats are the experimental subjects of choice for many researchers due to their close reflection of human biology1,2. Studies have used Magnetic Resonance Image (MRI) exhibiting high spatial resolution and contrasts to accurately identify and delineate brain regions3-5. In addition, tractographic analysis using diffusion tensor imaging (DTI), a method that utilizes diffusion to construct fibers representing the neural structure of white matter, have been used to identify partially altered neural connections that can contribute to various neurological and psychiatric diseases6-8. The method of generating tractography is typically divided into a deterministic method and a probabilistic method, depending on the fiber orientation sampling method used for tractography propagation. Especially, a recent study comparing tractographic algorithms reported that deterministic tractographic methods can sometimes outperform probabilistic methods9-12. However, there is no scientific consensus on how to analyze image data and atlas-based neuroinformatics in Rat studies13. In this study, we present a comprehensive methodology using detailed structural segmentation of the rat brain is possible using SIGMA atlas, which has recently shown high accuracy, for deterministic tractographic analysis of structural connectivity based on the segmented structural region. We applied our methodology presented in our study to the brains of normal Rat and stroke Rat models.Material and Method
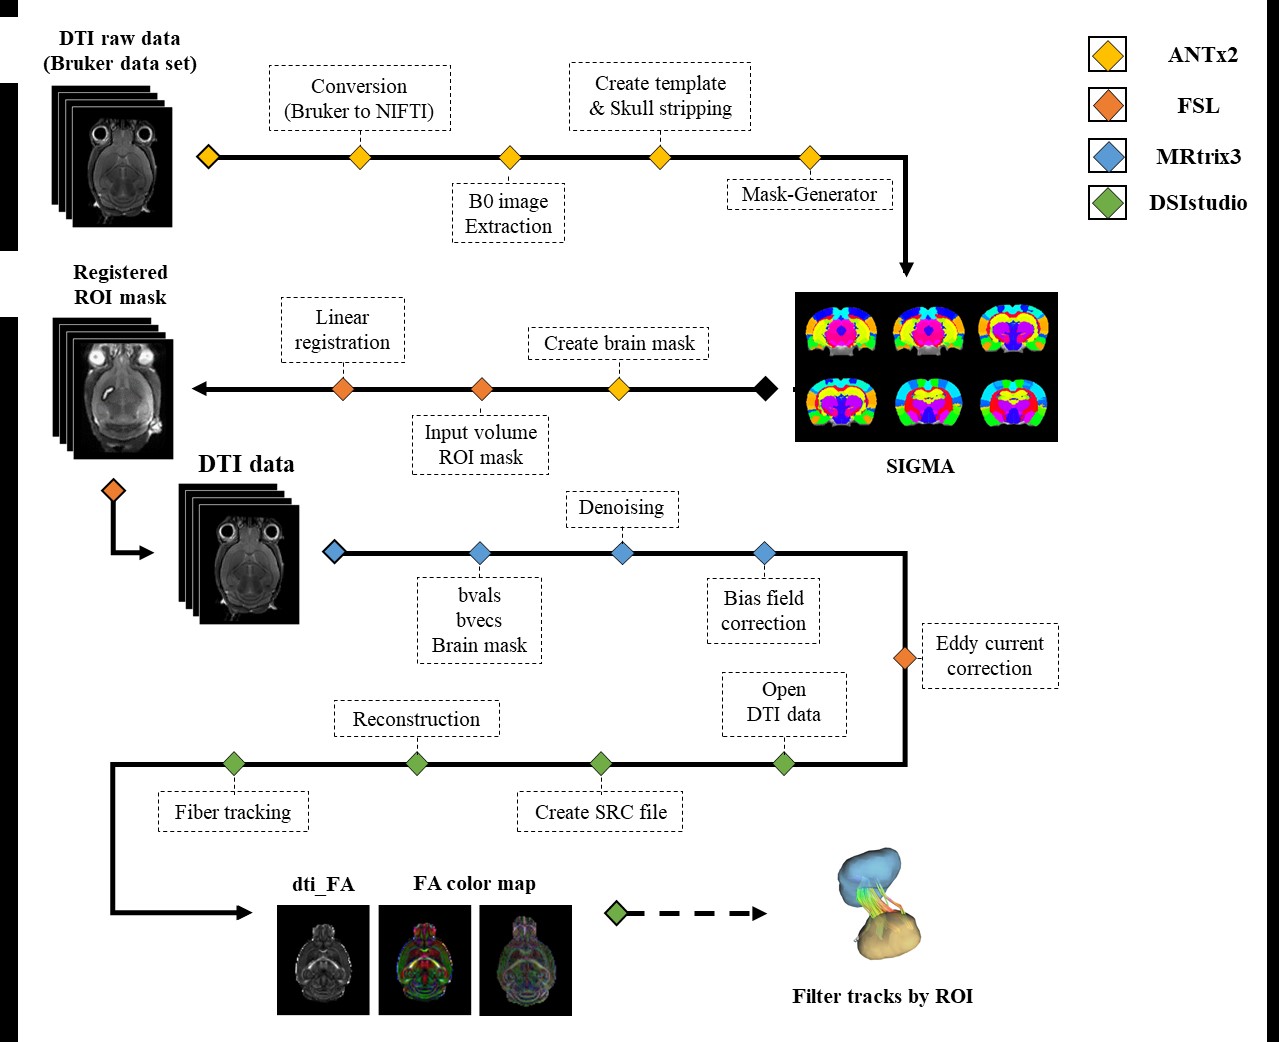
Analysis methods were applied on 1 normal rat and 7 middle cerebral artery occlusion(MCAO) model rats. Image data acquired in this study were performed on a 9.4T Bruker BioSpec horizontal bore animal scanner equipped with a tilt system of(660 mT/m). The image data collection of normal rats was performed at the Core facility for Cell to In-vivo Imaging(CII), and the image data collection of the MCAO model was performed at Sungkyunkwan University N Center(IBS). The pulse sequence used for this acquisition was a 2D EPI-diffusion tensor, with a normal Rat(SE sequence with a TR=2500ms, TE=21.3165ms, FA=90°, BW=170kHz, b-value=2011.85s/mm², Duration(δ)=4.5ms, Separation(Δ)=10.6ms, diffusion direction=30, FOV=2.5× 3.5cm, ST=0.4mm, Matrix=125×175, slice=40, Resolution=200x200x400µm, 4averages and resulting in a total acquisition time of 1h15m 50s) and modeling Rat (SE sequence with a TR=3000ms, TE=17.1ms, FA=90°, BW=341kHz, b-value=1389.93s/mm², Duration(δ)=2.5ms, Separation(Δ)=8.5ms, diffusion direction=30, FOV=2.5×2.5cm, ST=0.3mm, Matrix=83×83, Slice=115, Resolution=301x301x300µm, 2 averages and resulting in a total acquisition time of 28m) were scanned. The acquired DTI data was first processed via ANTx214-16. Data in Bruker format was converted to NIFTI format and normalized to SIGMA space. Brain and brain structure masks were acquired by segmenting each ROI used for analysis on the extracted b0 image data. The acquired ROI masks were registered to the DTI data using the FSL. MRtrix3 was used for the preprocessing of the DTI data17. Additionally, FSL's eddy correct was used to correct for distortions and motion artifacts18. The preprocessed data were used for deterministic tractography analysis in DSIsudio. The analysis pipeline is presented in Figure 1.Result
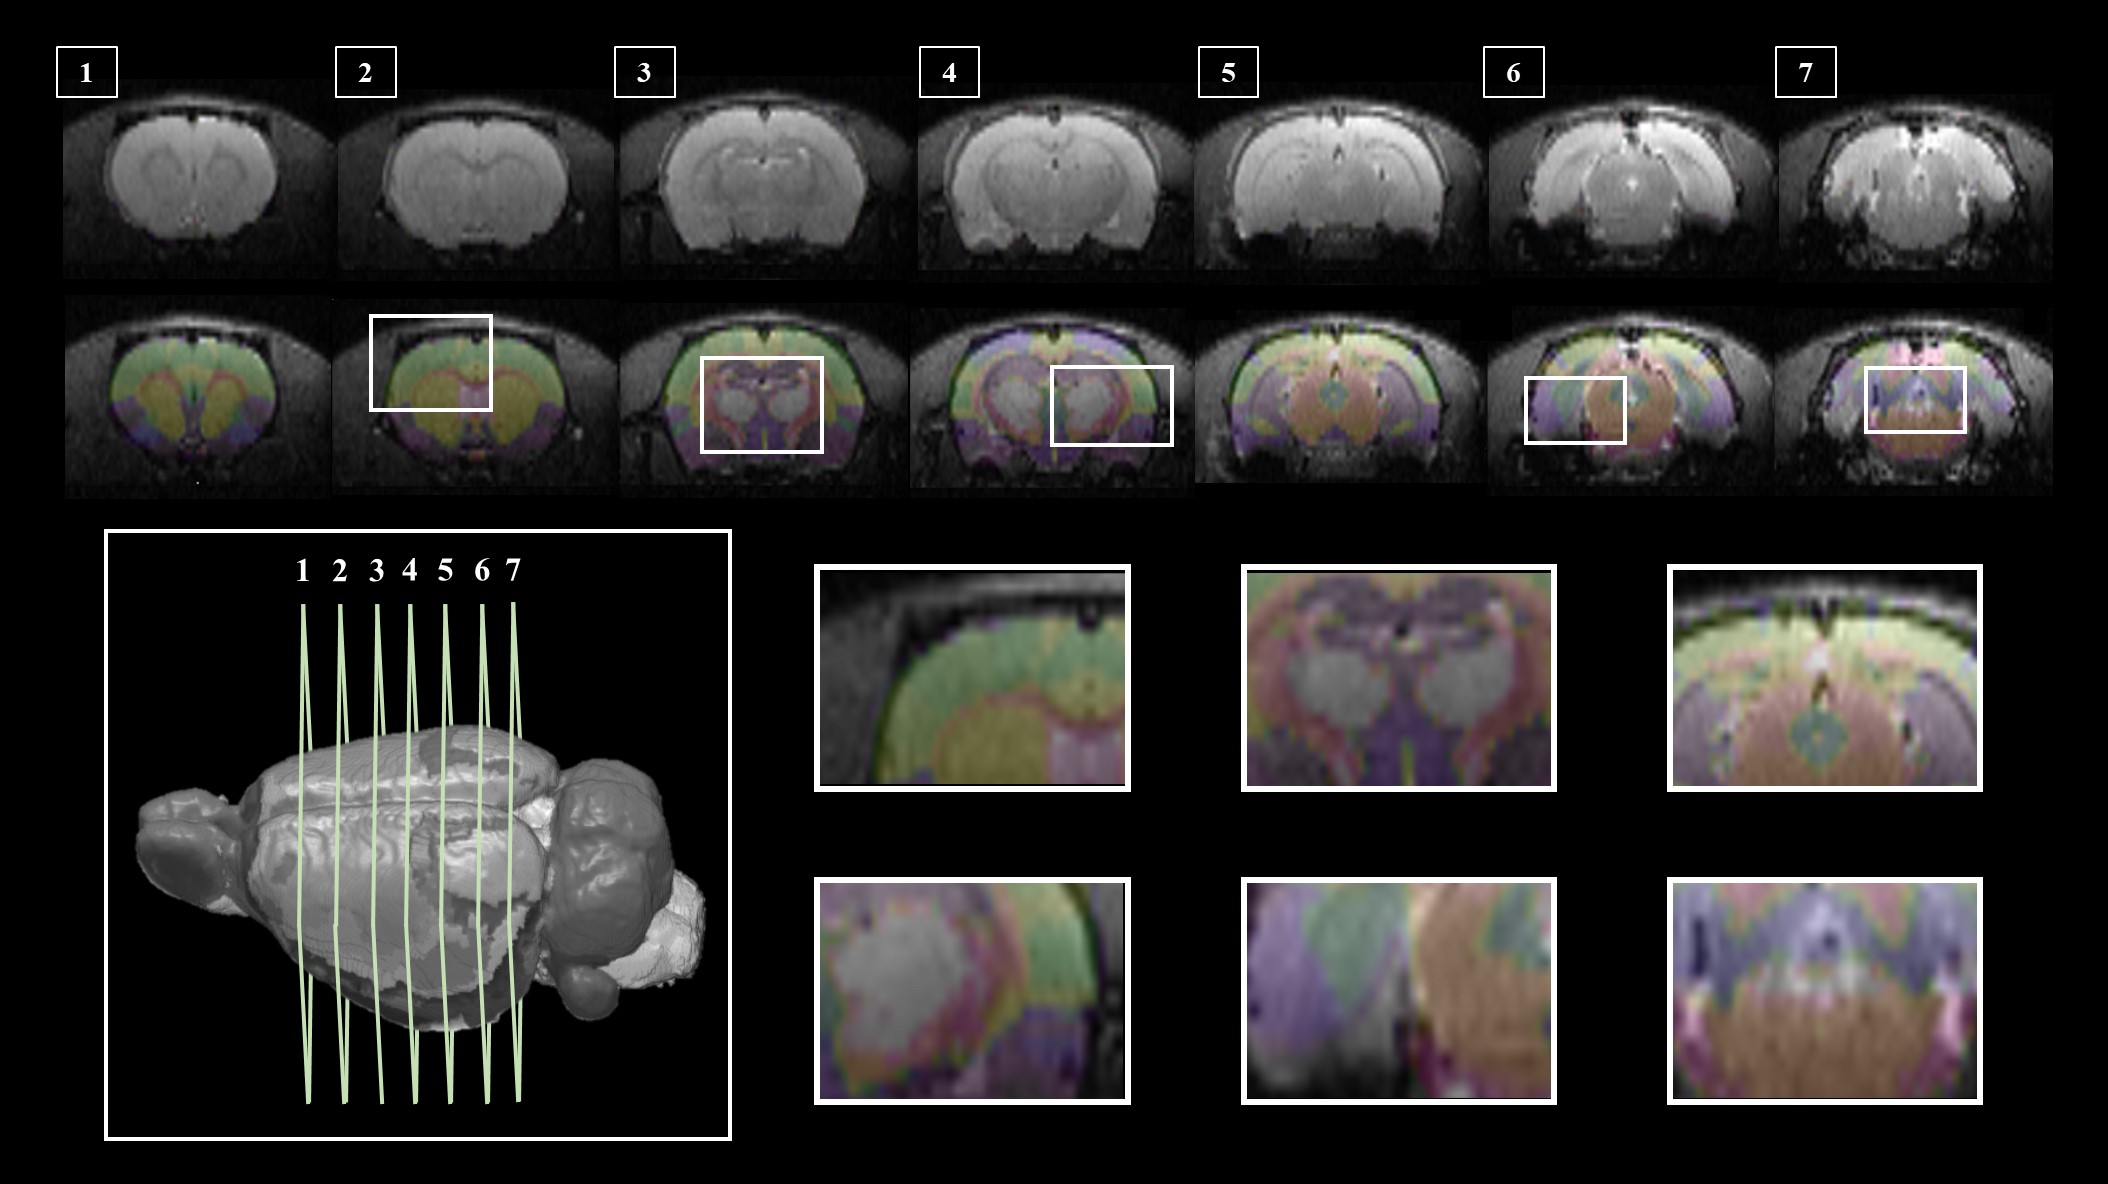
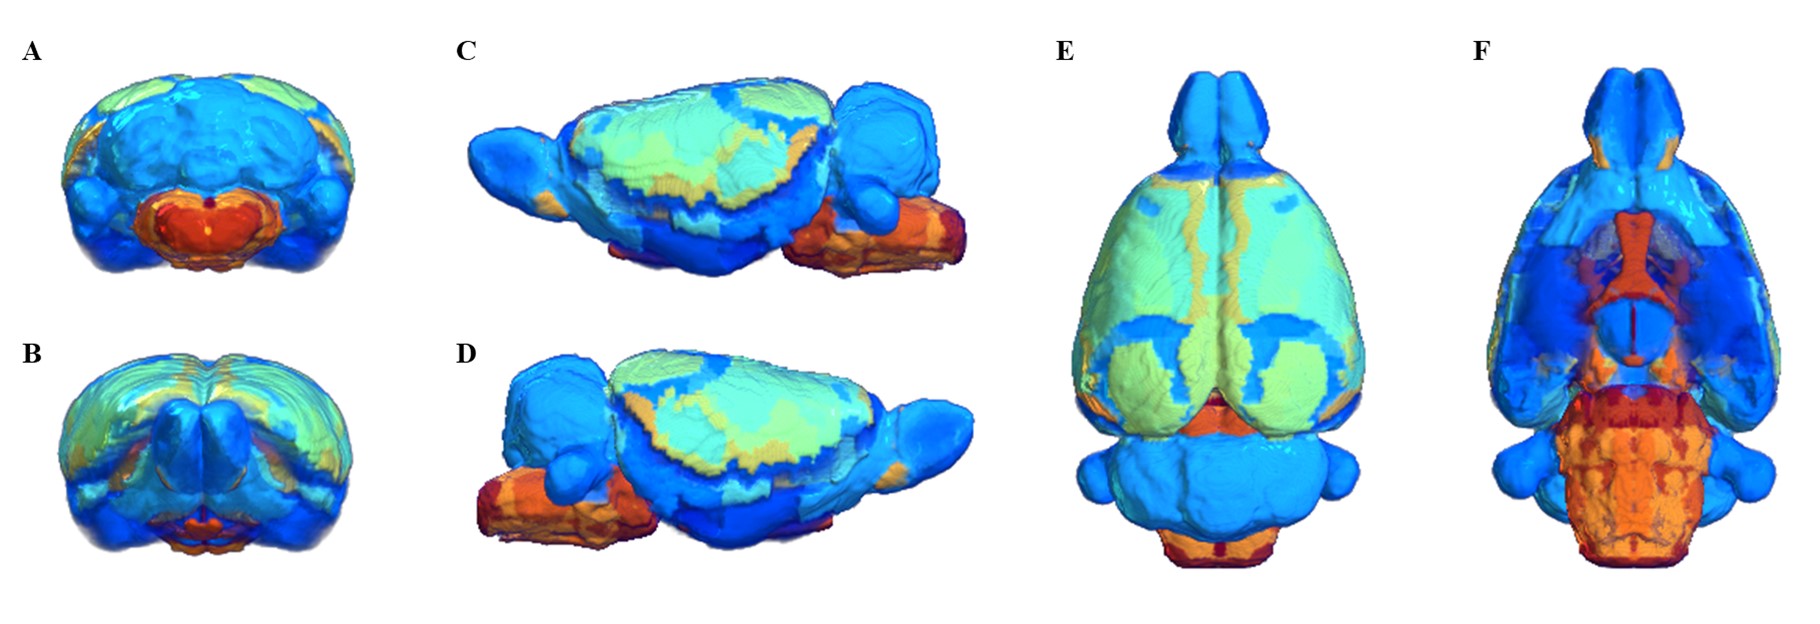
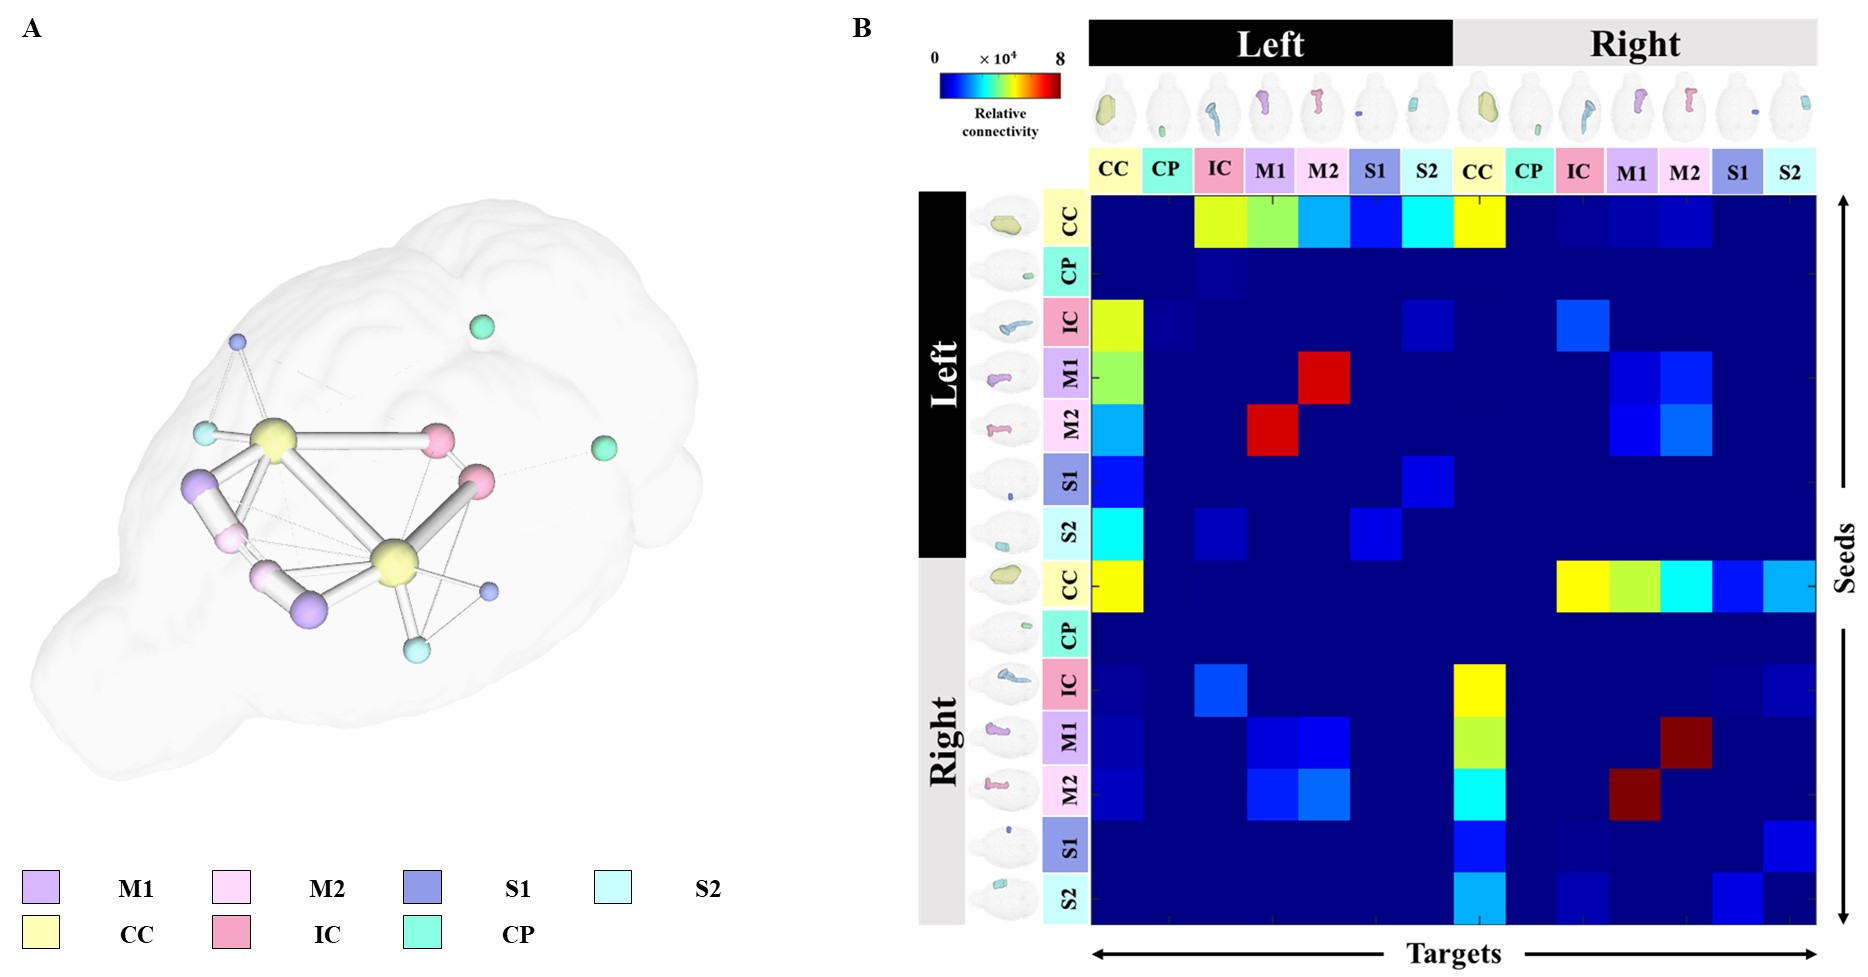
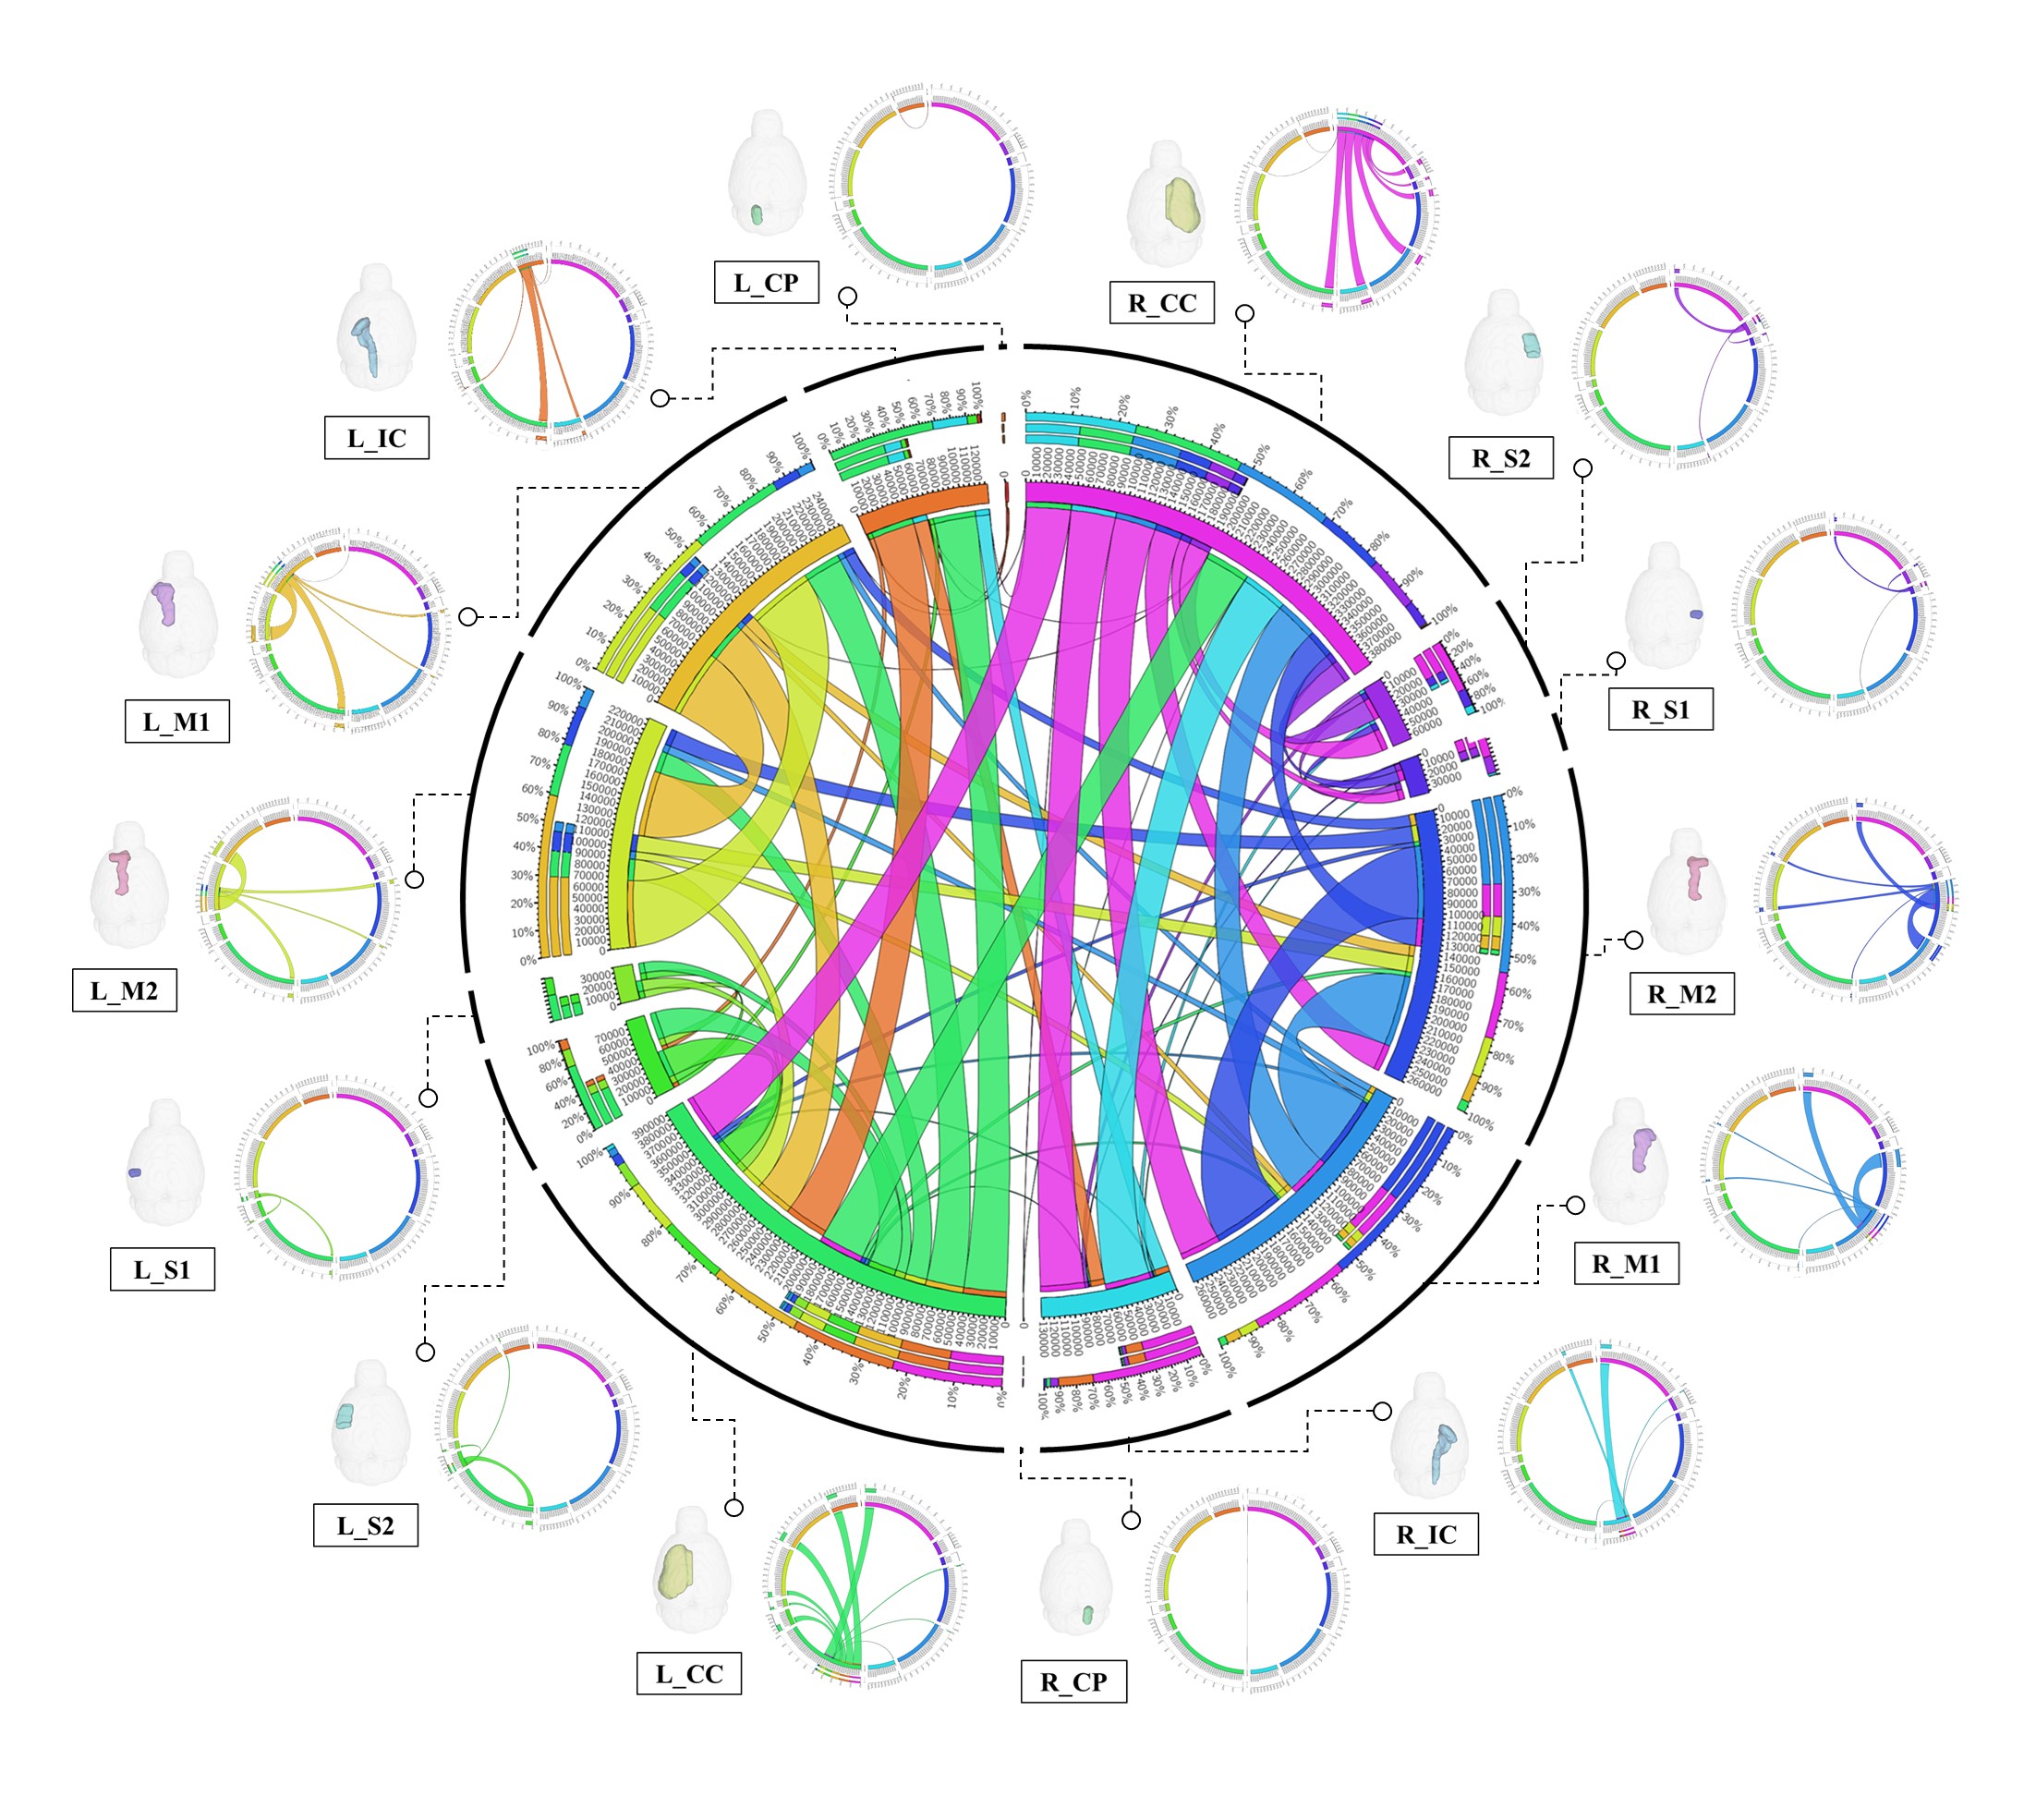
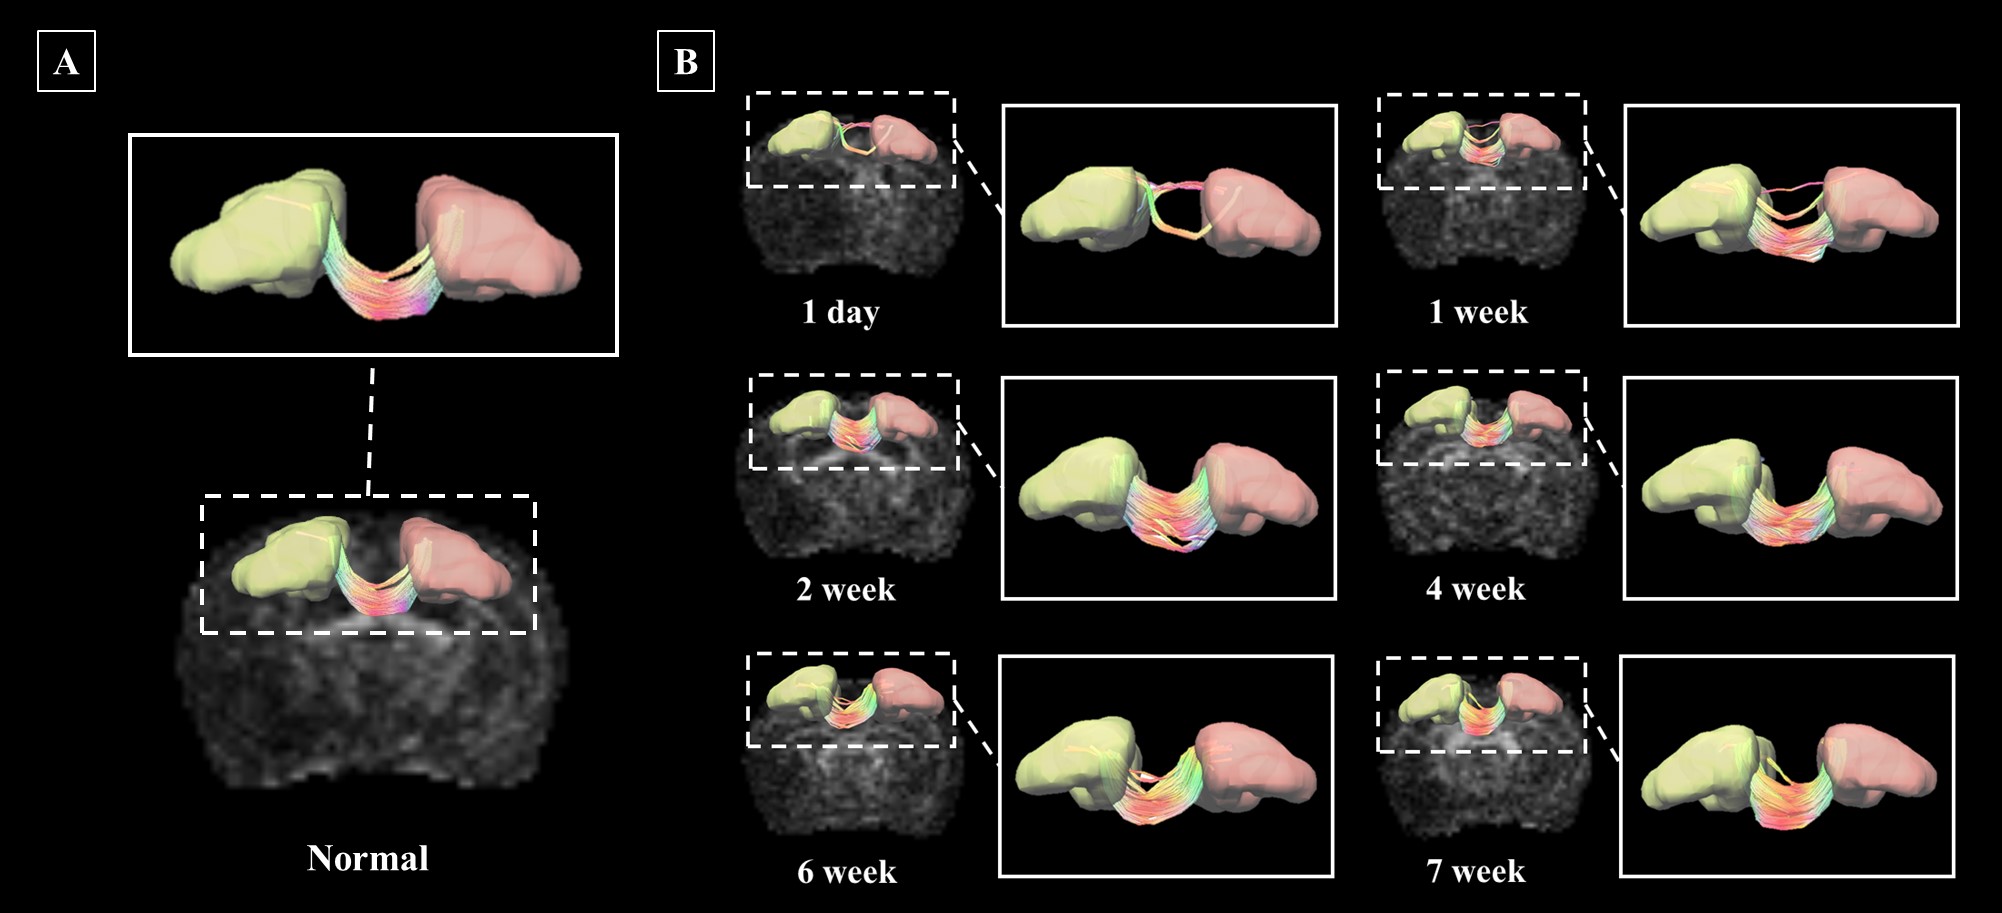
Segmentation of whole brain structural regions of rats using the SIGMA atlas was performed on B0 data by registering both data and atlas to accurately overlap. In order to qualitatively verify the accurate segmentation information of detailed structures, the segmented brain structure region on the B0 image data is visualized in Figure 2. The segmentation and registration results are 3D rendered and presented in Figure 3 so that location information and shapes can be checked from various directions. For structural connectivity, seven regions(M1,M2,S1,S2,CC,IC,CP) related to the corticospinal tract(CST) that transmit movement-related information from the cerebral cortex to the spinal cord were segmented and registered. Each structural region was divided into seed and target, and deterministic tractographic analysis was performed, with the results indicating the connectivity between each structural region are presented in Figure 4 and Figure 5. Figure 4-A shows a 3D rendering of a rat's brain and each structural region, providing localization and visualization of connectivity strength between each region. Furthermore, the connection strength between structural regions is presented in matrix form in Figure 4-B for direct comparison. Figure 5 presents a connectogram plot showing the strength of the connections in each structural region. Figure 6 investigates structural connectivity in the motocortex of the left and right hemispheres known to suffer from stroke.Discussion and conclusion
We present a tractographic analysis pipeline that can determine the segmentation of detailed structural regions and connectivity based on structural regions using MRI image data of the rat brain. The pipeline efficiently combines a variety of existing neuroimaging analysis tools to enable structural segmentation and tractographic analysis. In addition, the entire brain template of Rat is provided using the highly accurate SIGMA atlas from which a researcher can acquire detailed structural region information through segmentation, as well as perform regional analysis of image data19. In this study, we presented a structural analysis and structural connectivity analysis pipeline of the rat brain by efficiently combining various existing neuroimaging analysis tools. From the results, we were able to successfully extract and segment individual ROI masks, and perform tractgraphic analysis. In the future, there is a need to increase the sample number and proceed to a longitudinal study. The pipeline presented in this study can contribute to standardizing various data types and analysis methods in the field of neuroscience using preclinical animals, and can enable comprehensive application of structural analysis and structural connectivity.Acknowledgements
This research was supported by the Bio & Medical Technology Development Program of the National Research Foundation (NRF)& funded by the Korean government (MSIT) (No. 2020M3A9E4104384) and Gachon University research fund of 2020 (No. GCU-202003020001).References
1. Cozzi J, Fraichard A, Thiam K (2008) Use of genetically modified rat models for translational medicine. Drug discovery today 13(11-12):488-494.
2. Veraart J, Leergaard TB, Antonsen BT, Van Hecke W, Blockx I, Jeurissen B, Jiang Y, Van der Linden A, Jonhnson GA, Verhoye M, Sijbers J (2011) Population-averaged diffusion tensor imaging atlas of the Sprague Dawley rat brain. Neuroimage 58(4):975-983.
3. Badhwar A, Lerch JP, Hamel E, Sled JG (2013) Impaired structural correlates of memory in Alzheimer's disease mice. NeuroImage: Clinical 3:290-300.
4. Hébert F, Grand'Maison M, Ho MK, Lerch JP, Hamel E, Bedell BJ (2013) Cortical atrophy and hypoperfusion in a transgenic mouse model of Alzheimer's disease. Neurobiology of aging 34(6):1644-1652.
5. Pearn ML, Niesman IR, Egawa J, Sawada A, Almenar-Queralt A, Shah SB, Duckworth JL, Head BP (2017) Pathophysiology associated with traumatic brain injury: current treatments and potential novel therapeutics. Cellular and molecular neurobiology 37(4):571-585.
6. Xue K, Luo C, Zhang D, Yang T, Li J, Gong D, Chen L, Medina YI, Gotman J, Zhou D, Yao D (2014) Diffusion tensor tractography reveals disrupted structural connectivity in childhood absence epilepsy. Epilepsy research 108(1):125-138.
7. Ciccarelli O, Toosy AT, Parker GJ, Wheeler-Kingshott CAM, Barker GJ, Miller DH, Thompson AJ (2003) Diffusion tractography based group mapping of major white-matter pathways in the human brain. Neuroimage 19(4):1545-1555.
8. Dauguet J, Peled S, Berezovskii V, Delzescaux T, Warfield SK, Born R, Westin CF (2007) Comparison of fiber tracts derived from in-vivo DTI tractography with 3D histological neural tract tracer reconstruction on a macaque brain. Neuroimage 37(2):530-538.
9. Hu B, Ye B, Yang Y, Zhu K, Kang Z, Kuang S, Kuang S, Luo L, Shan H (2011) Quantitative diffusion tensor deterministic and probabilistic fiber tractography in relapsing–remitting multiple sclerosis. European journal of radiology 79(1):101-107.
10. Bucci M, Mandelli ML, Berman JI, Amirbekian B, Nguyen C, Berger MS, Henry RG (2013) Quantifying diffusion MRI tractography of the corticospinal tract in brain tumors with deterministic and probabilistic methods. NeuroImage: Clinical 3:361-368.
11. Petersen MV, Lund TE, Sunde N, Frandsen J, Rosendal F, Juul N, Østergaard K (2017) Probabilistic versus deterministic tractography for delineation of the cortico-subthalamic hyperdirect pathway in patients with Parkinson disease selected for deep brain stimulation. Journal of neurosurgery 126(5):1657-1668.
12. Sarwar T, Ramamohanarao K, Zalesky A (2019) Mapping connectomes with diffusion MRI: deterministic or probabilistic tractography?. Magnetic resonance in medicine 81(2):1368-1384.
13. Pallast N, Diedenhofen M, Blaschke S, Wieters F, Wiedermann D, Hoehn M, Fink GR, Aswendt M (2019) Processing pipeline for atlas-based imaging data analysis of structural and functional mouse brain MRI (AIDAmri). Frontiers in neuroinformatics 13:42.
14. Lein ES, Hawrylycz MJ, Ao N, Ayres M, Bensinger A, Bernard A, Boe AF, Boguski MS, Brockway KS, Byrnes EJ, Chen L, Chen L, Chen TM, Chin MC, Chong J, Crook BE, Czaplinska A, Dang CN, Datta S, Dee NR, Desaki AL, Desta T, Diep E, Dolbeare TA, Donelan MJ, Dong HW, Dougherty JG, Duncan BJ, Ebbert AJ, Eichele G, Estin LK, Faber C, Facer BA, Fields R, Fischer SR, Fliss TP, Frensley C, Gates SN, Glattfelder KJ, Halverson KR, Hart MR, Hohmann JG, Howell MP, Jeung DP, Johnson RA, Karr PT, Kawal R, Kidney JM, Knapik RH, Kuan CL, Lake JH, Laramee AR, Larsen KD, Lau C, Lemon TA, Liang AJ, Liu Y, Luong LT, Michaels J, Morgan JJ, Morgan RJ, Mortrud MT, Mosqueda NF, Ng LL, Ng R, Orta GJ, Overly CC, Pak TH, Parry SE, Pathak SD, Pearson OC, Puchalski RB, Riley ZL, Rockett HR, Rowland SA, Royall JJ, Ruiz MJ, Sarno NR, Schaffnit K, Shapovalova NV, Sivisay T, Slaughterbeck CR, Smith SC, Smith KA, Smith BI, Sodt AJ, Stewart NN, Stumpf KR, Sunkin SM, Sutram M, Tam A, Teemer CD, Thaller C, Thompson CL, Varnam LR, Visel A, Whitlock RM, Wohnoutka PE, Wolkey CK, Wong VY, Wood M, Yaylaoglu MB, Young RC, Youngstrom BL, Yuan XF, Zhang B, Zwingman TA, Jones AR (2007) Genome-wide atlas of gene expression in the adult mouse brain. Nature 445(7124):168-176.
15. Huebner NS, Mechling AE, Lee HL, Reisert M, Bienert T, Hennig J, von Elverfeldt D, Harsan LA (2017) The connectomics of brain demyelination: functional and structural patterns in the cuprizone mouse model. Neuroimage 146:1-18.
16. Koch S, Mueller S, Foddis M, Bienert T, von Elverfeldt D, Knab F, Farr TD, Bernard R, Dopatka M, Rex A, Dirnagl U, Harms C, Boehm-Sturm P (2019) Atlas registration for edema-corrected MRI lesion volume in mouse stroke models. Journal of Cerebral Blood Flow & Metabolism 39(2):313-323.
17. Cordero-Grande L, Christiaens D, Hutter J, Price AN, Hajnal JV (2019) Complex diffusion-weighted image estimation via matrix recovery under general noise models. Neuroimage 200:391-404.
18. Graham MS, Drobnjak I, Zhang H (2016) Realistic simulation of artefacts in diffusion MRI for validating post-processing correction techniques. NeuroImage 125:1079-1094.
19. Barrière DA, Magalhães R, Novais A, Marques P, Selingue E, Geffroy F, Marques F, Cerqueira J, Sousa JC, Boumezbeur F, Bottlaender M, Jay TM, Cachia A, Sousa N, Mériaux S (2019) The SIGMA rat brain templates and atlases for multimodal MRI data analysis and visualization. Nature communications 10(1):1-13.
Figures